Week 1- Mixing Tee
Aim: To set up steady-state simulations to compare the mixing effectiveness of hot and cold fluid when hot inlet temperature is 360C & the Cold inlet is at 190C
Theory:
Mixing tee is the steady-state simulation to comparing the mixing effectiveness of hot and cold fluid in short and long t-juction pipeline. A mixing tee is a device used in many chemical diffusion/mixing processes and in applications such as air conditioners for mixing of fresh and return air.
procedure of simulating:
- Firstly for two t-junction pipeline that is for short and long t-juction pipeline we meshing in the ansa software with coarse and fine mesh
- Then we conducted steady state simulation for coarse and fine mesh then we take out the result for both and compared both result. Coarse mesh gives more inaccurate result than the fine mesh.This comparision shown in image2
- To conduct steady state simulation firstly we meshing the t-junction pipeline in ansa software and meshed file we importing into the ansys fluent software
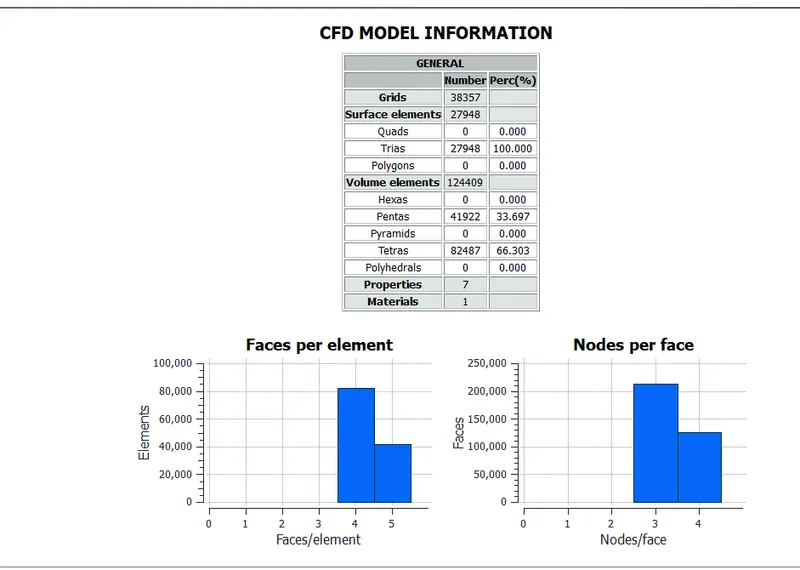
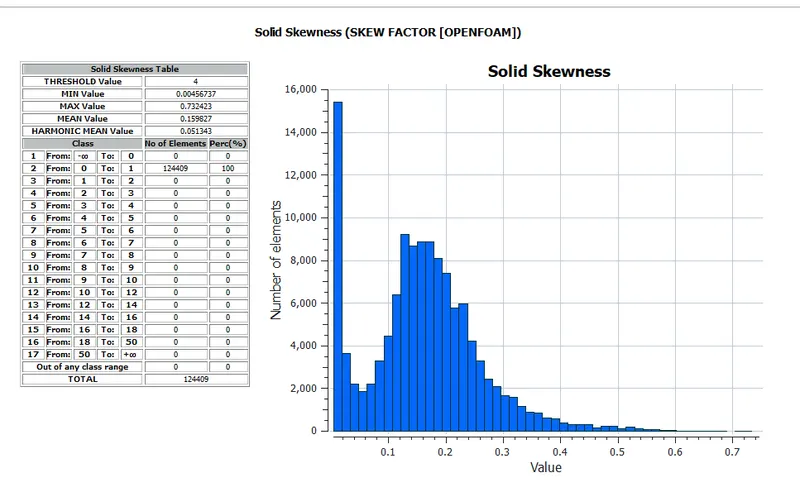
- Before importing we checking out the mesh quality result in ansa software.This checked results is shown in the image3
- After importing meshed file into ansys fluent software to perform steady state simulation we enabling the physics, selecting type of viscous, selecting the materials, Giving cell zone condition and lastly by giving boudary condition we intializing and run the calculation at certain iteration
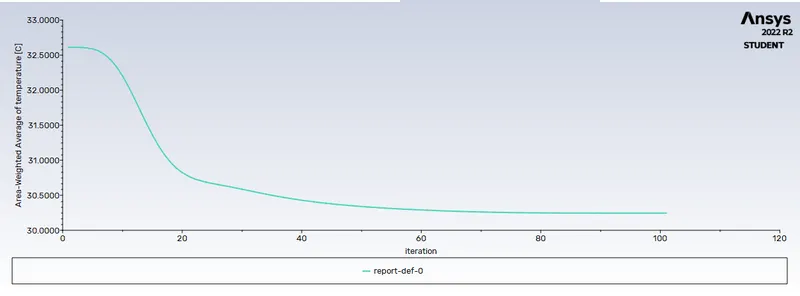
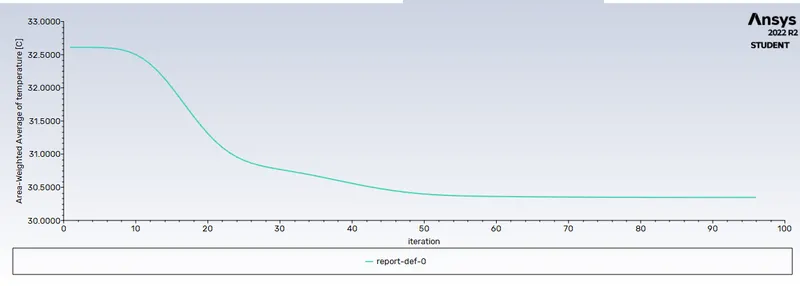
- Before intializing and calculating if we need average temperature graph at outlet for this in menubar under definition under surface report the option called area average weightage temperature we selecting.By this we get the average temperature graph at outlet
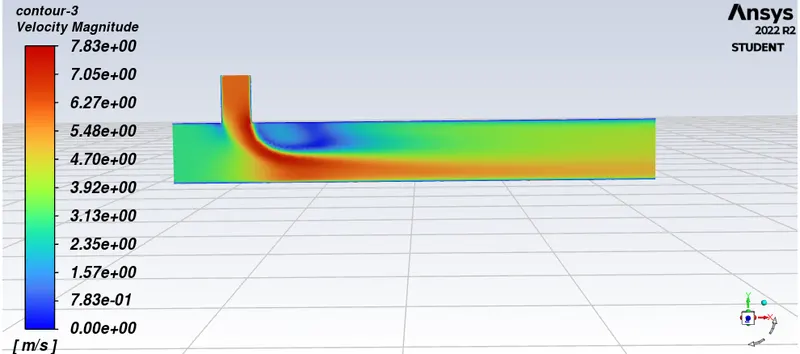
- and finally by run the simulation we take out the result this results is shown in image4
- Atlast we doing validation mean we comparing the simulating result into the emperimental result or theoritical calculation this calculation shown in calculation section below
- Note: suppose before intializing and run the calculation we do not know the cold inlet velocity but we know the momentun ratio from that we calculating the cold inlet velocity this calculation is shown in the calculation section below
calculation:
- To find the cold inlet velocity We know the momentum ratio vlaue 2,4 and putting momentum ratio values in momentum ratio formula we get the cold inlet velocity:
Formula is:- Momentum ratio = velocity at cold inlet / velocity at hot inlet
- for momentum ratio 2 cold inlet velocity is 6m/s
- for momentum ratio 4 cold inlet velocity is 12m/s
- while after simulating we do the validation by comparing simulated result with theoritical calculated result so for this we know the theoritical formula below and know the parameter value:
parameter value :- hot temperature =36degree celsius
cold temperature =19degree celsius
We know mass flow rate formula. By this the parameter called mass flow rate we finding. The formula of mass flow rate =rho*A*v
where :- rho = density ; A=area where fluid enter; v= velocity of inlet
Formula for theoritical calculation of end temperature is:
Substituting above parameter in the above formula we finds the end mixture temperature in outlet for the two momentum ratio 2,4
For momentum ratio is 2 'T' mixture value is 30.56degree celsius
For momentum ratio is 4 'T'mixture value is 28 degree celsius
Results:
Image1: The given short and long model
short long
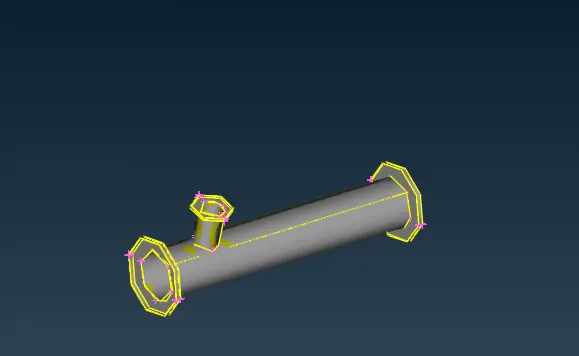
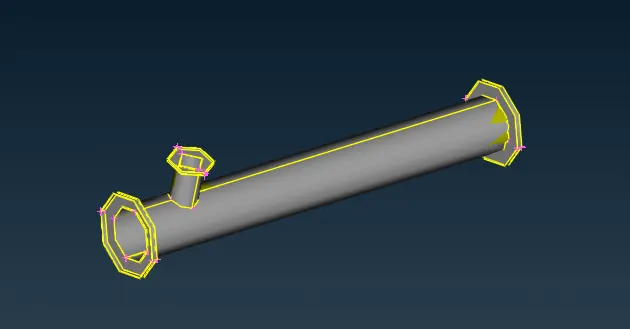
Image2: Comparision between coarse and fine mesh result after simulating coarse mesh and fine mesh
5mm coarse mesh gives inaccurate result 2mm fine mesh gives accurate result than coarse mesh
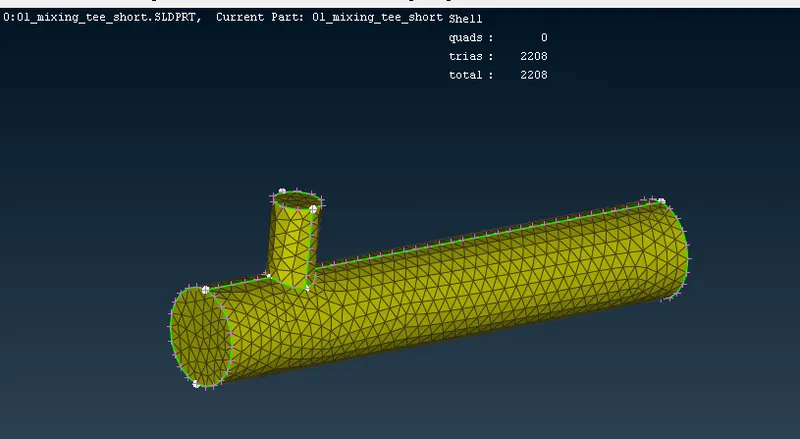
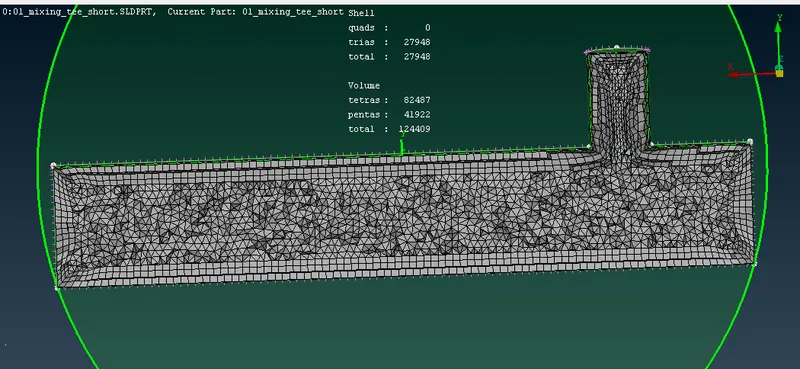
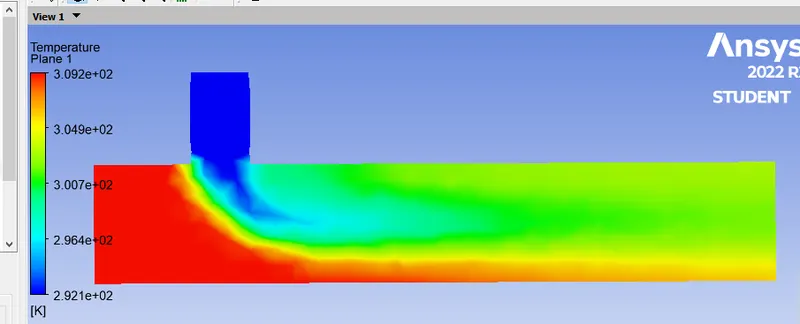
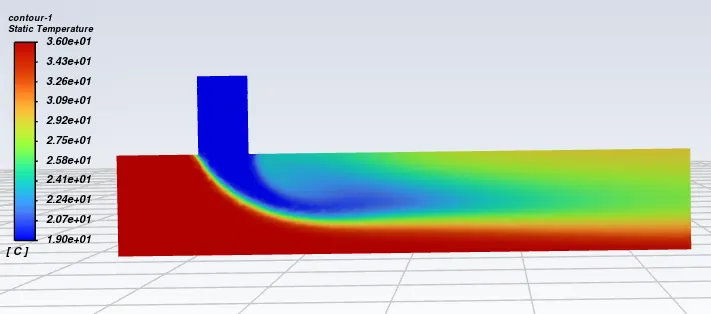
Image3: 2mm mesh quality for t-juction short and long pipeline
Short t-juctiopn pipeline
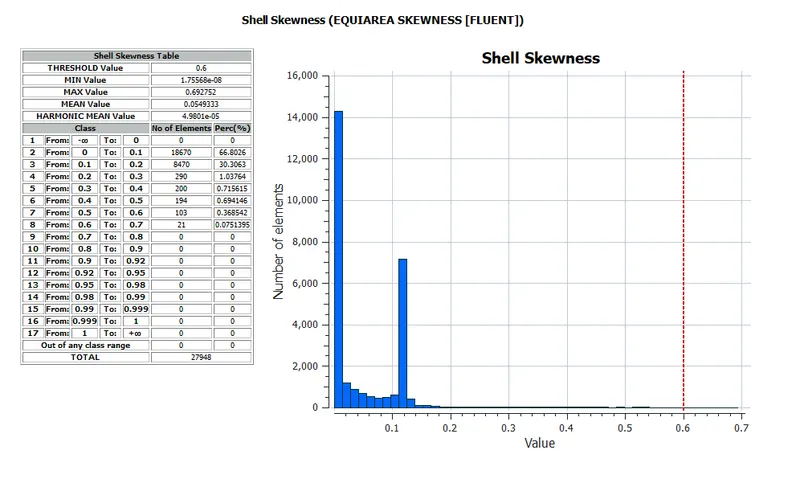
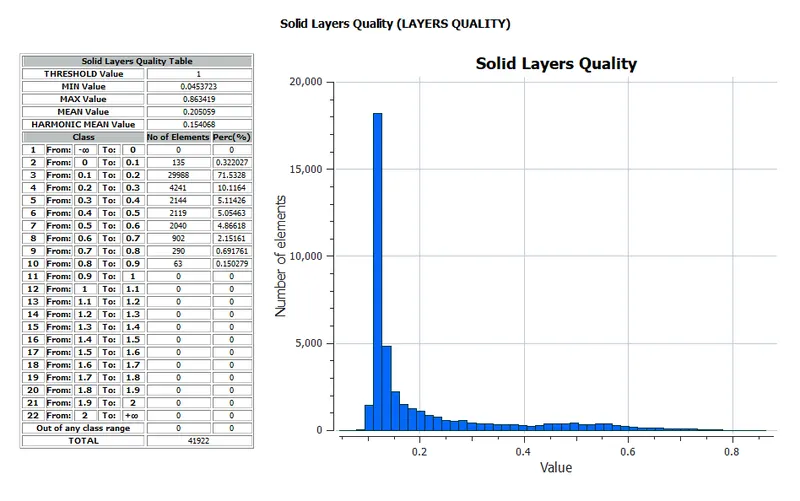

Long t-junction pipeline
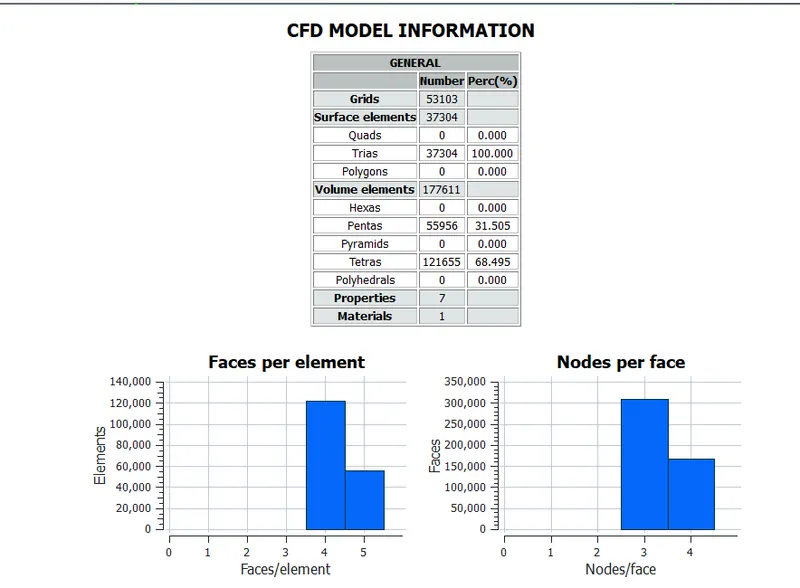
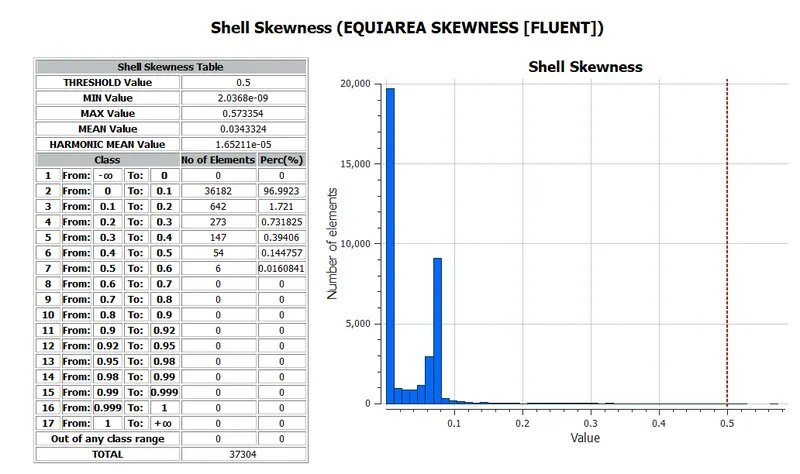
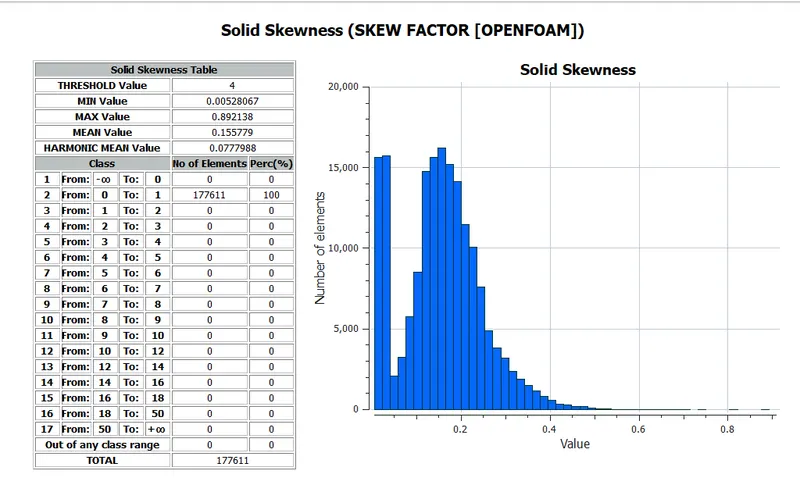
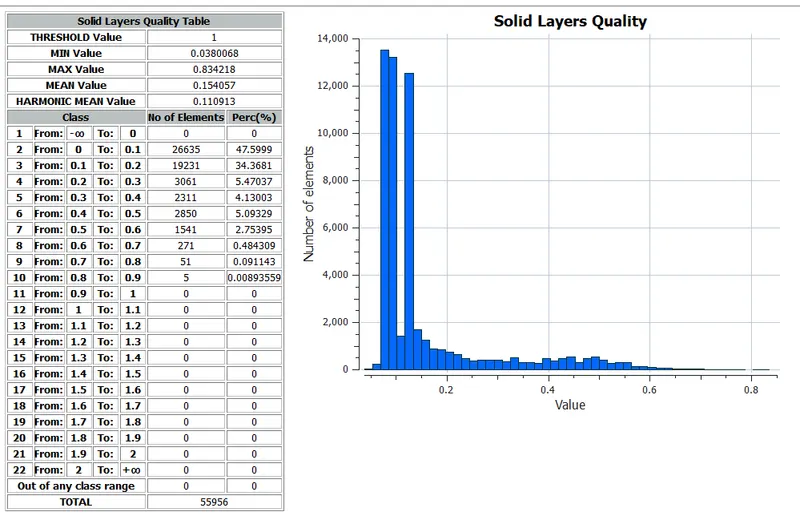
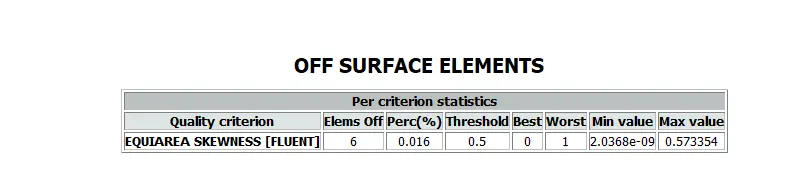
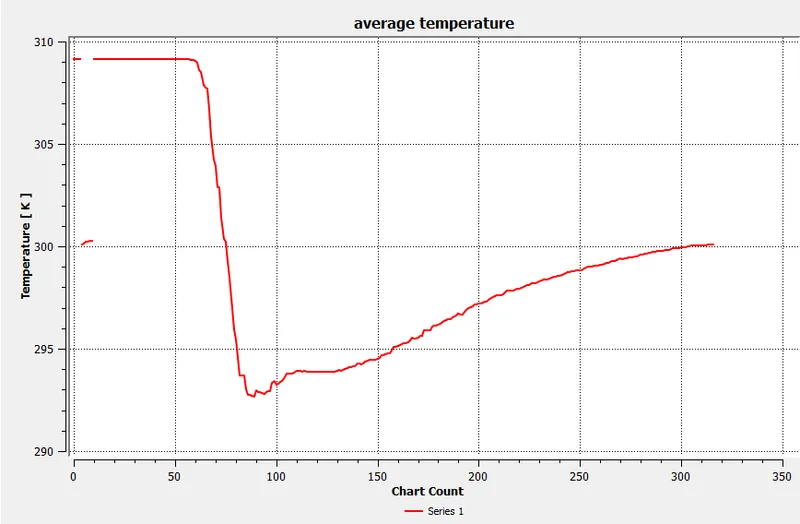
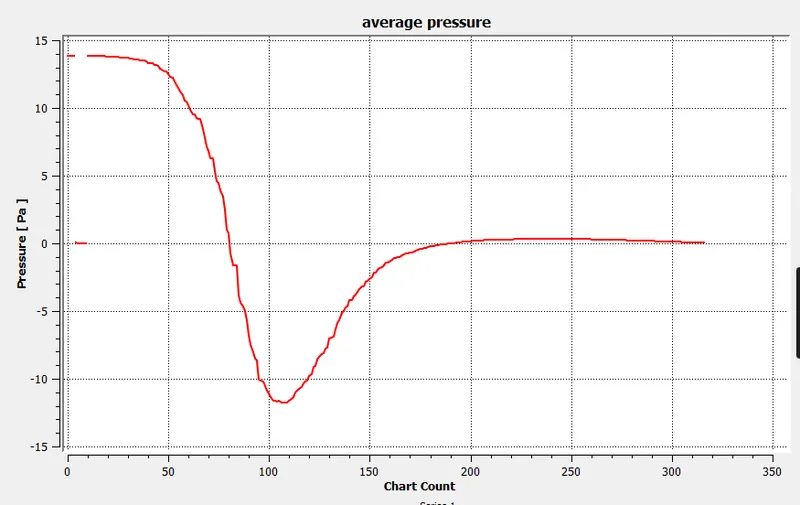
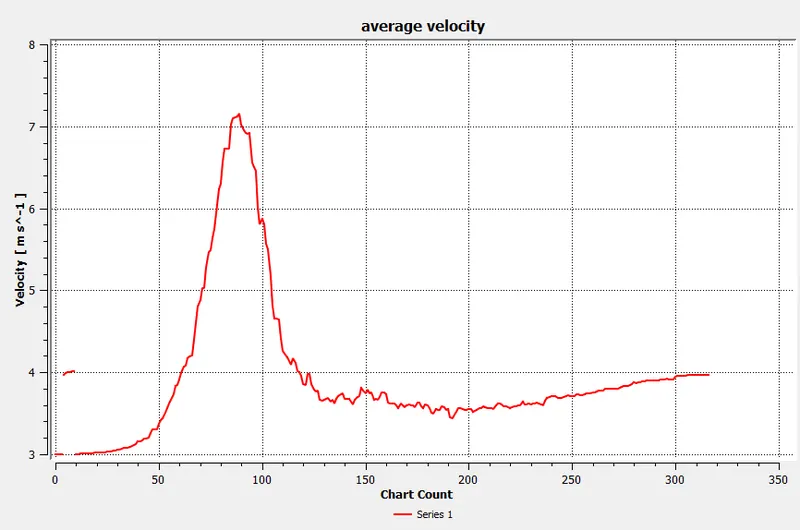
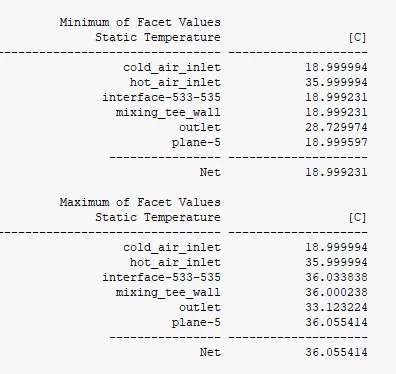
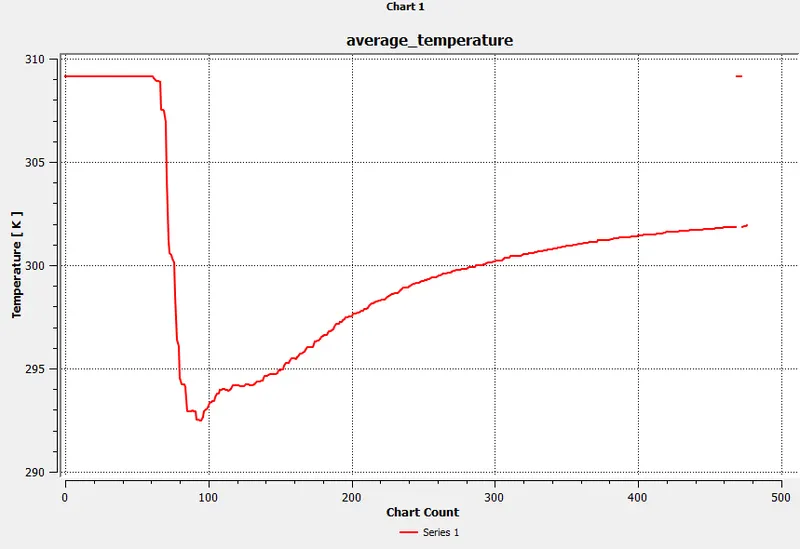
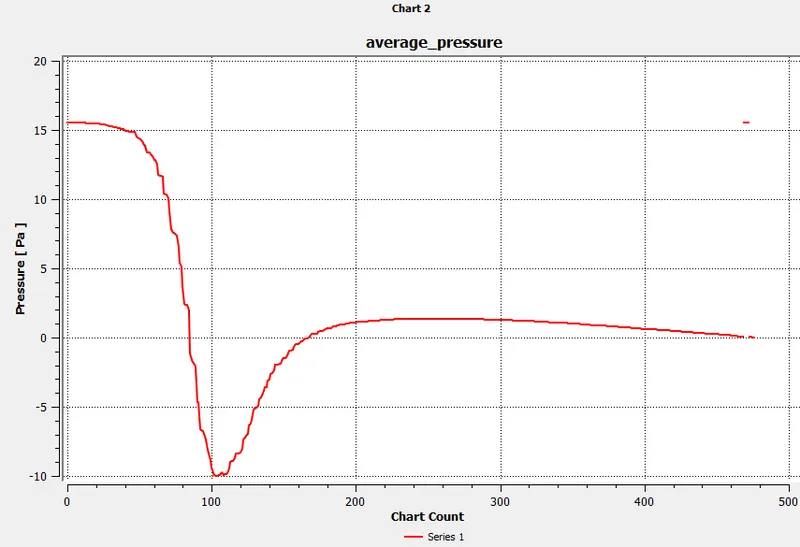
Image4: raph result for the short t-junction pipeline with momentum ratio2,4 and graph result for long t-junction pipeline with momentum ratio 2,4
- Graph result for the short t-junction pipeline
1.Momentum ratio for 2
a)Scaled residual plot
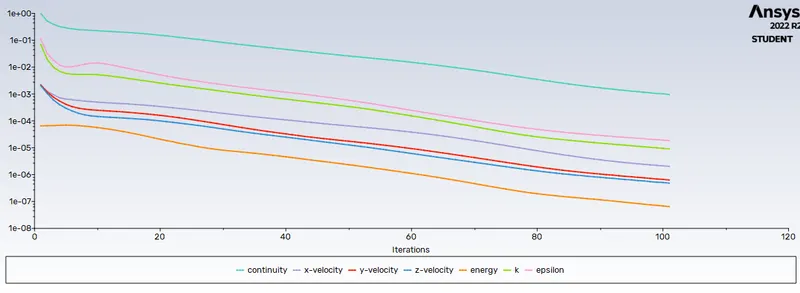
b)Average outlet temperature plot for 101 iteration
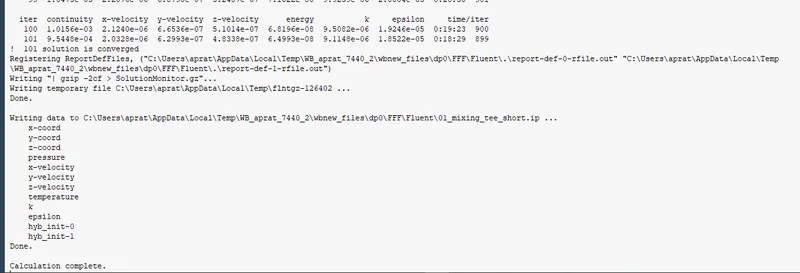
c)Result converged at 101 iteration result is
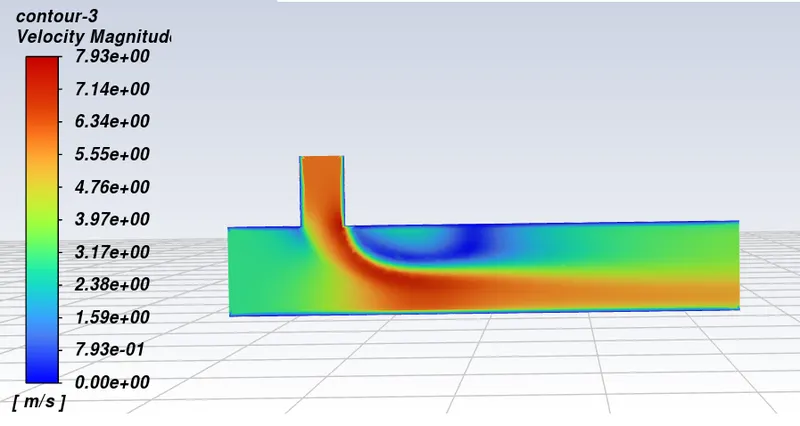
d)Contour plot for temperature e)Contour plot for the velocity
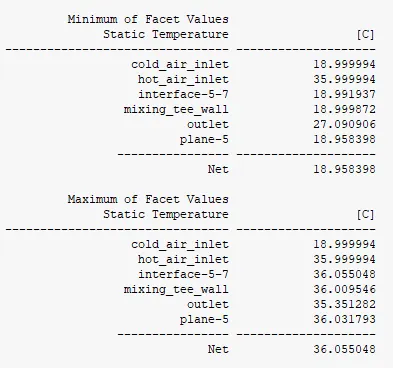
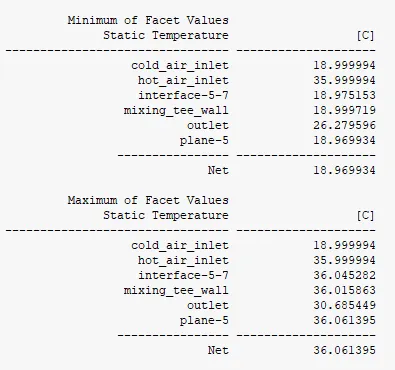
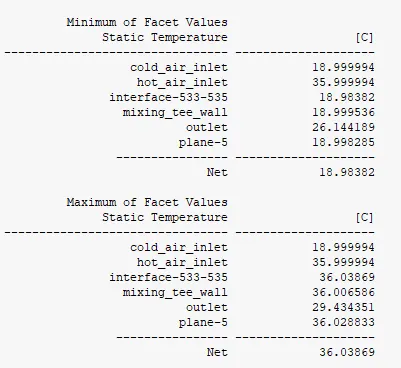
f)Result of minimum and maximum temperature
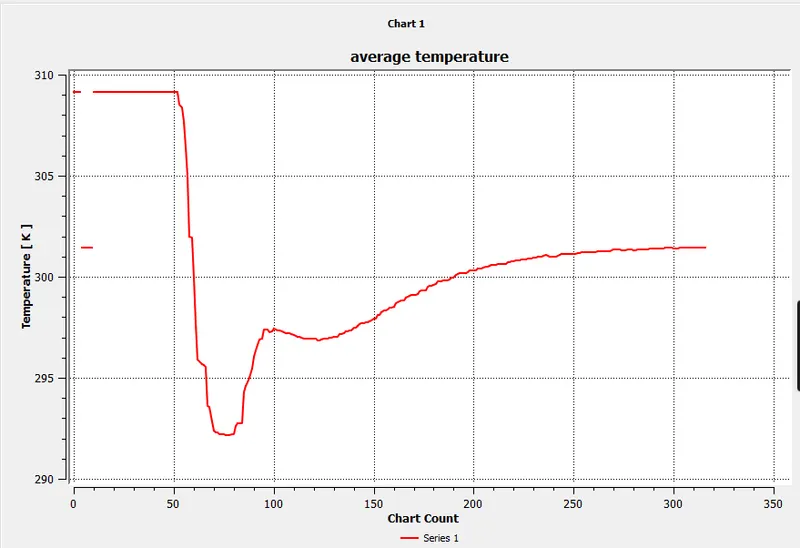
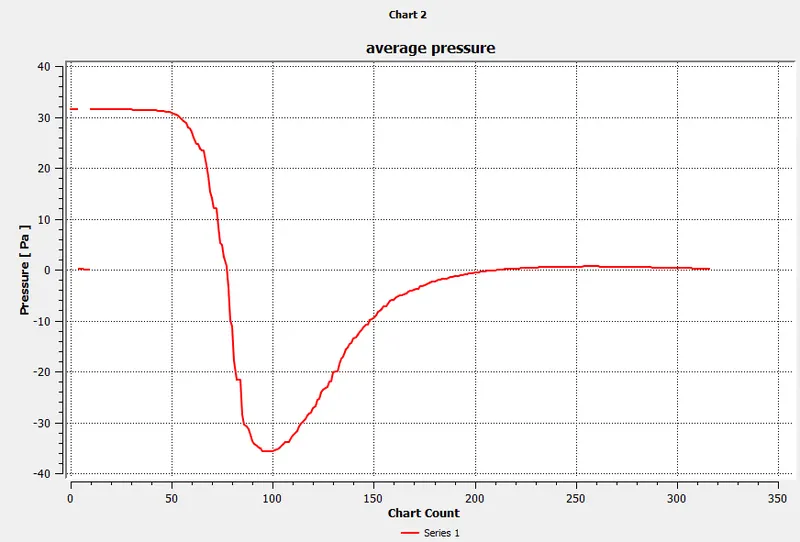
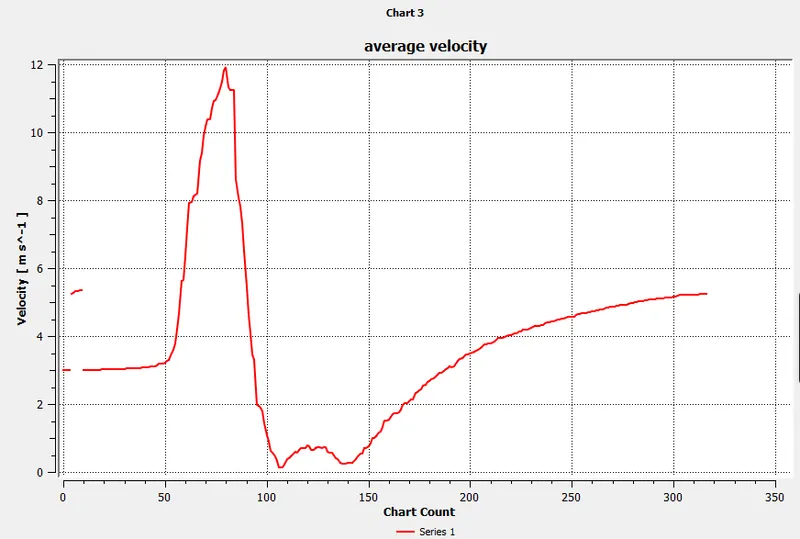
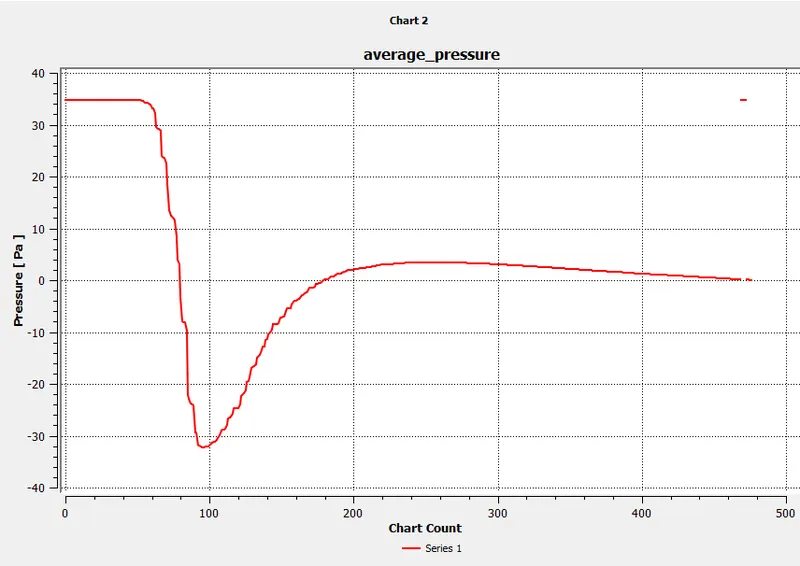
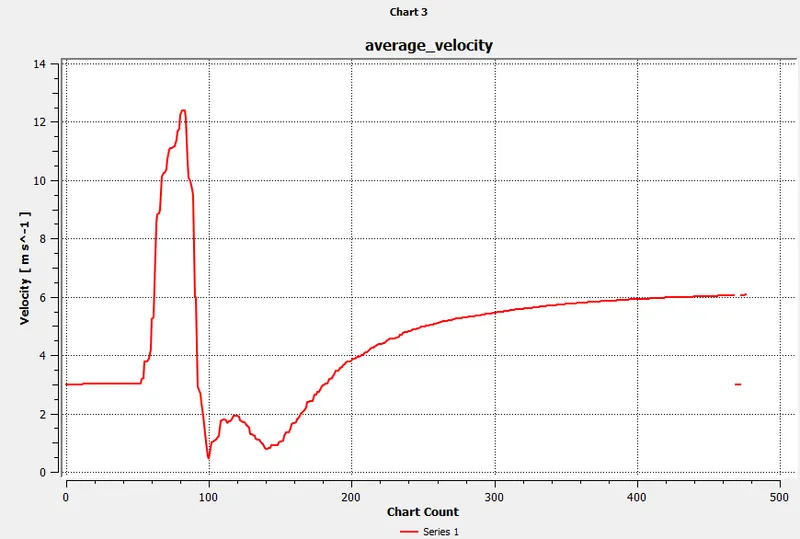
g)Average temperature, pressure and velocity value in the length of pipeline in the direction of x-axis
A.Average temperature B.Average pressure C.Average velocity
2.momentum ratio for 4
a)Scaled residual plot
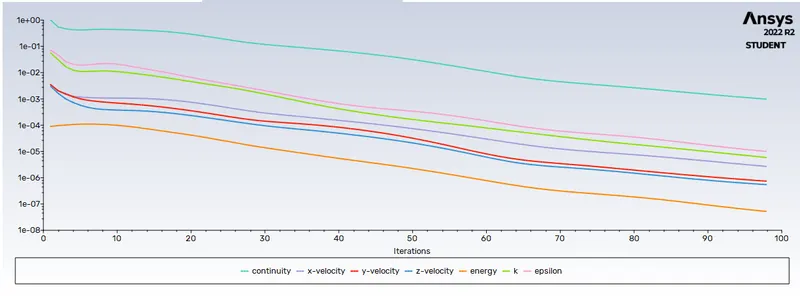
b)Average outlet temperature plot for 98 iteration
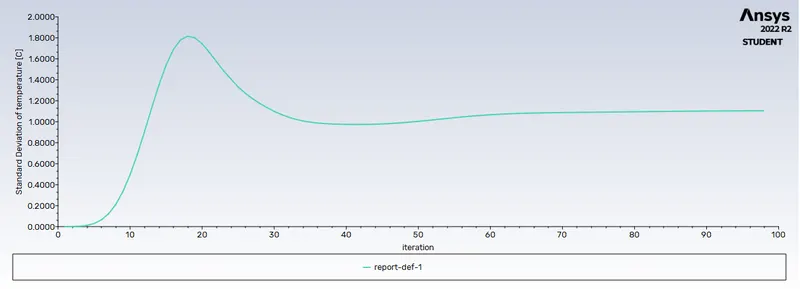
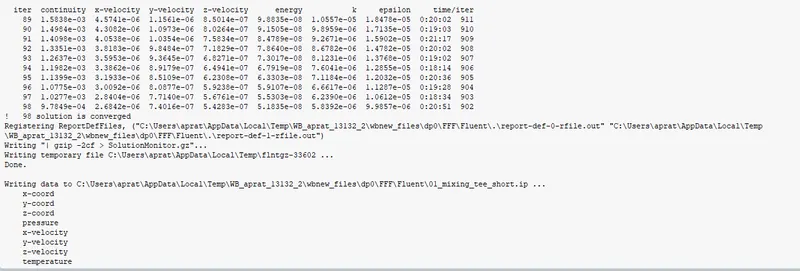
c)Result converged at 98 iteration result is
d)Contour plot for temperature e)Contour plot for the velocity
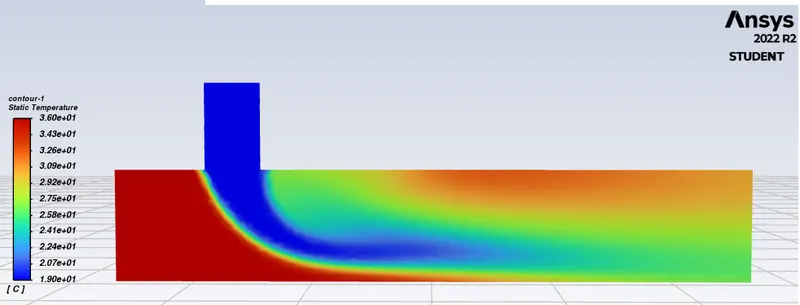
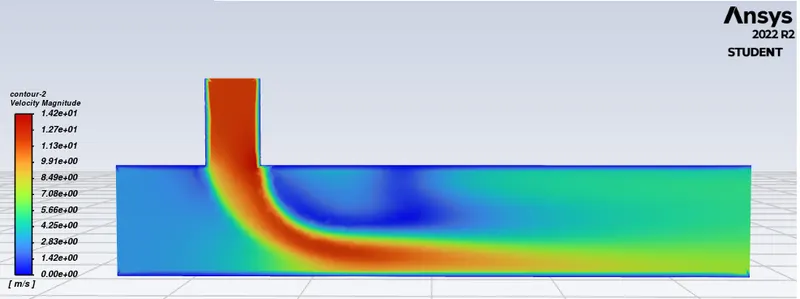
f)Result of minimum and maximum temperature
g)Average temperature, pressure and velocity value in the length of pipeline in the direction of x-axis
A.Average temperature B.Average pressure C.Average velocity
- Graph result for long t-junction pipeline
1.Momentum ratio for 2
a)Scaled residual plot
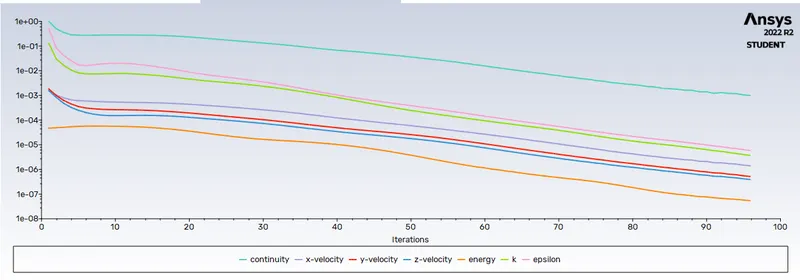
b)Average outlet temperature plot for 96 iteration
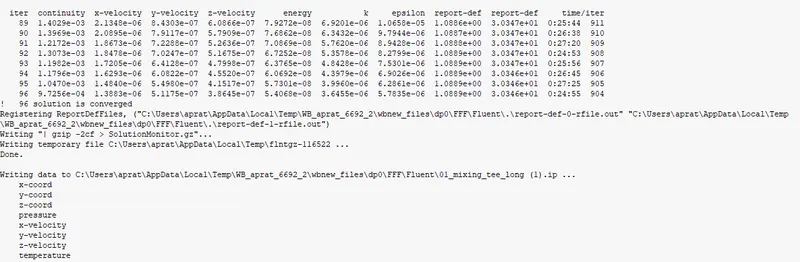
c)Result converged at 96 iteration result is
d)Contour plot for temperature e)Contour plot for the velocity
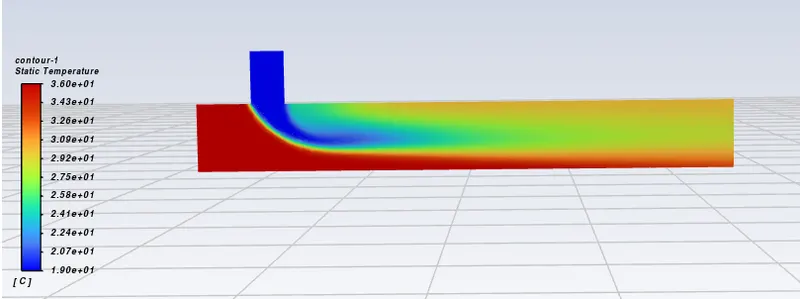
f)Result of minimum and maximum temperature
g)Average temperature, pressure and velocity value in the length of pipeline in the direction of x-axis
A.Average temperature B.Average pressure C.Average velocity
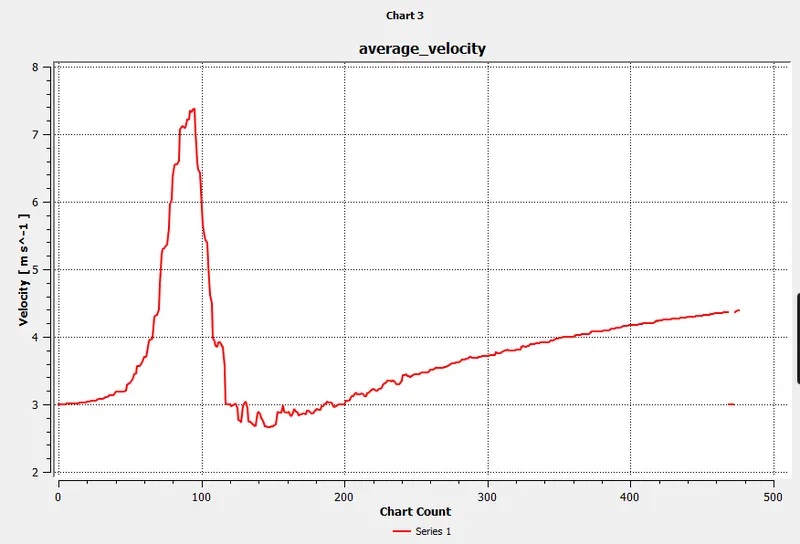
momentum ratio for 4
a)Scaled residual plot
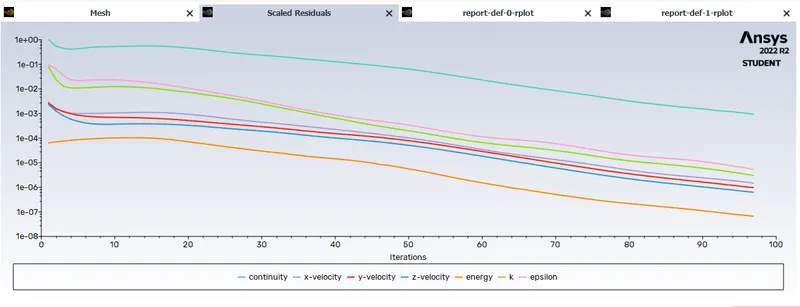
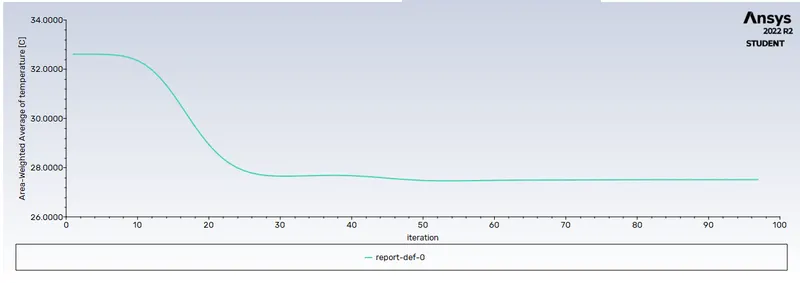
b)Average outlet temperature plot for 97 iteration
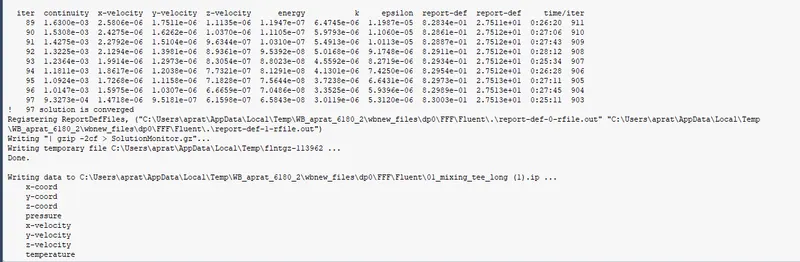
c)Result converged at 97 iteration result is
d)Contour plot for temperature e)Contour plot for the velocity
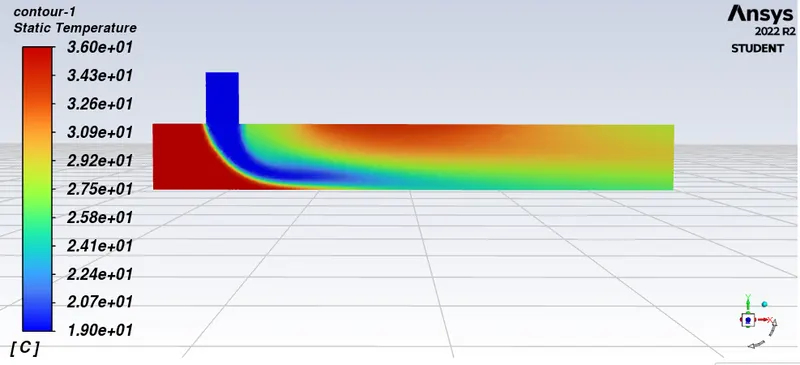
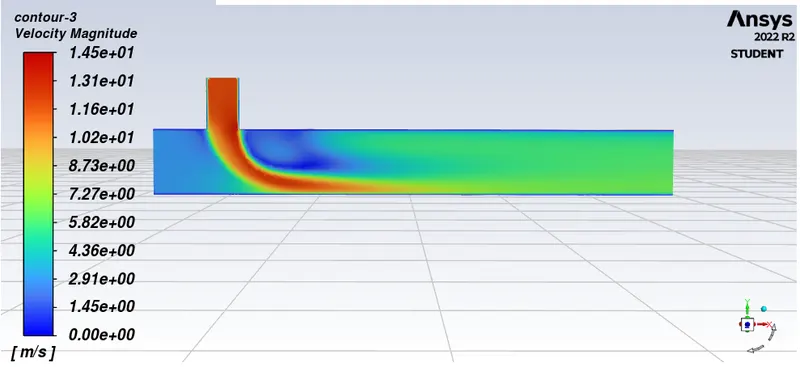
f)Result of minimum and maximum temperature
g)Average temperature, pressure and velocity value in the length of pipeline in the direction of x-axis
A.Average temperature B.Average pressure C.Average velocity
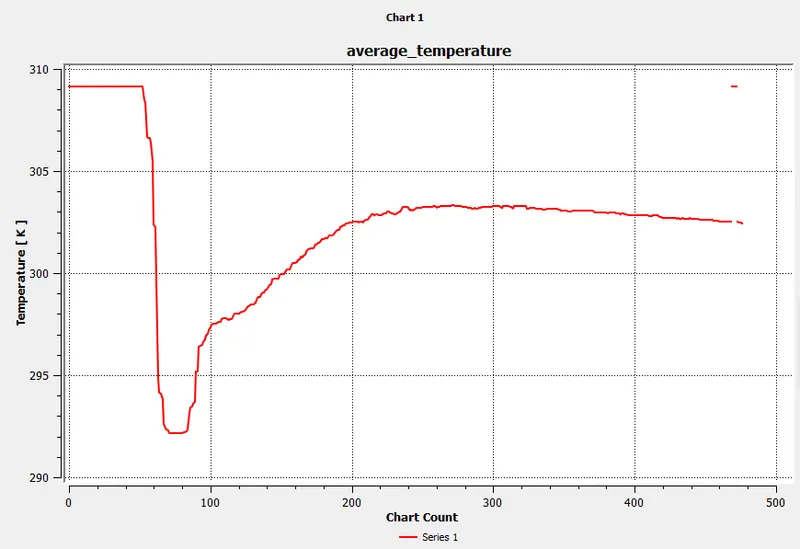
Conclusion: The finally by validating we conclude the mixing tee of long pipe gives more effectiveness of mixing than shorter pipe