Week 1- Mixing Tee
1.Objective:
- For this challenge, we have created two versions of the mixing tee. One of them is longer than the other.
- Our job is to set up steady-state simulations to compare the mixing effectiveness when hot inlet temperature is 360C & the Cold inlet is at 190C.
- Use the k-epsilon and k-omega SST model for the first case and based on your judgment use the more suitable model for further cases. Giving the reason for choosing a suitable model is compulsory.
- Case 1
- Short mixing tee with a hot inlet velocity of 3m/s.
- Momentum ratio of 2, 4.
- Case 2
- Long mixing tee with a hot inlet velocity of 3m/s.
- Momentum ratio of 2, 4.
2.Introduction:
Computaional fluid dynamics is a branch of fluid mechanics, which uses mathematics, physics and`degree celcises` computational software to visualize how fluid flows and affect its medium and its neighbours.In CFD mostly computers are used to predict the fluid flow phenomena based on some governing equations like momentum equation, Navier stokes equation, Conservation of energy etc. In this study we are going to simulating effect of fluid using Ansys Fluent software. Ansys fluent is a very important domain in CAE domain, which is allows you to perform all the major steps of any simulation. pre-processing, solving, post-processing. Ansys fluent facilities for modeling flow, turbulance, heat transfer and chemical reactions with Ansys we can accomplice more in less time and with less training.
The function of mixing Tee is to provide proper mixing of quantities to get the desired results at the outlet. By controlling the velocity of chilled air we can get the desired temperature in the room.
2.1 Momentum Ratio:
- As momentum ratio increases, the velocity of cold inlet fluid increases and due to high relative velocity between the fluid it expreriences higher turbulence and therefore the outlet fluid temperature decreases.
- In order to obtain better mixing the velocity of cold air is important. By increasing the velocity the outlet temperature gets reduced.
Analytic solution
Momentum Ratio 2:
Mass of hot fluid(Mh)=rho*a*Vh=997*0.009*3=2.69 kg/s
Mass of cold fluid(Mc)=rho*a*Vc=997*0.0022*6=1.35 kg/s
Temperature of mixture(Tmix)= (Mh*Th+Mc*Tc)/(Mc+Mh)=((2.69*36)+(1.35*19))/(2.69+1.35) =30.31 degree C = 303.1k
Momentum Ratio 4:
Mass of hot fluid(Mh)=rho*a*Vh=997*0.009*3=2.69 kg/s
Mass of cold fluid(Mc)=rho*a*Vc=997*0.0022*12=2.39 kg/s
Temperature of mixture(Tmix)= (Mh*Th+Mc*Tc)/(Mc+Mh)=((2.69*36)+(2.39*19))/(2.69+2.39) =27.99 degree C = 300.99k
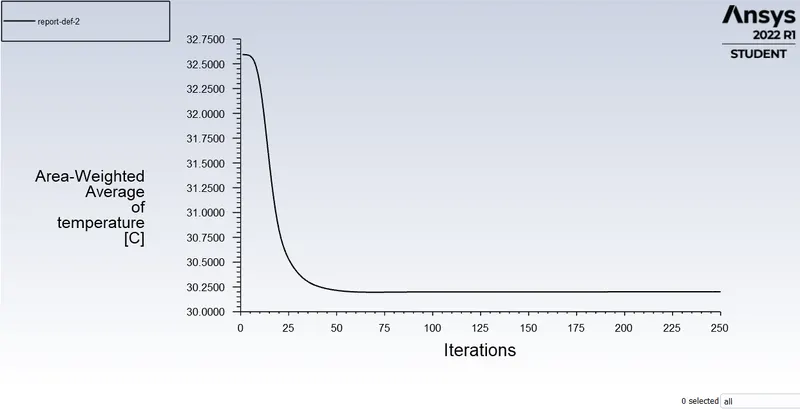
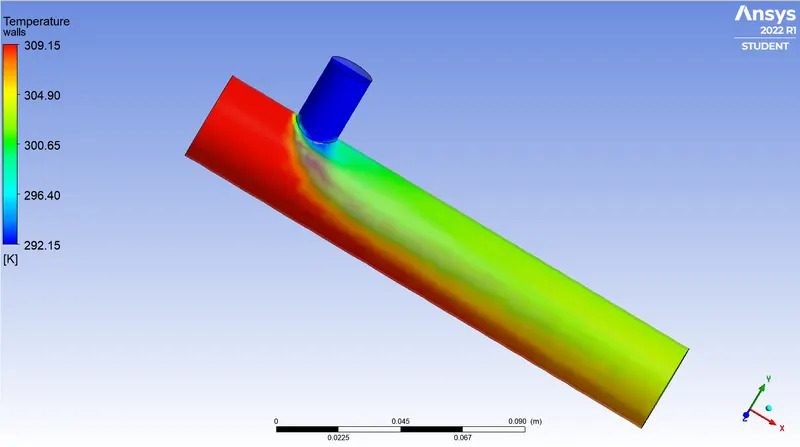
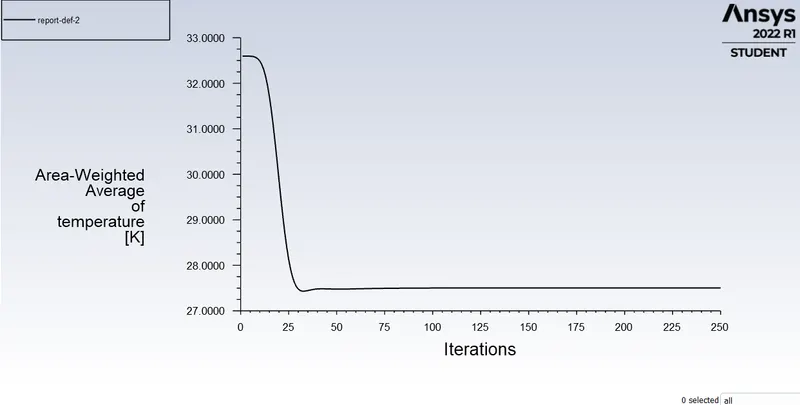
- For momentum ratio 2, the average outlet fluid temperature is 303k whereas for momentum ratio 4 the average outlet fluid temperature is 300k. Form these we can say that there will be a drop in temperature if momentum ratio increases.
2.2 Steps involves in Ansys Fluent software
- Geometry: Construct a two or three dimensional representation of the object to be modelled and tested using the work plane co-ordinate system within Ansys.
- Mesh: At this point understands the makeup of the part. Now define how the modelled system should be broken down into finite pieces.
- Setup: This case setup will be done using Ansys Fluent.
- Solution: Ansys Fluent where run time result visualization is done.
- Results: Post processing of results will be done using CFD post.
3.Procedure:
There are Three major steps,
1.Pre-processing
2.Sloving
3.Post-processing, Those steps are followed below
1.Open new project, by clicking on Fluid flow(Fluent) in Ansys workbench.
2.Now click on geometry to import mixing tee model. It will redirect to Spaceclaim, Ansys geometry model.
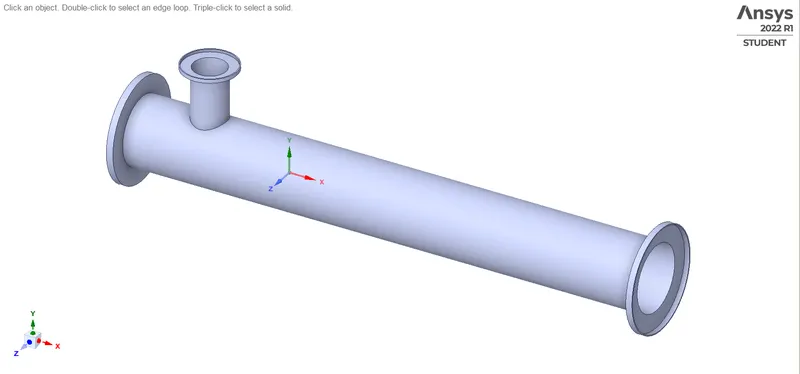
Fig: Imported Mixing Tee
3.We are to analyse the mixing of two fluid, SO there is role of part other than two pipes. To supress that we need to extract volume of Tee. Go to prepare menu and click on volume extract. Switch to edge selection and select three outer edges and click on green check button
. 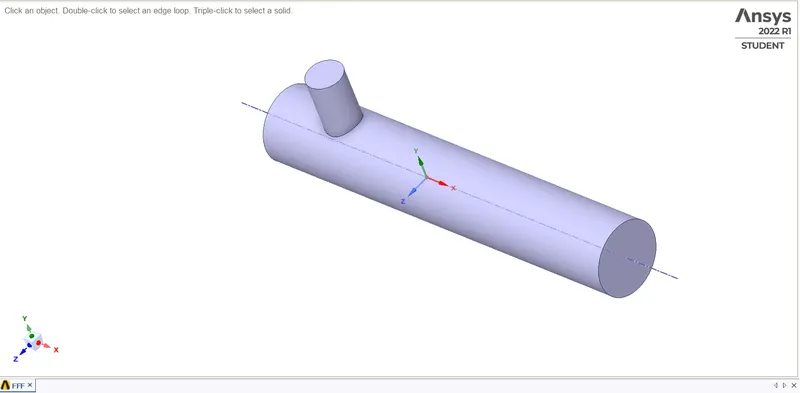
Fig: Extracted Solid Model
4.Hide solid by unchecking it from structure menu to see volume, which we have extracted. Supress solid by clicking on option supress for physics.
5.Exit from Spaceclaim and click on mesh to open mesh menu.
6.Select outer face and press right click of mouse, it will open a menu. Click on option create named selection and write suitable name for face. Repeat for other faces.
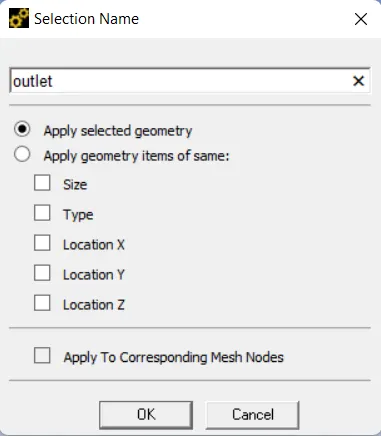
Fig: Selection Name Menu
7. Now click on mesh option and choose generate mesh. It will generate mesh according to some predefined criteria. Element size can be selected but it is going to affect simulation time. Selection plane can be created to see inner portion of geometry.
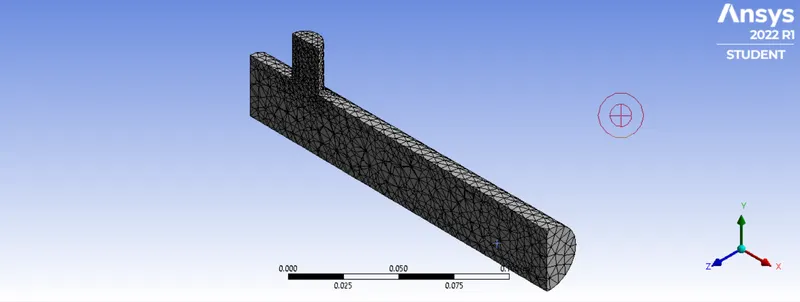
Fig: Generated Mesh
8.Select the option element quality to see, I Didn't change the quality of Mesh.
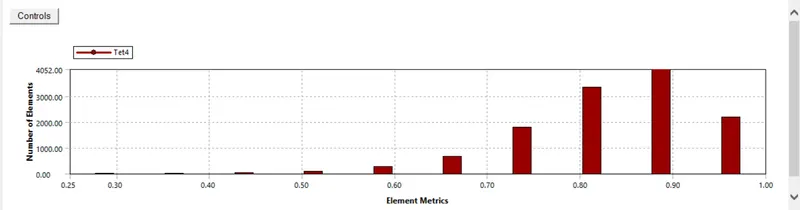
Fig: Number of Elements vs Element Metrics
9.Exit mesh and open setup. First, Check mesh, it is throwing no error then only we can proceed further. We are going to do pressure based steady state simulation, So choose these options on task page.
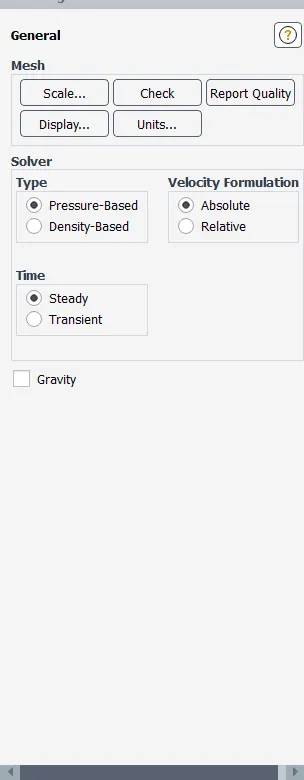
Fig: Task page
10. Go to physics menu and select viscous model. It will open a menu, choose realizable K-omega model and close it.
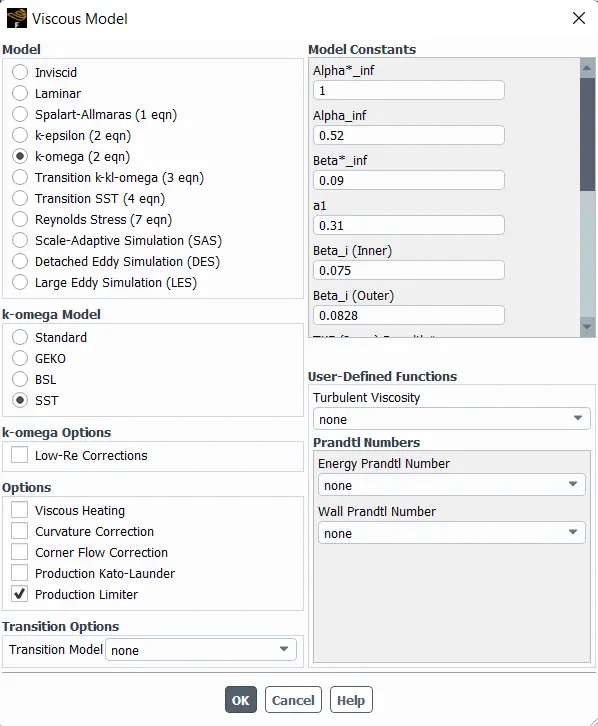
Fig: Viscous model parameters
11.Click on material and choose air as working fluid. check working fluid by clicking on cell zone conditions option, if it is air then proceed.
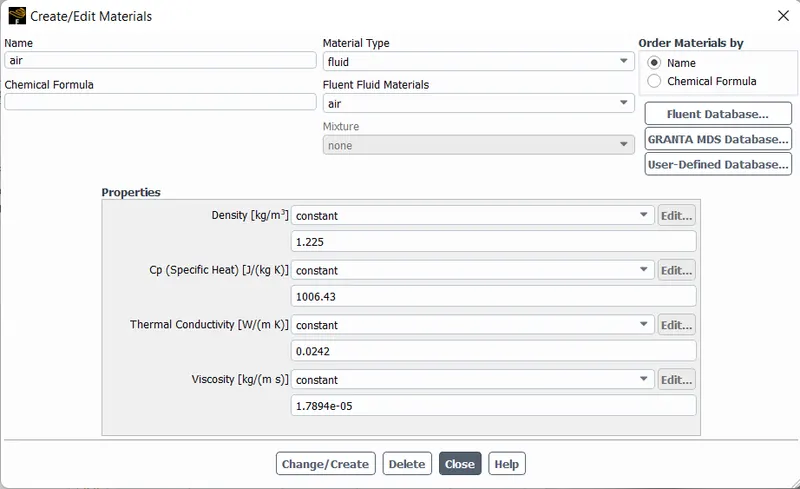
Fig: Assigning Mateials
12.Now go to boundaries option to set boundary conditions. Select inlet x and click on option edit. It will open a menu, Where it is thermal radiation, momentum etc. Put the value of velocity as 3m/s and go to thermal parameter to set temperature as 36C, for hot fluid.
13.Repeat the same procedure for cold fluid coming, velocity 6m/s and 12m/s, temperature-19C
14.We want to generate temperature report of outlet and we want standard derivation of temperature also. Go to solution tab and select definition and select area weighted average. In the opened menu select temperature as field variable. Similarly select standard derivation in definitions menu.
15.Now click on intialization to calculate approximate values of velocity and pressure.
16.Change the number of iteration 250 and click on calculate.
17.Exit setup and double click on result to open CFD post. Check boxes to see walls and other parts. Click on walls and go to render set transparency of 0.8 inside of wall. colour can also be changed to white for clear visibility.
18.Now insert a XY plane in wall by clicking on plane in location option of insert.
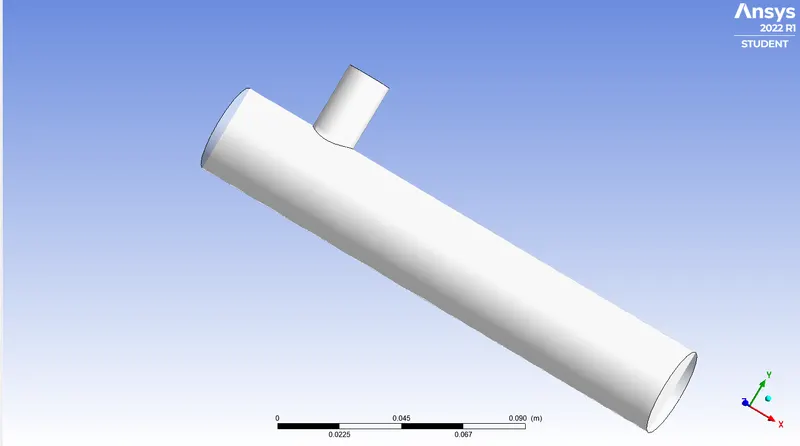
Fig: Transparent Mixing Tee with XY plane
19.Go to colour of plane and change it by variable choose option temperature. Similarly, velocity contours can be created by just changing variable as velocity.
20.Right click on plane which we created and select streamline. Go to appearance and select temperature to see plot line on plane.similar procedure can be repeated for velocity plot line.
4.Results:
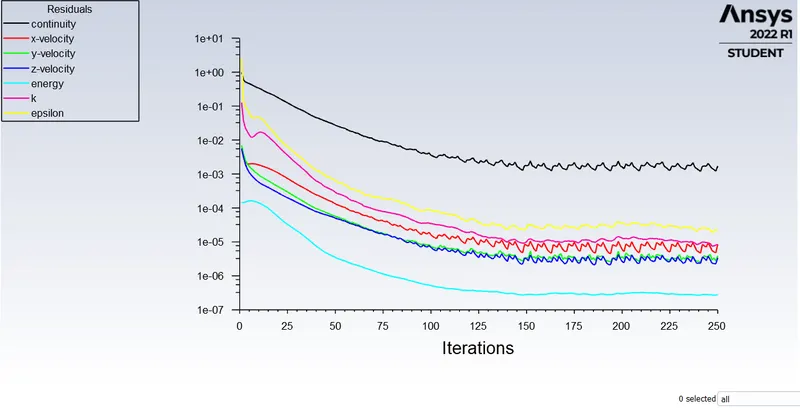
Case 1: In this short mixing tee is used, which was mixing two fluid with temperature 19C and 36C. Velocity of hot fluid was 3m/s and cold fluid was 6m/s, 12m/s. We used two different turbalent solvers for it first was realized k-epsilon and second was k-omega SST.
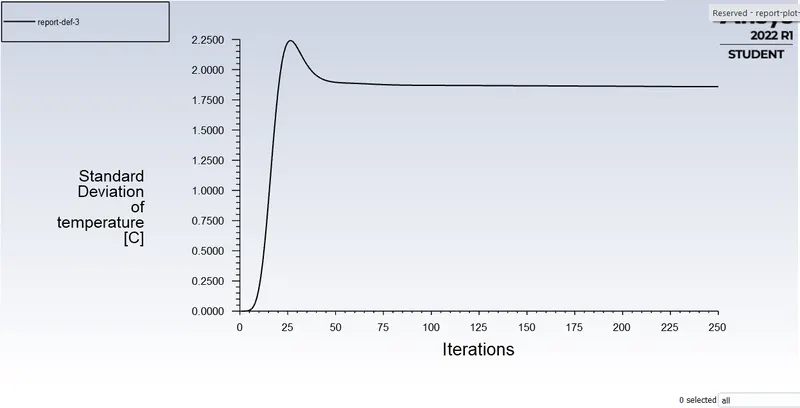
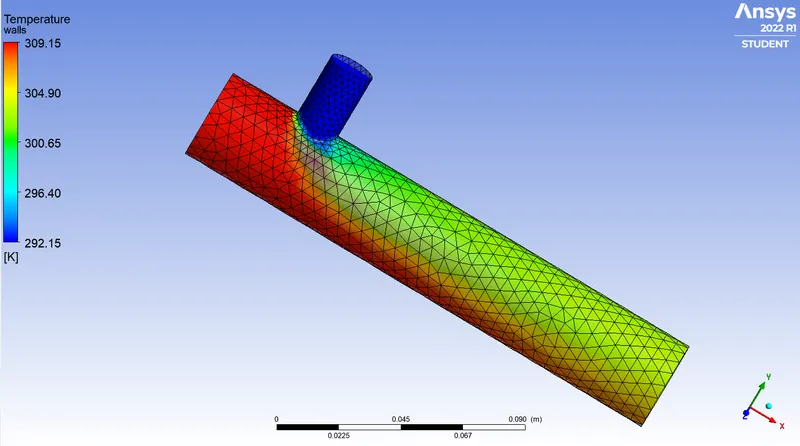
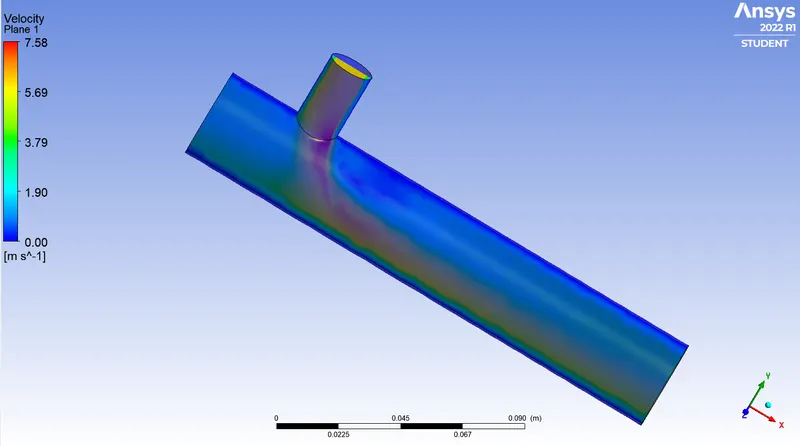
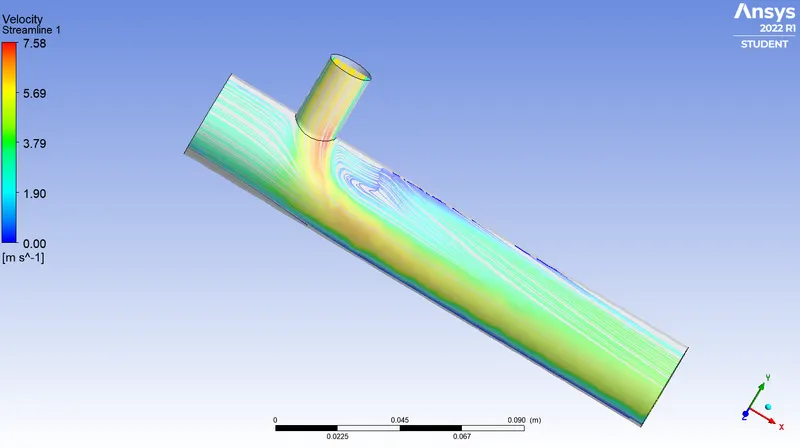
case 1.1 plot and contours from k-epsilan model (Momentum Ratio: 2)
Residuals
Average Temperature vs Iterations
Standard Deviation of Temperature vs Iteration
Temperature contour
Temperature contour with Mesh
Velocity contour
Velocity contour with streamline
case 1.2 plot and contours from k-epsilan model (Momentum Ratio: 4)
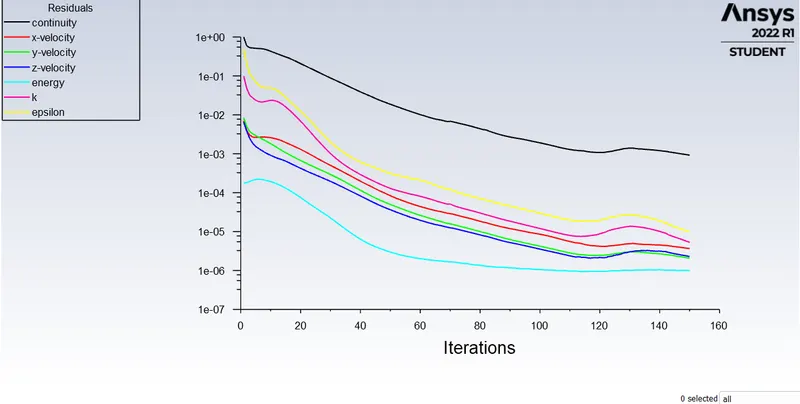
Residuals
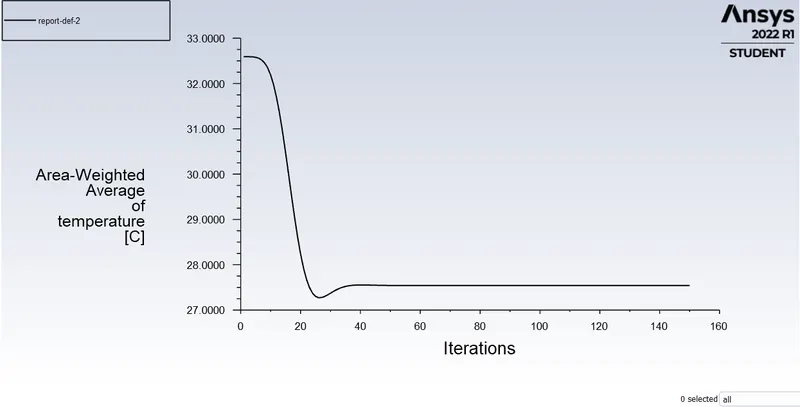
Average Temperature vs iterations
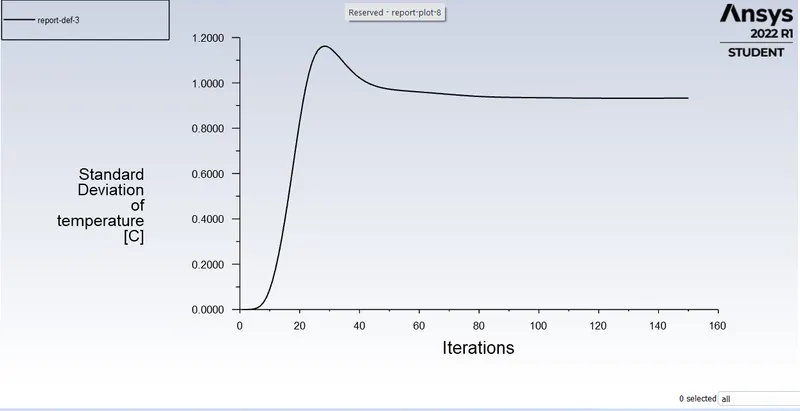
Standard Deviation of Temperature vs iterations
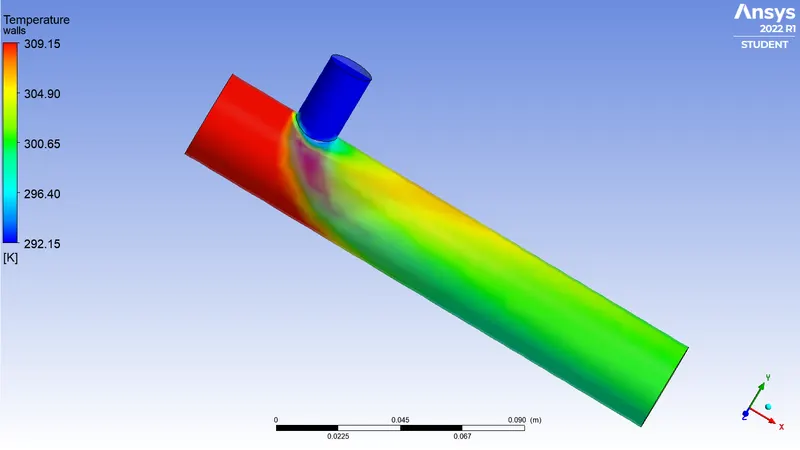
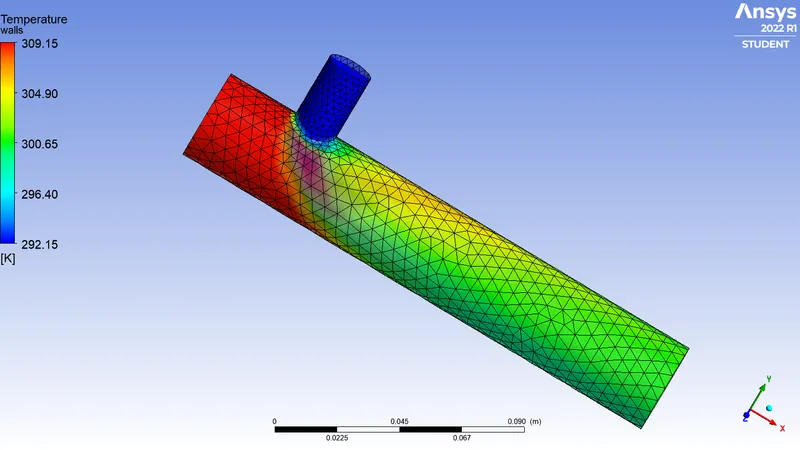
Temperature Contour
Temperature contour with Mesh
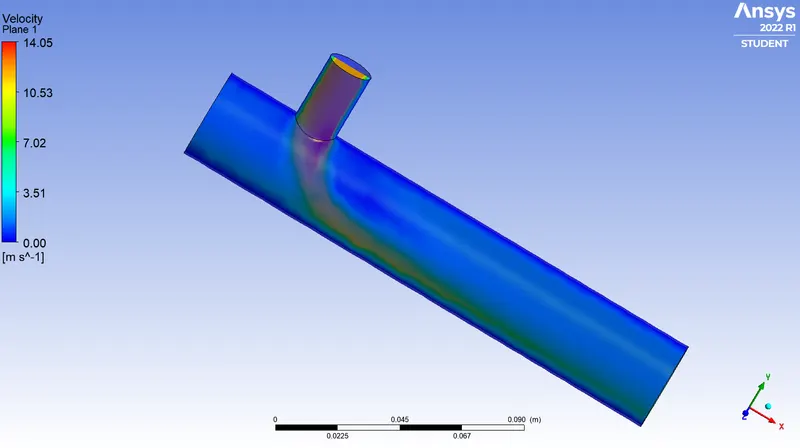
Velocity contour
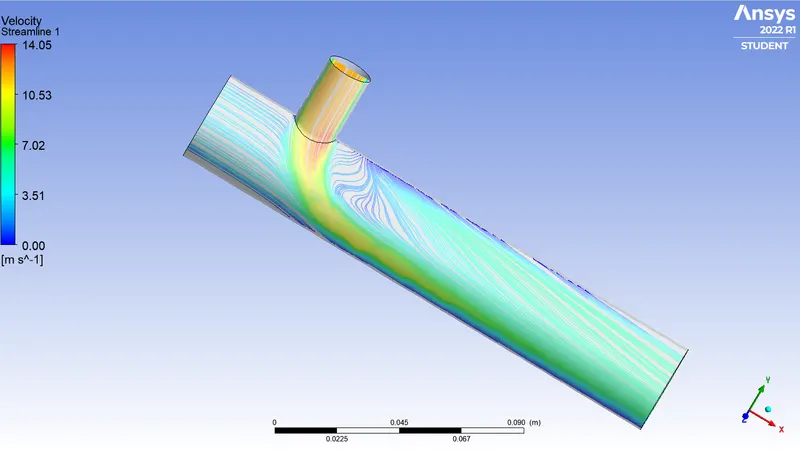
Velocity contour with stream line
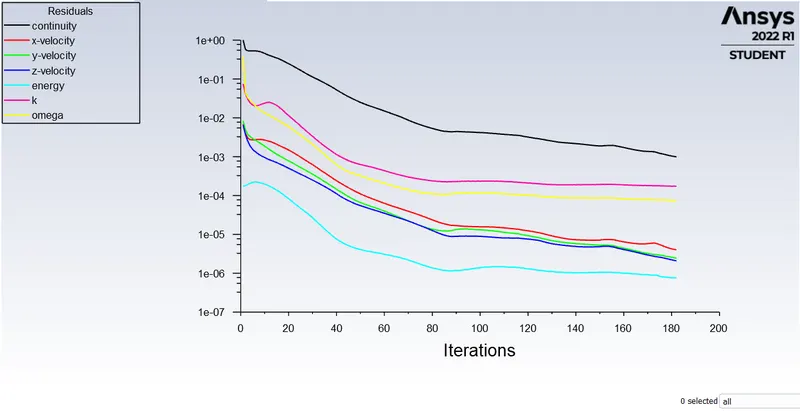
case 1.3 plot and contours from k-Omega model (Momentum Ratio: 4)
Residual
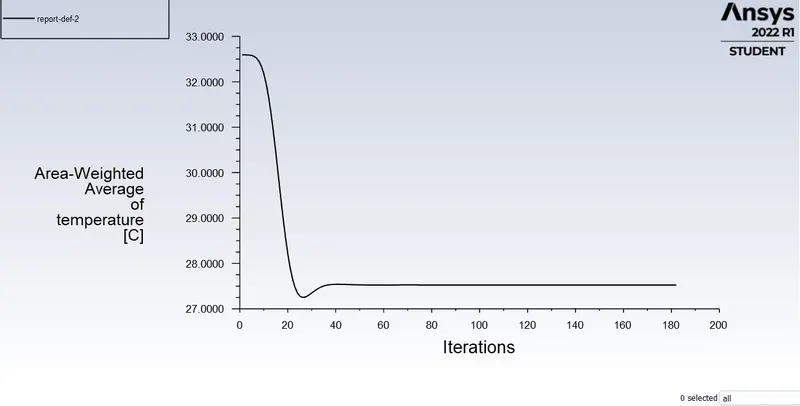
Average Temperature vs Iteration
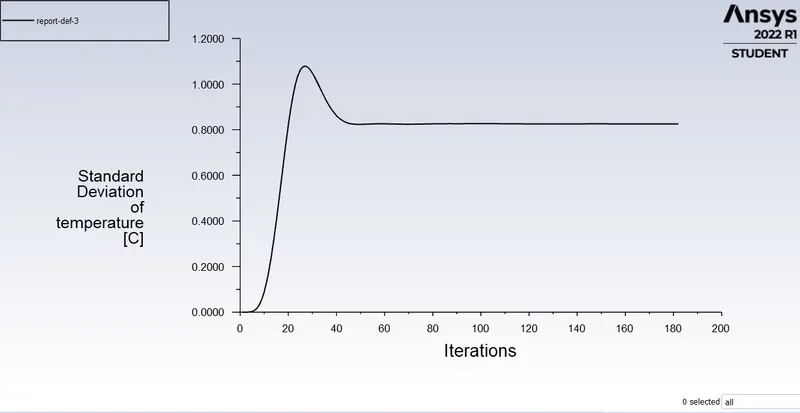
Standard Deviation vs Iteration
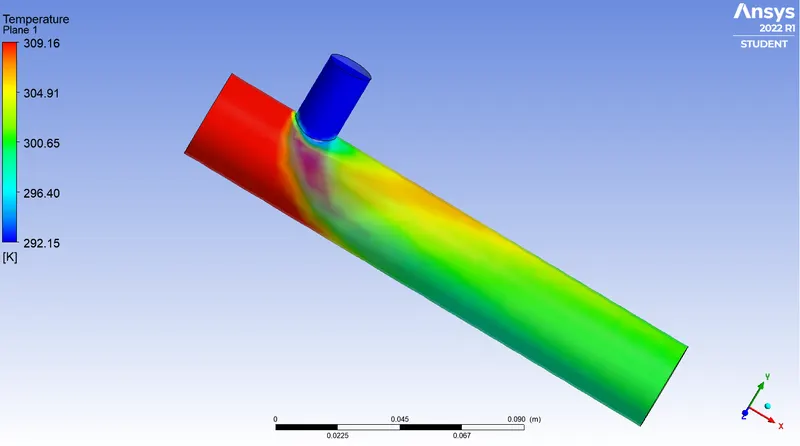
Temperature contour
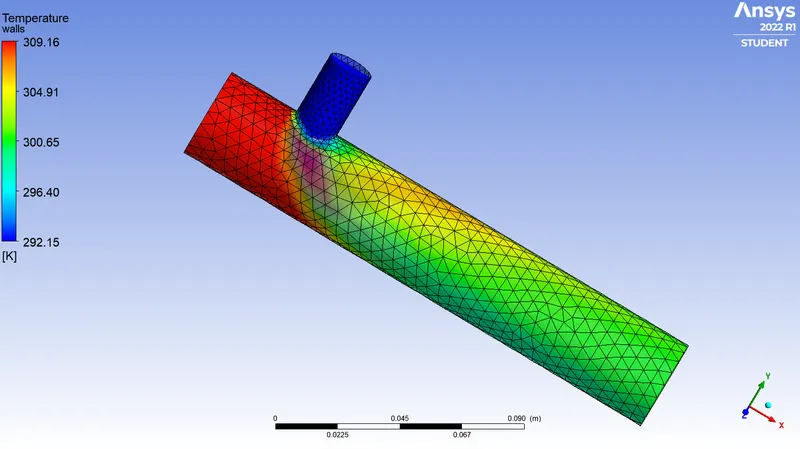
Temperature Contour with Mesh
Velocity contour
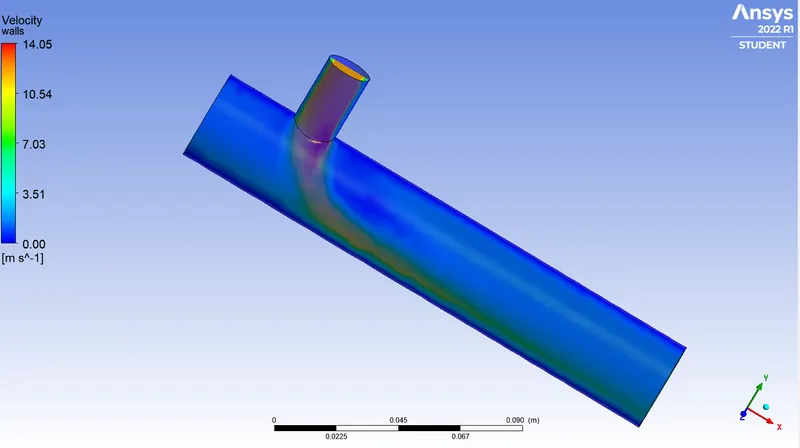
Velocity contour with stream line
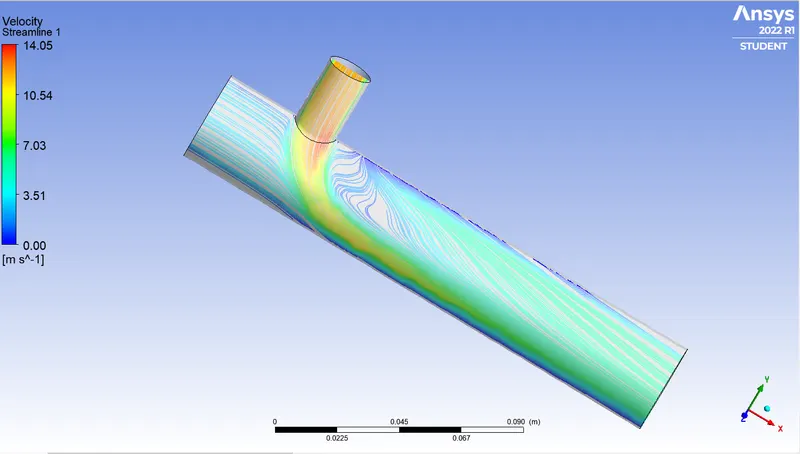
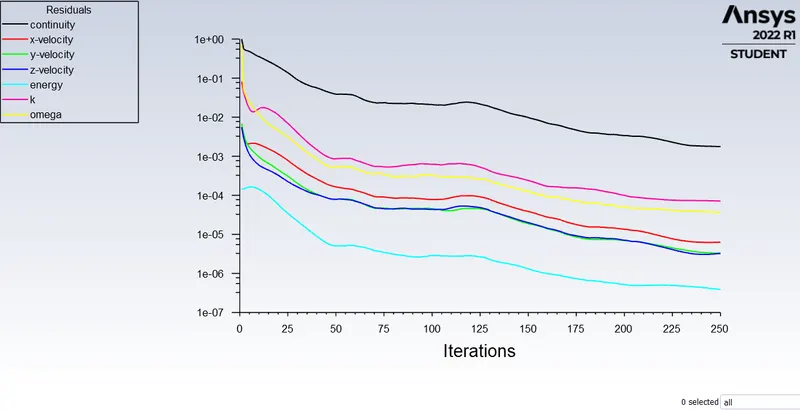
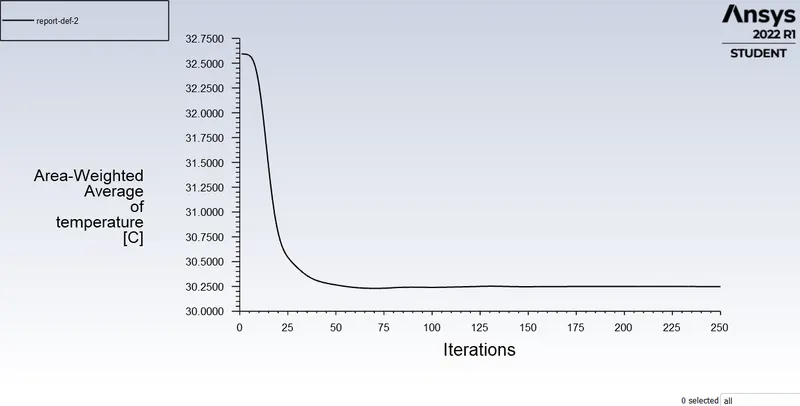
case 1.4 plot and contours from k-omega model (Momentum Ratio: 2)
Residual
Average Temperature vs Iteration
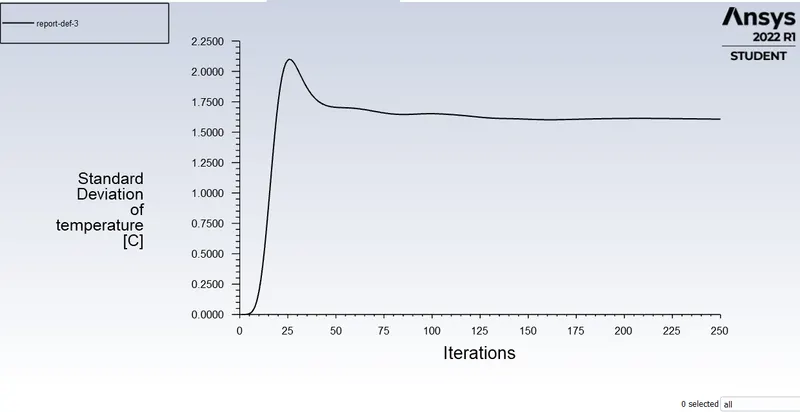
Standard Deviation vs Iteration
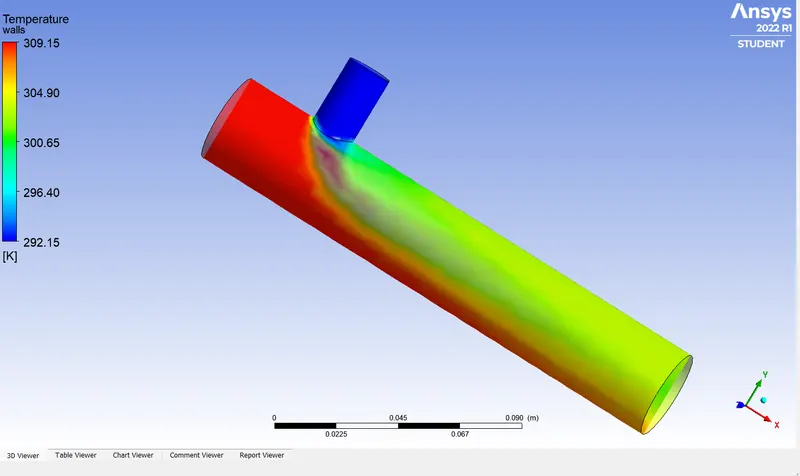
Temperature contour
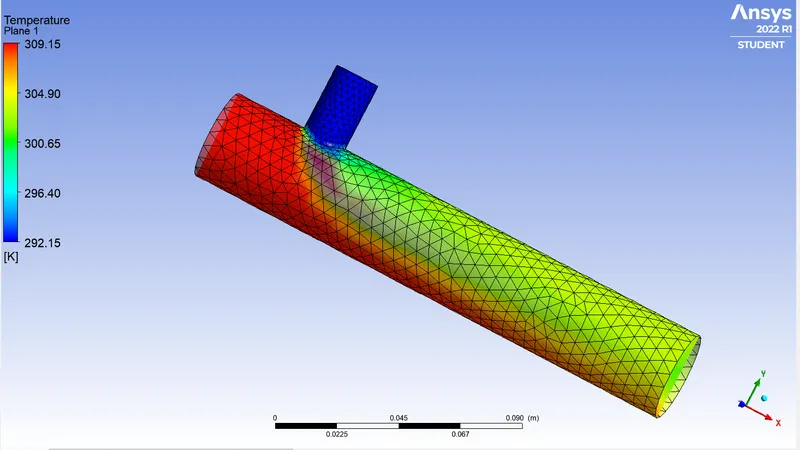
Temperature contour with Mesh
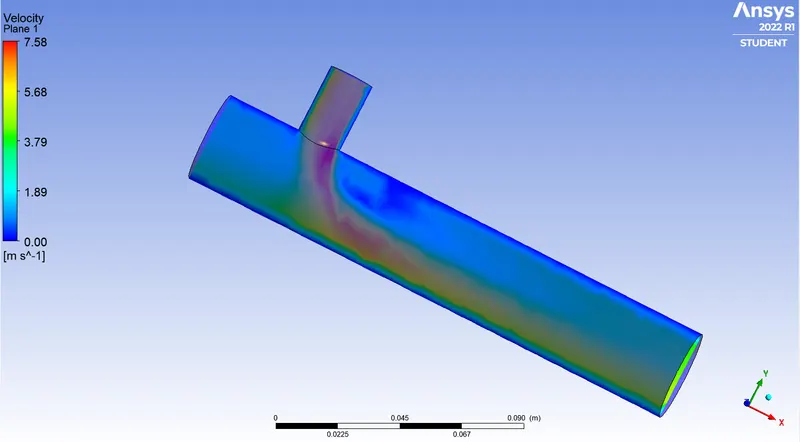
Velocity contour
Velocity contour with streamline
| (MR-2)K-epsilon | (MR-2)K-omega | (MR-4)K-epsilon | (MR-4)K-omega | |
| Avg. Outlet Temp | 30.3 | 30.3 | 27.5 | 27.5 |
| Standard Deviation | 1.63 | 1.65 | 0.92 | 0.92 |
| No. of iteration | 250 | 250 | 152 | 185 |
| No. of Cell zone | 15622 | 15622 | 15622 | 15622 |
Case 2: In this long mixing tee is used, which was mixing two fluid with temperature 19C and 36C. Velocity of hot fluid was 3m/s and cold fluid was 6m/s, 12m/s. We used two different turbalent solvers for it first was realized k-epsilon and second was k-omega SST.
case 2.1 plot and contours from k-epsilan model (Momentum Ratio: 2)
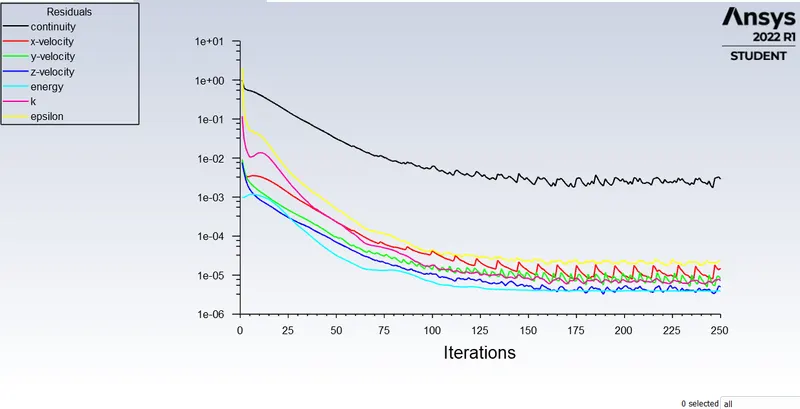
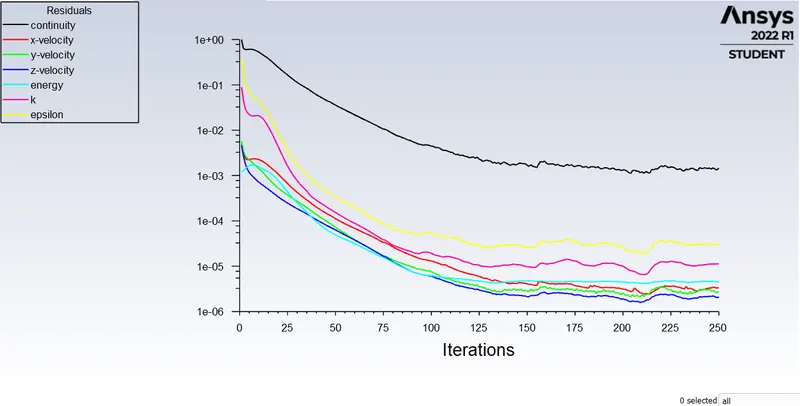
Residual
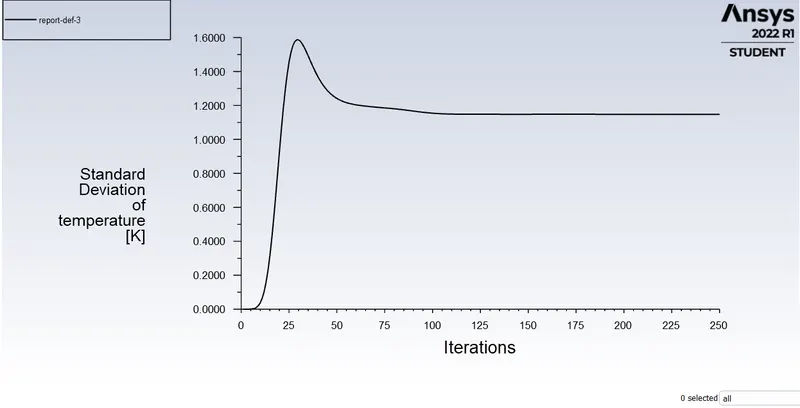
Standard Deviation vs Iteration
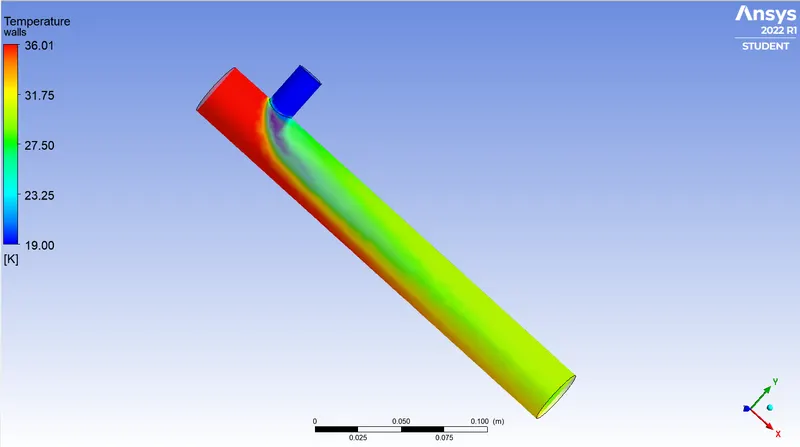
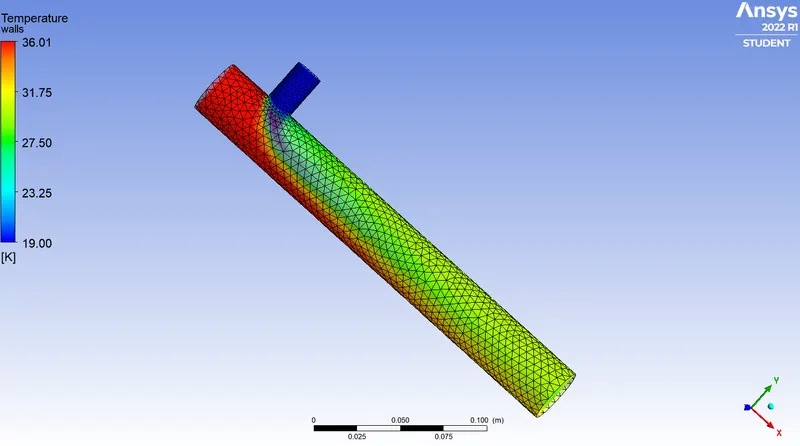
Temperature contour
Temperature contour with Mesh
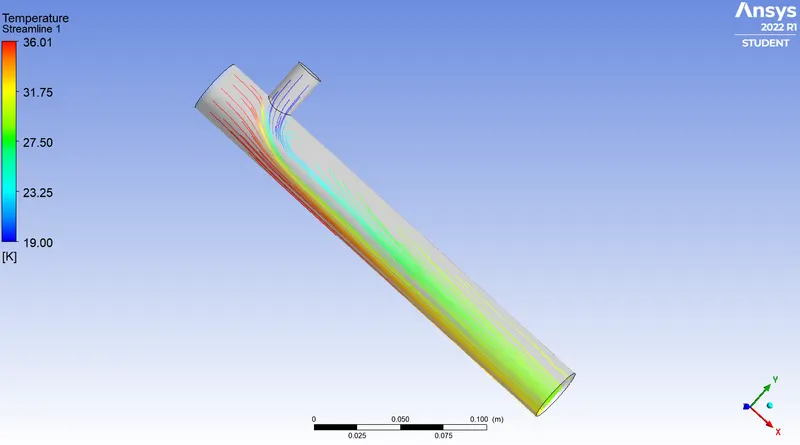
Temperature contour with stream line
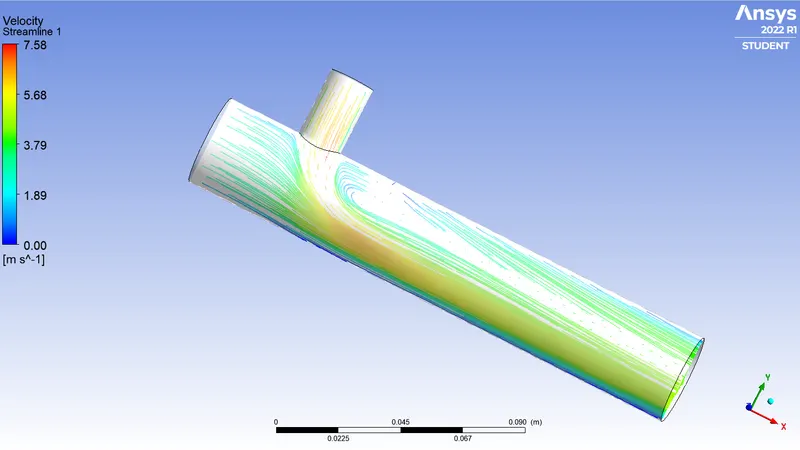
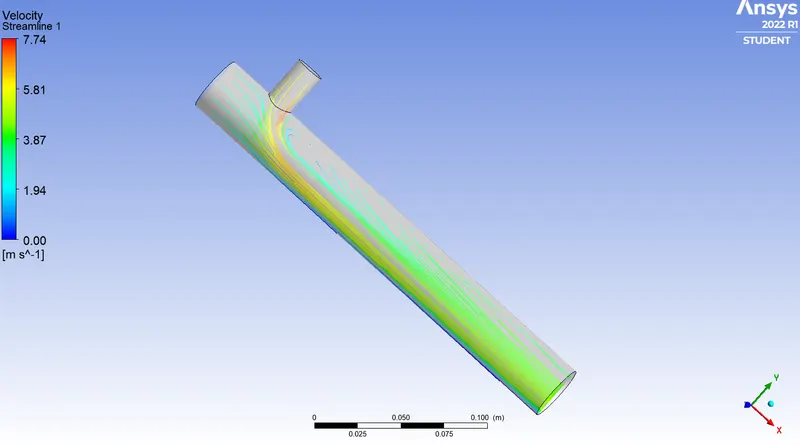
Velocity contour with stream line
case 2.2 plot and contours from k-epsilan model (Momentum Ratio: 4)
Residual
Standard Deviation vs Iteration
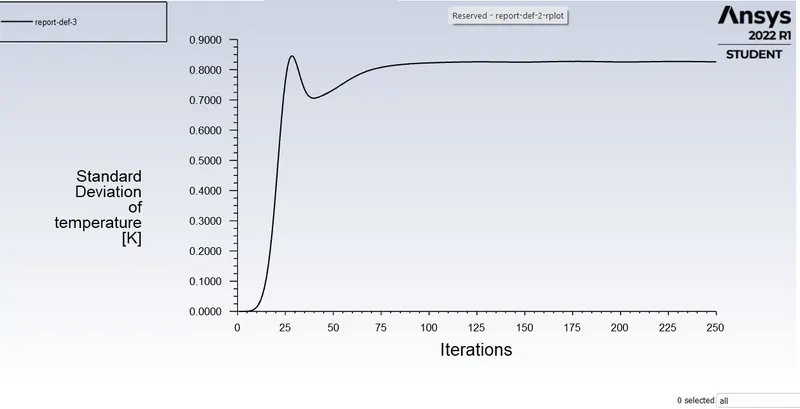
Average Temperature vs Iteration
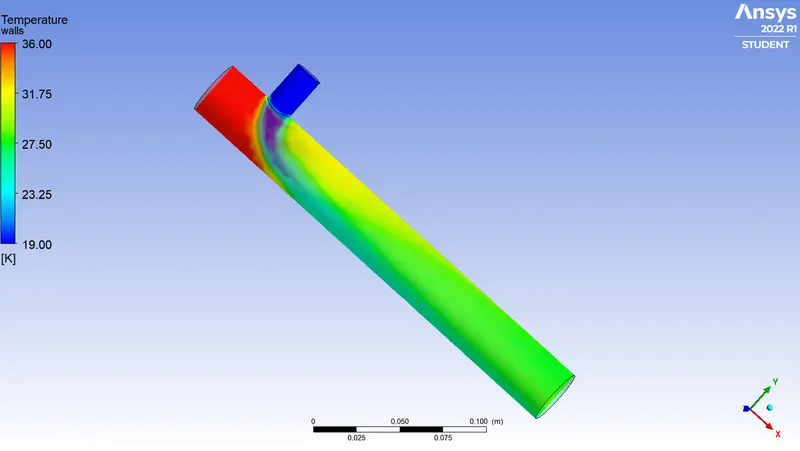
Temperature contour
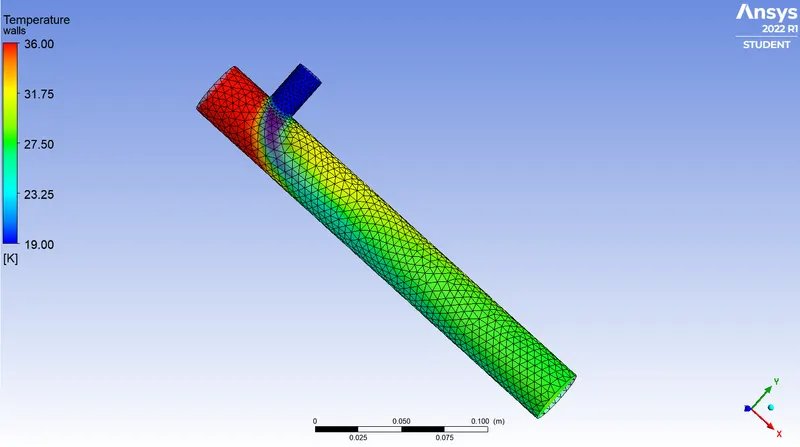
Temperature contour with Mesh
Velocity contour
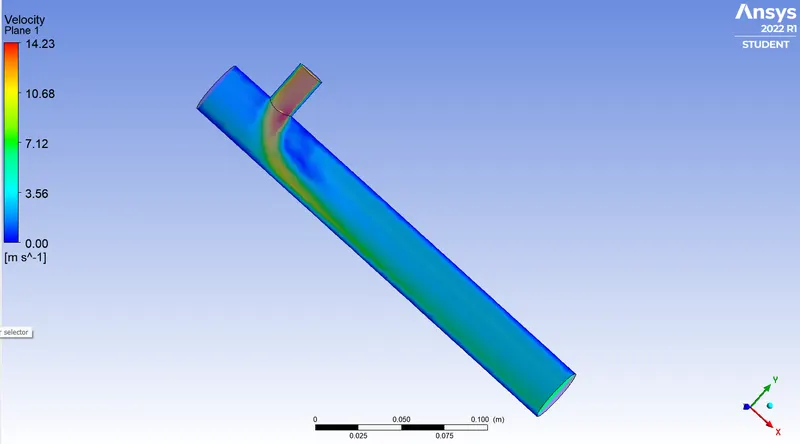
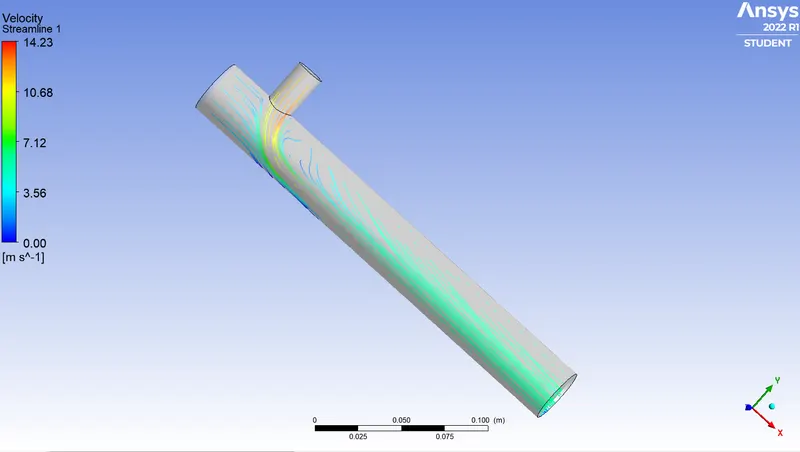
Velocity contour vs streamline
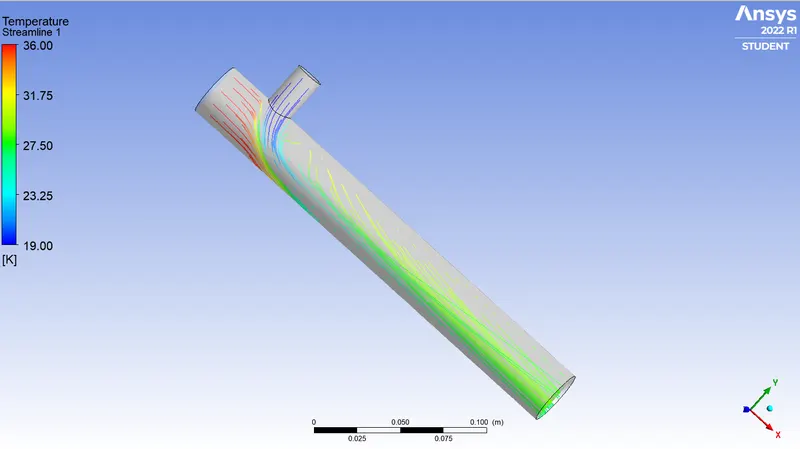
Temperature contour with streamline
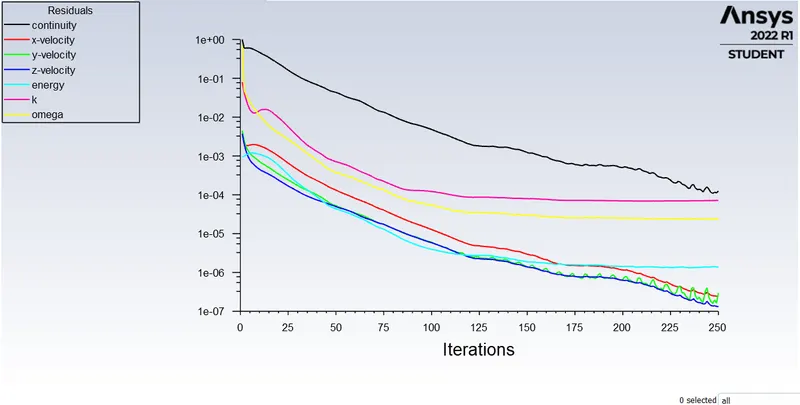
case 2.3 plot and contours from k-omega model (Momentum Ratio: 2)
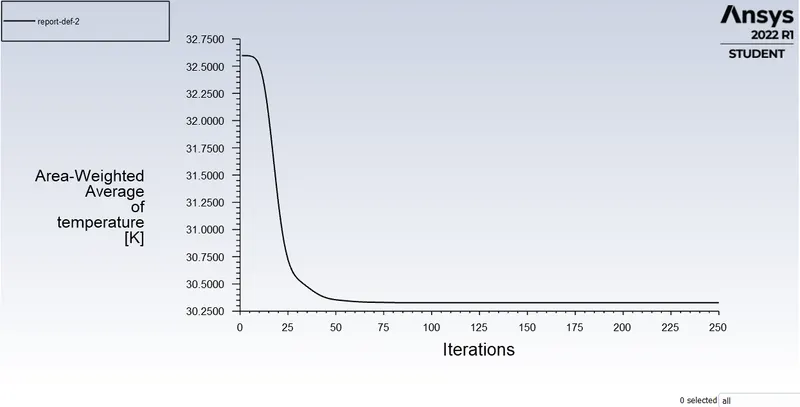
Residual
Average Temperature vs Iteration
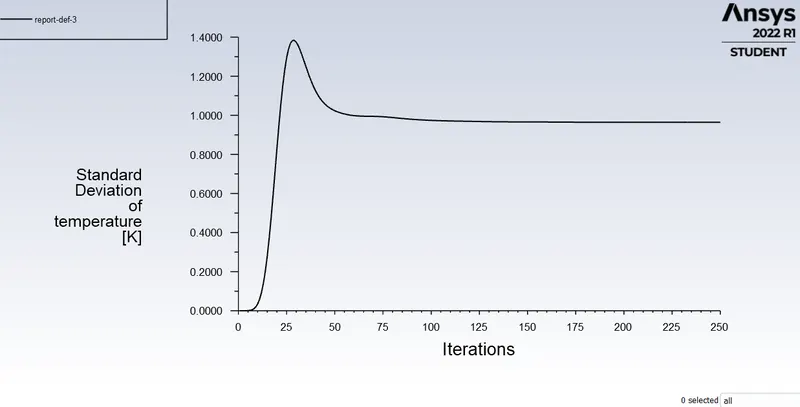
Standard Deviaton vs Iteration
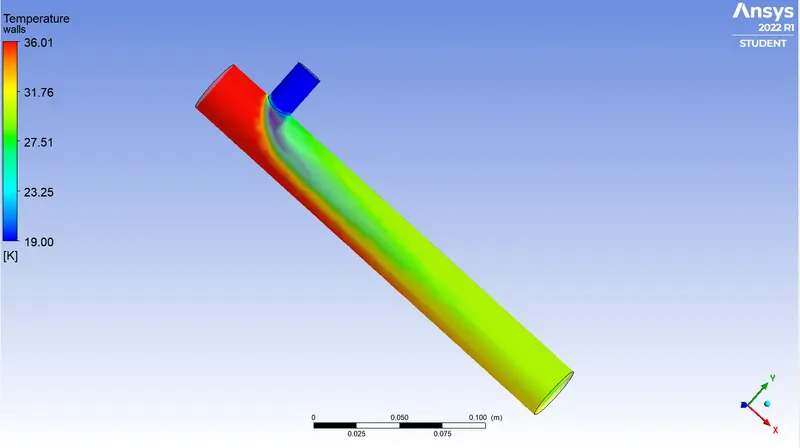
Temperature contour
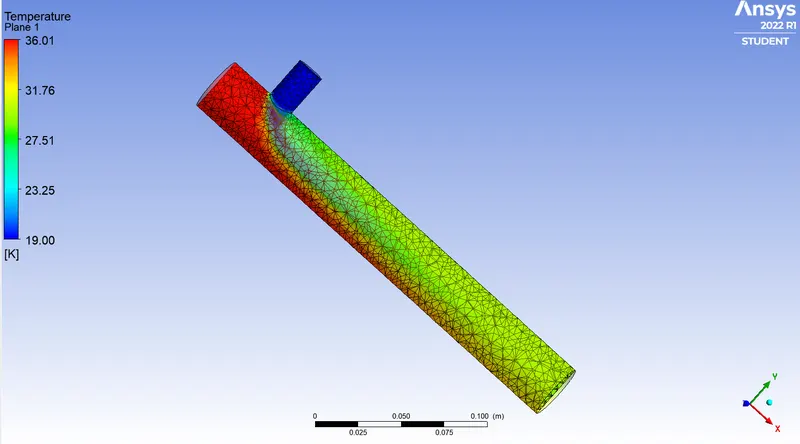
Temperature contour with Mesh
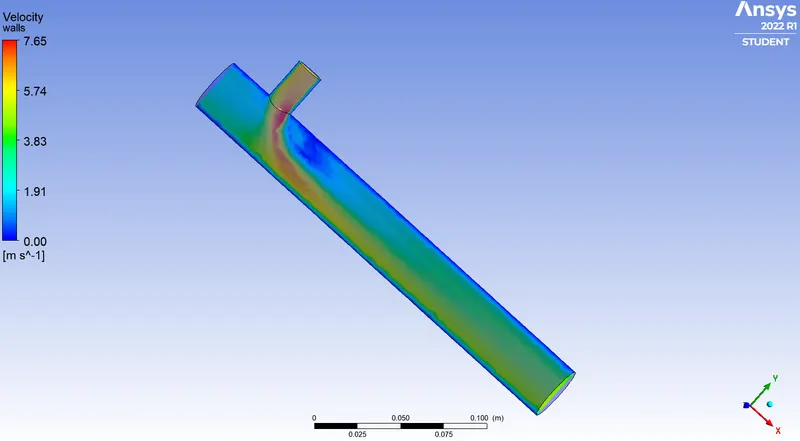
Velocity contour
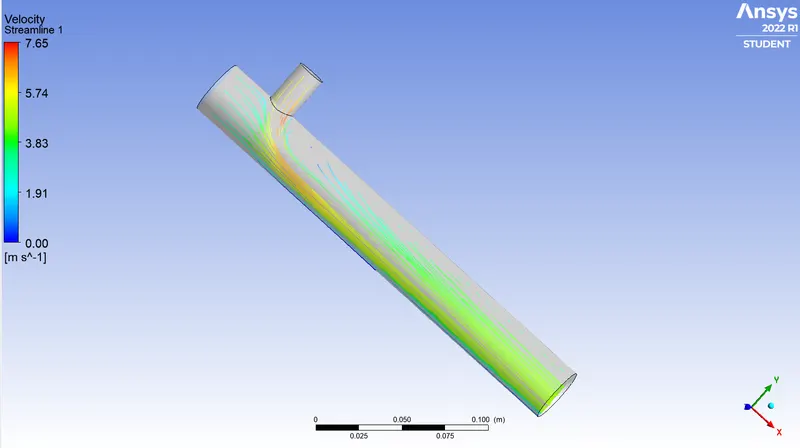
Velocity contour with streamline
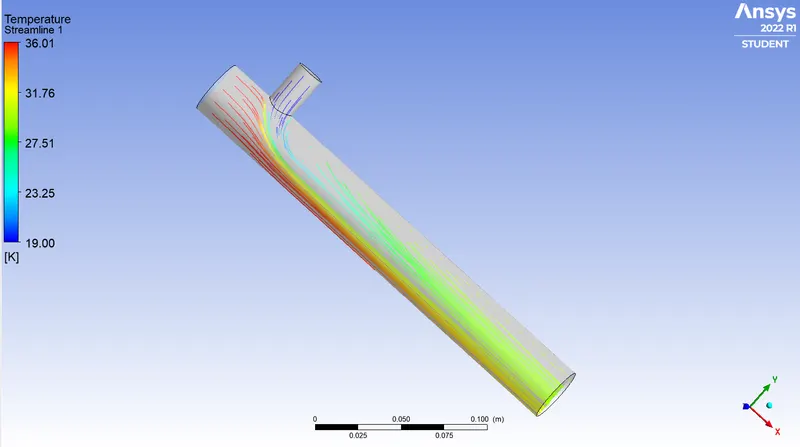
Temperature contour with streamline
case 2.4 plot and contours from k-omega model (Momentum Ratio: 4)
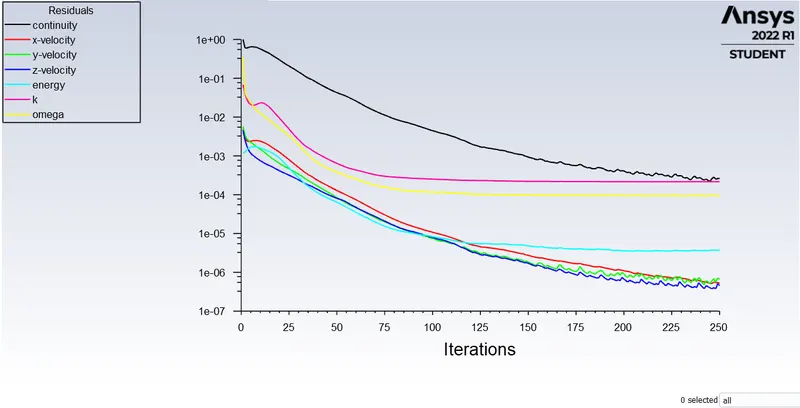
Residual
Average Temperature vs Iteration
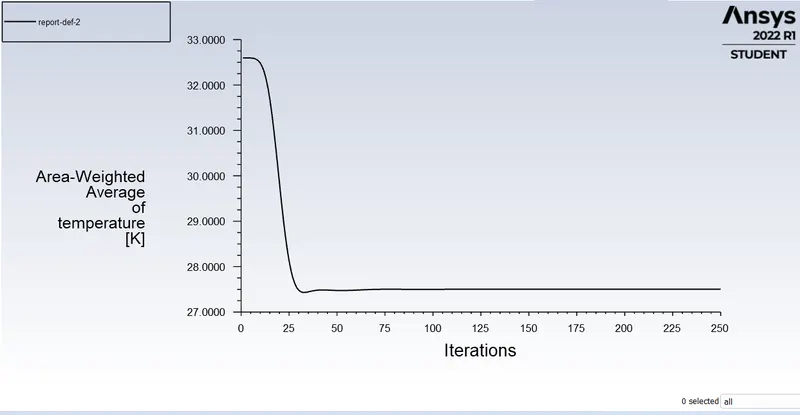
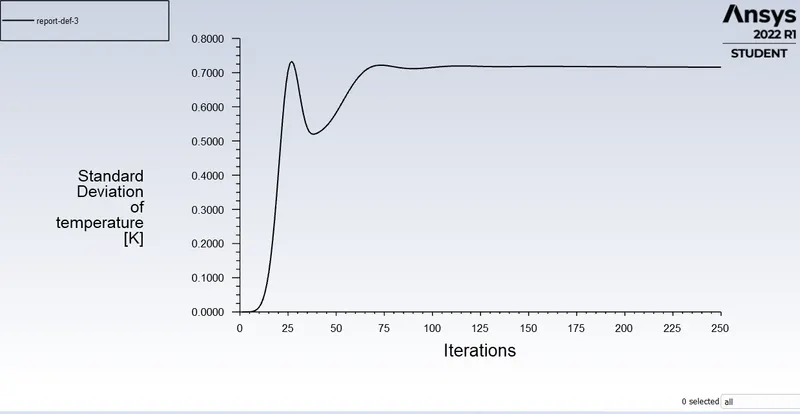
Standard Deviation vs Iteration
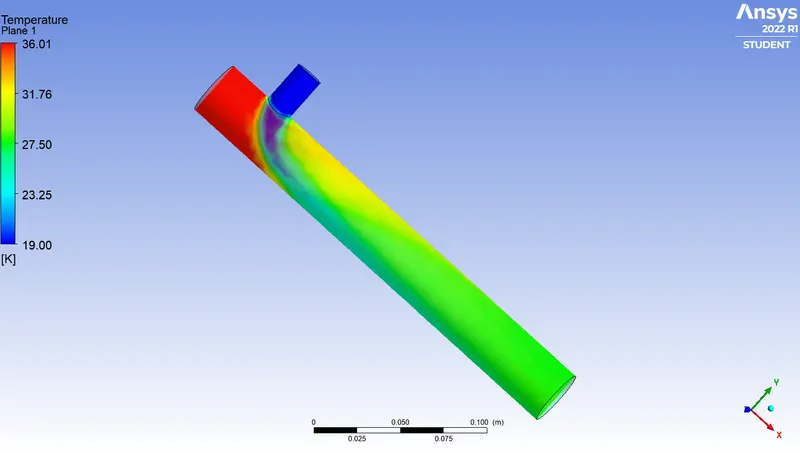
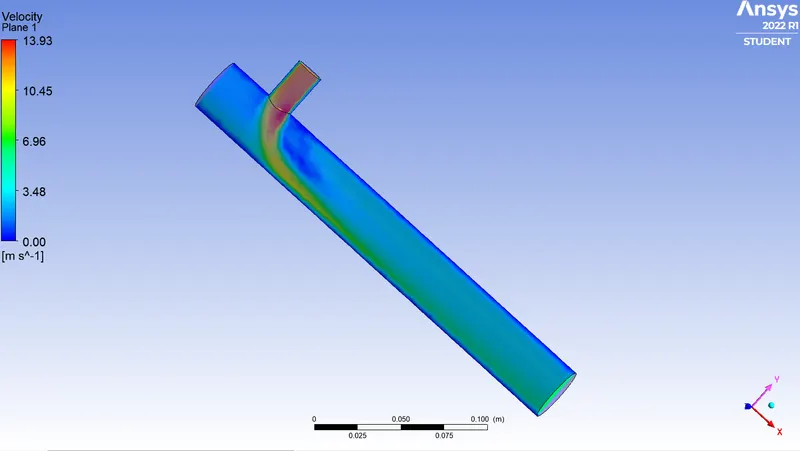
Temperature contour
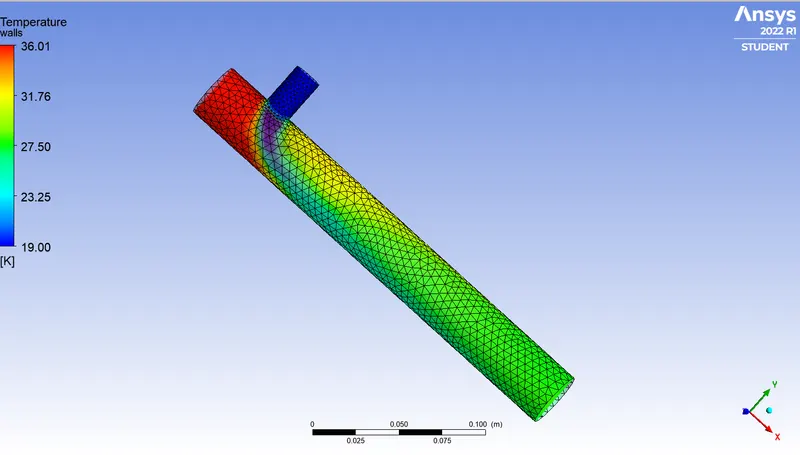
Temperature contour with Mesh
Velocity contour
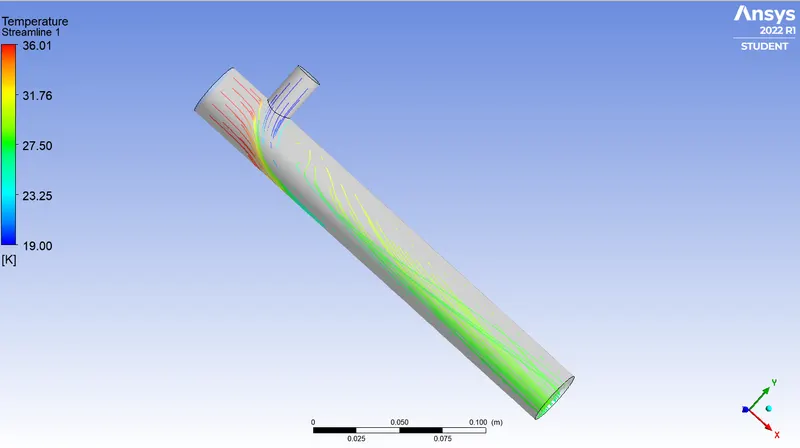
Temperature contour with streamline
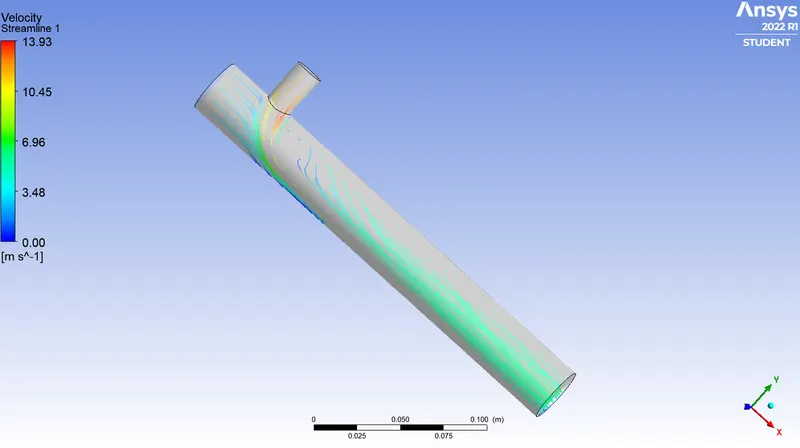
Velocity contour with streamline
| (MR-2)K-epsilon | (MR-2)K-omega | (MR-4)K-epsilon | (MR-4)K-omega | |
| Avg. Outlet Temp | 30.25 | 30.28 | 27.68 | 27.65 |
| Standard Deviation | 1.22 | 1.26 | 0.760 | 0.762 |
| No. of iteration | 250 | 250 | 250 | 250 |
| No.of cell | 17796 | 17796 | 17796 | 17796 |
5.Grid Dependancy Test:
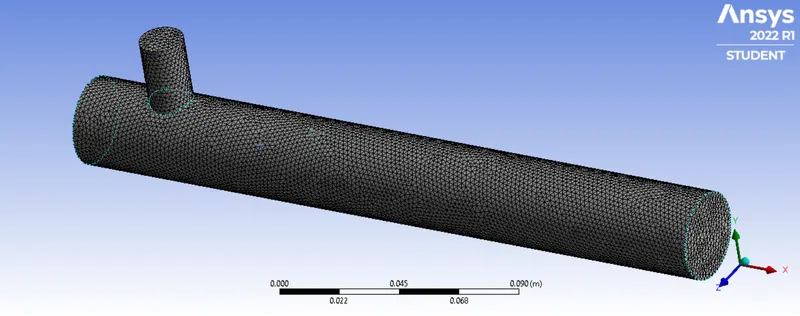
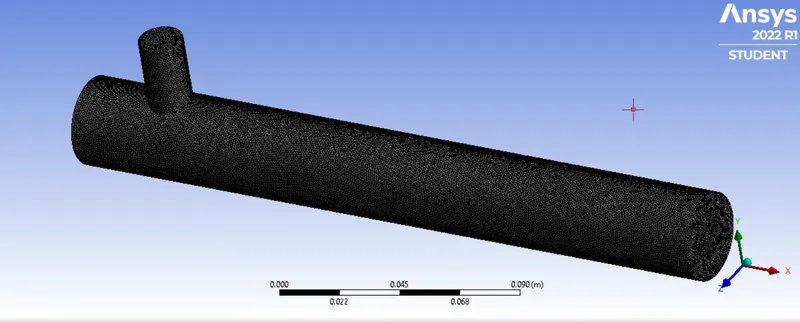
Long Tee model is selected for grid dependance test.
Mesh with quality of 0.005
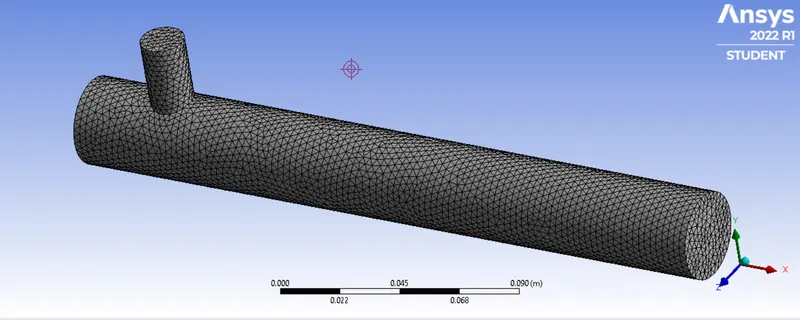
Mesh with quality of 0.003
Mesh with quality of 0.001
6.Conclusion:
1.Average outlet Temperature
On comparing the both models with analytical solution we got nearly the same results.
2.Iteration to coverge:
No.of iteration taken to converge is less for Realisable K-epsilan model than K-omega SST model.
3.Standard Deviation:
The standard devision of k-epsilan model is less than k-omega model which shows the better mixing efficiency in K-epsilon models.
So based on the above observations the K-epsilon turbulence model is predicting the results accurately in less no. No. of iterations. So we can use realisable K-epsilon model for Case2.
4.Mesh Quality
Decreasing the mesh size, the average outlet temperature starts approaching towards the analytical results.