Week 1- Mixing Tee
Aim: To set up steady-state simulations to compare the mixing effectiveness when hot inlet temperature is 360C & the Cold inlet is at 190C. use the k-epsilon and k-omega SST model for the first case and based on your judgment use the more suitable model for further cases.
- Case 1
- Short mixing tee with a hot inlet velocity of 3m/s.
- Momentum ratio of 2, 4.
- Case 2
- Long mixing tee with a hot inlet velocity of 3m/s.
- Momentum ratio of 2, 4.
Momentum ratio = velocity at cold inlet / velocity at hot inlet
In a table, compare the following values from the 2 cases.
- Cell count
- Average outlet temperature
- Number of iterations for convergence
Expected results:
- Velocity and temperature contour plots on the cut planes along and across the pipe.
- Velocity and temperature line plots along and across the length of the pipe.
- Perform Mesh independent study for any one case.
- Discuss the effect of length and momentum ratio on results.
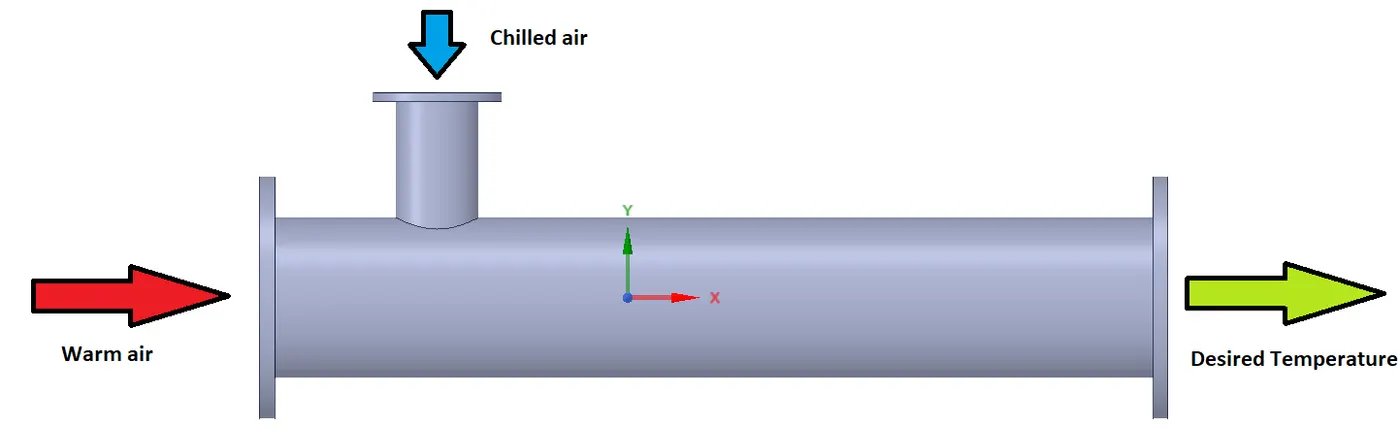
Introduction: T- junction is an important part of the piping system and it has a wide range of applications in an industry it is used to split or merge two flows with the same or different properties of fluids. for example, let's say, water is flowing from a chilling plant at 20 C but we need the water's temperature to be more than 26C for some operation then we can use a T- junction to increase the temperature of the water by making the cold water to flow in one inlet and hot water to flow in another inlet and making them mix and the resulting water will be warmer than the inlet cold water.
 C
C
Steps involved in this simulation:
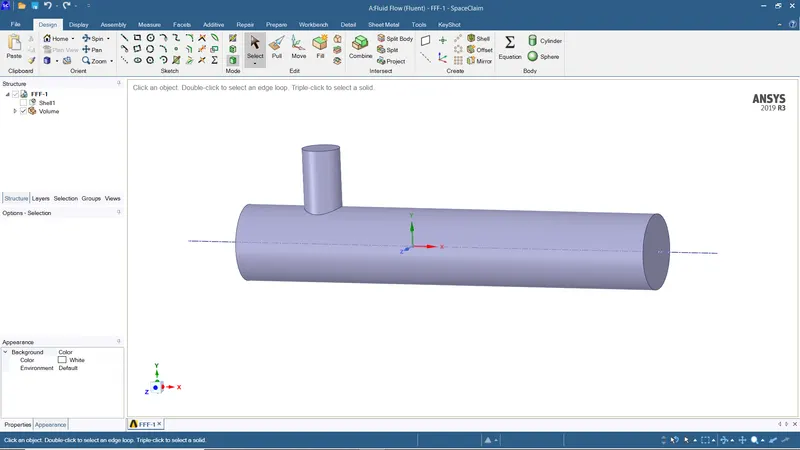
- prepare the geometry using SpaceClaim in fluent. in SpaceClaim, we need to extract the flow fluid volume and we need to suppress the flanges for the solution set up because it is not in the scope of this study
- then we need to mesh our model
- set up the model for simulation
- post-processing.
model:
CASE 1:
momentum ratio 2
The `T_(mixture )` have been calculated using analytical formula and found out to be 30.1346`C^circ`
hot fluid inlet velocity is 3/s
cold fluid inlet velocity is 6 m/s
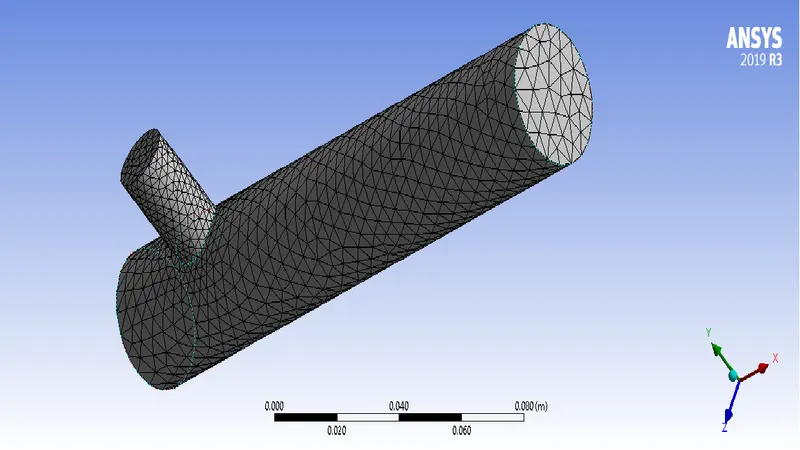
in this subcase, the Tee junction have been simulated using two turbulence models one is K-`varepsilon` and another one is k-`omega` sst and both the simulation is done with the default mesh of the model the preferred turbulence model for further cases, and the reasons are discussed later
default mesh details
element size 1.0219e-002 m
nodes: 2819
elements: 12646
k-`varepsilon` model
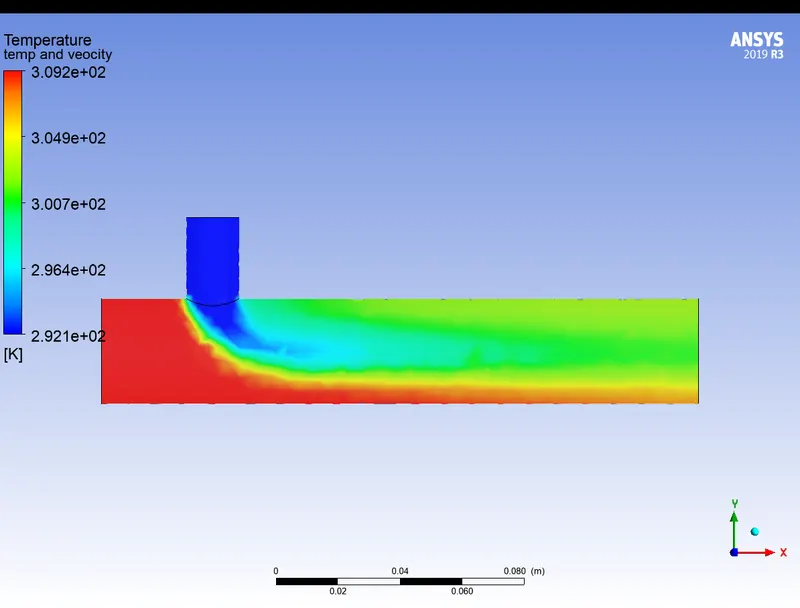
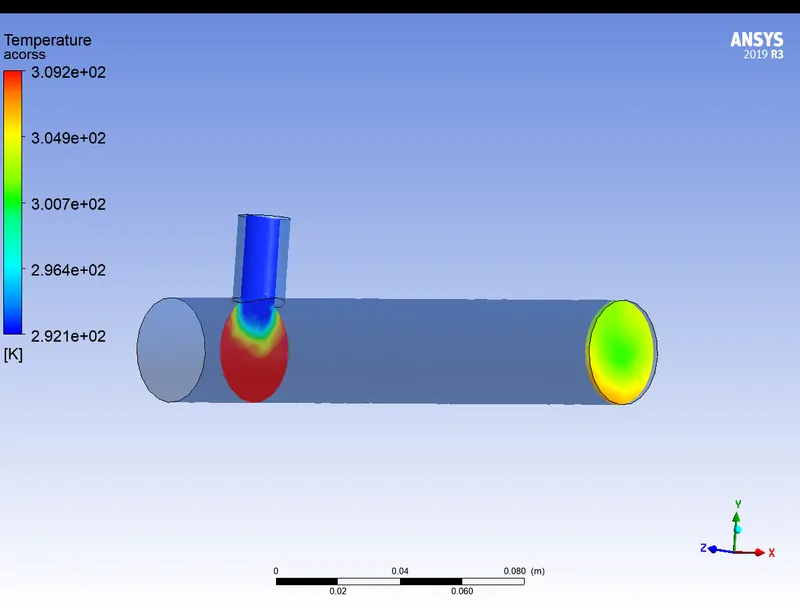
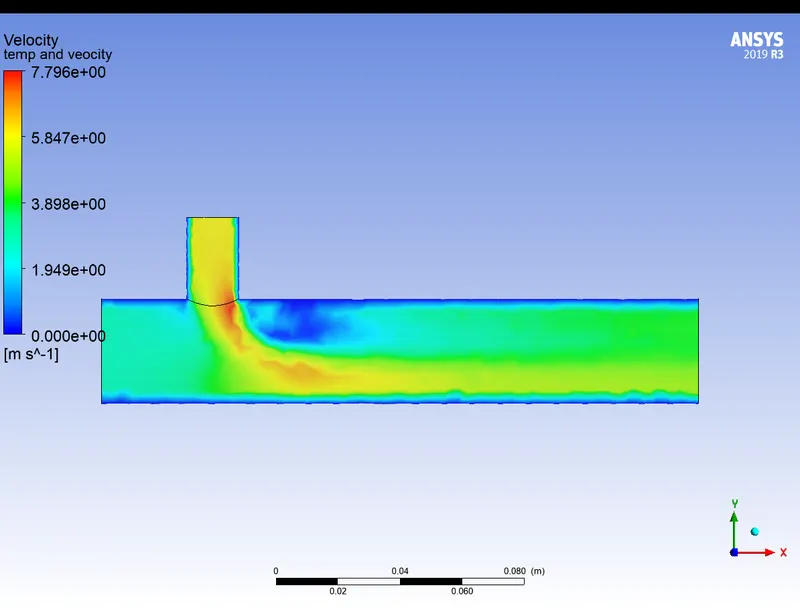
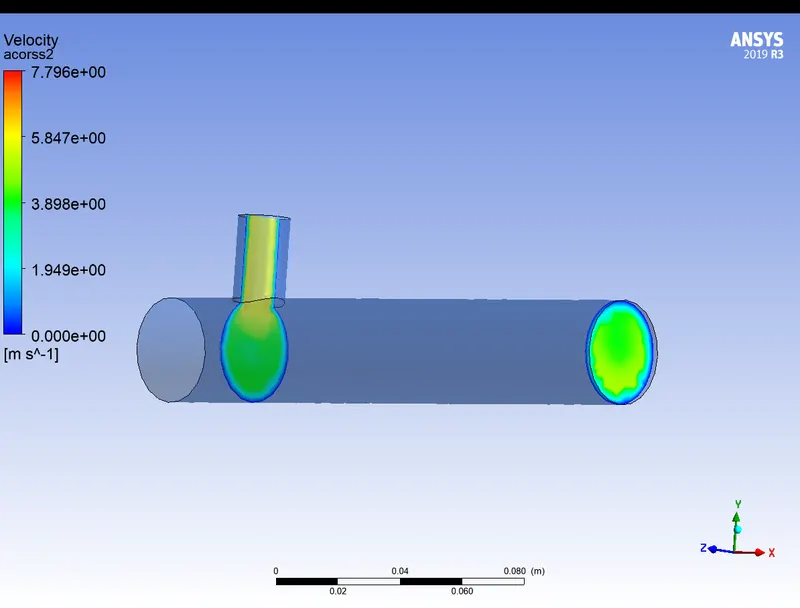
the results are obtained by simulating this model are given below
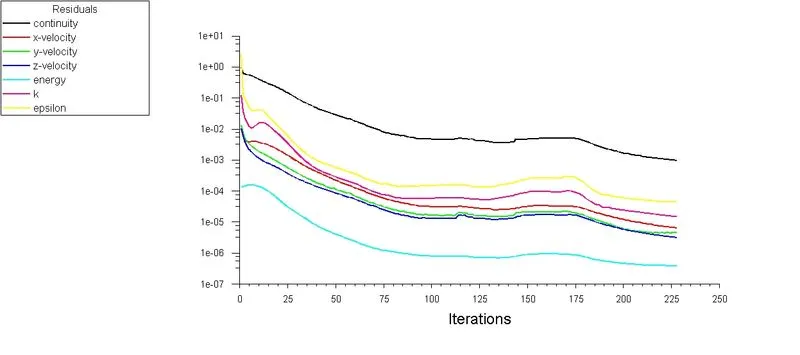
| convergence | 228 iteration |
| the average temperature in the outlet | 30.217751`C^circ` |
| standard deviation | 1.7403 |
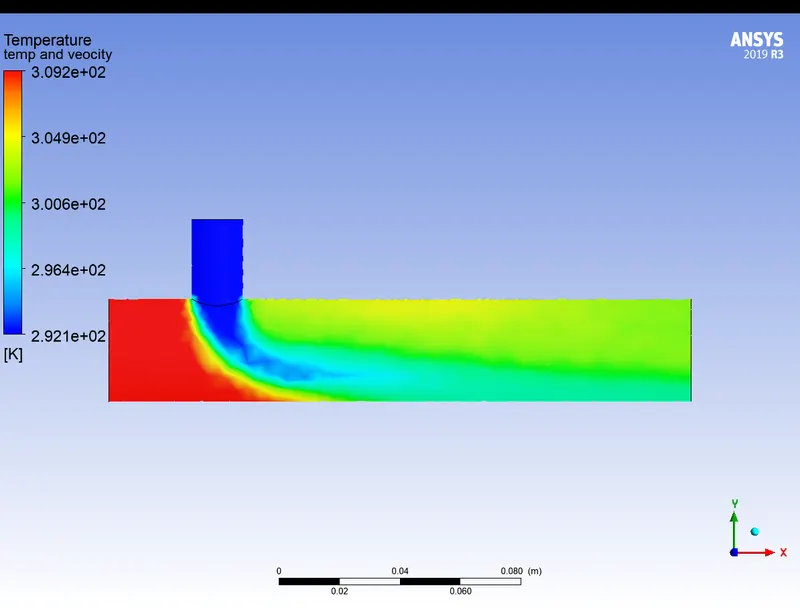
Temperature contour along the pipe
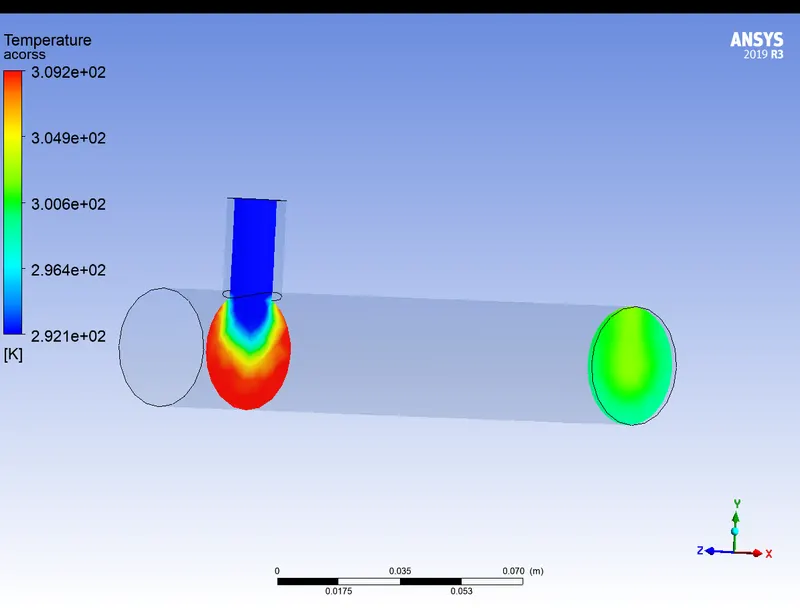
temperature contour across the pipe
velocity contour along and across the pipe
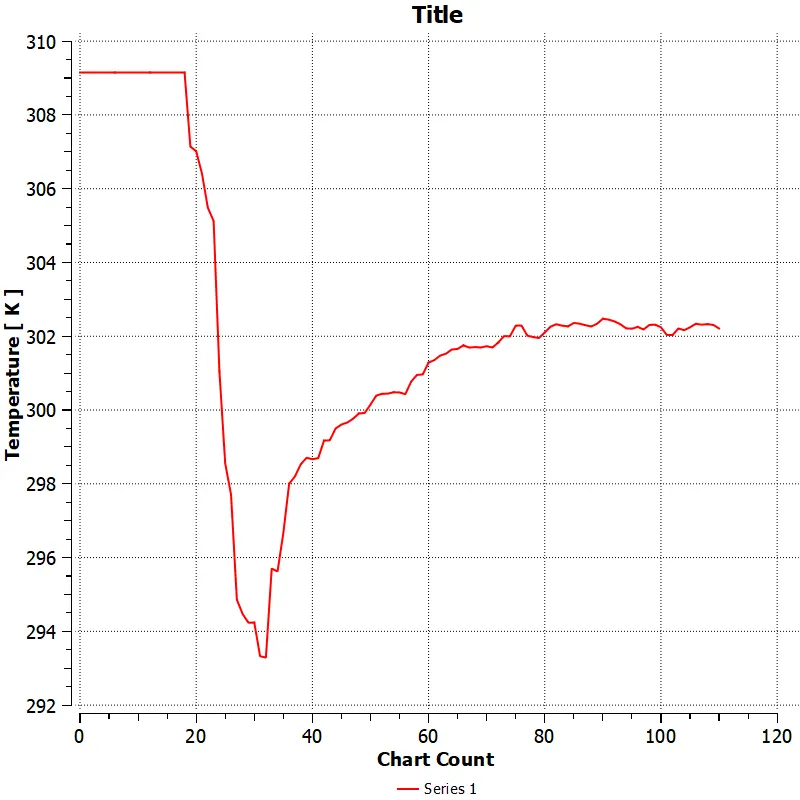
temperature line plot along the pipe
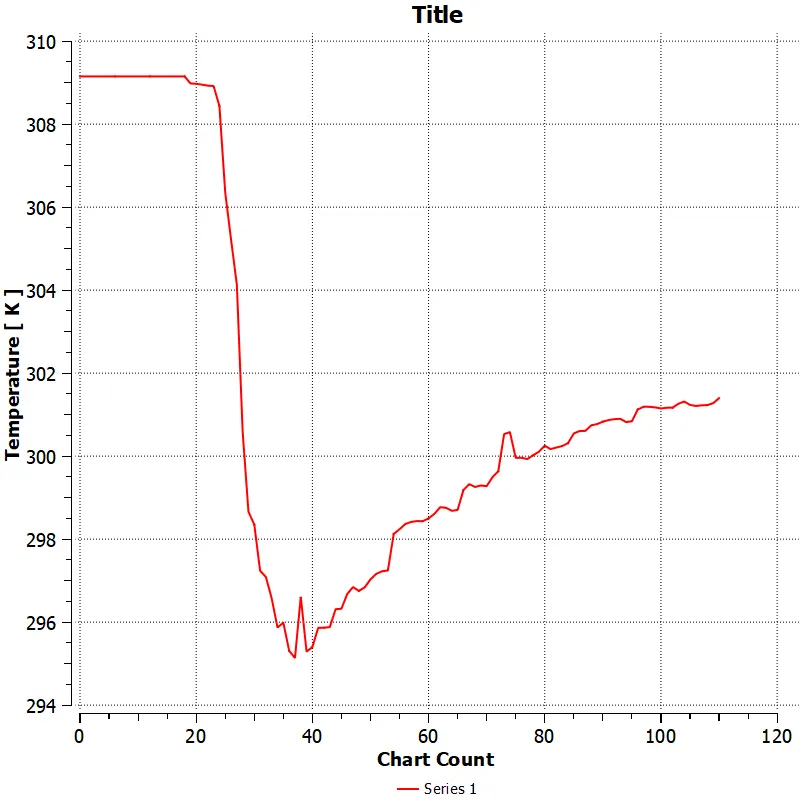
temperature line plot across the pipe
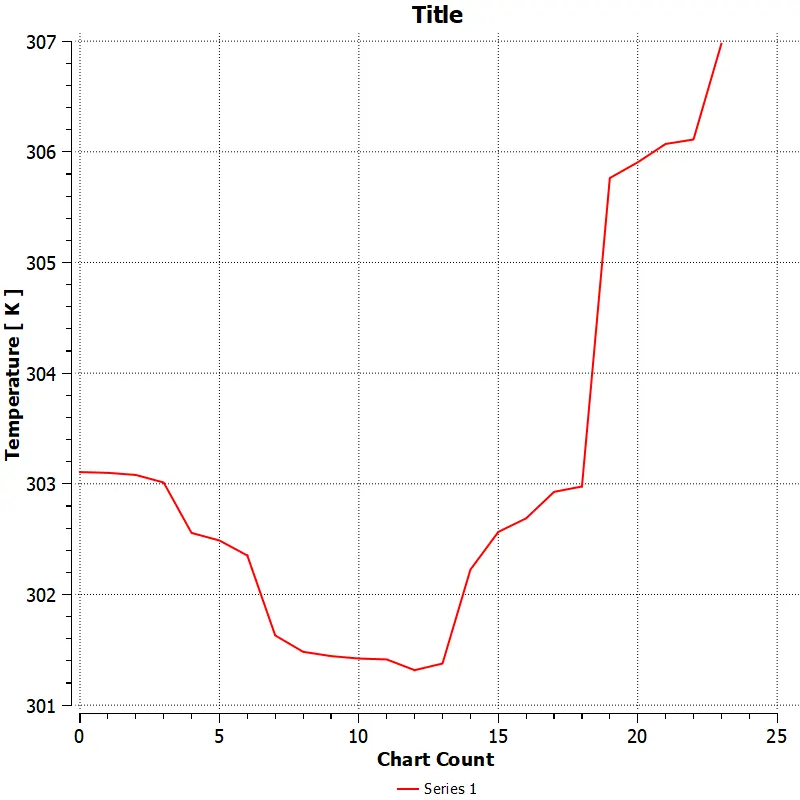
velocity line plot along the pipe
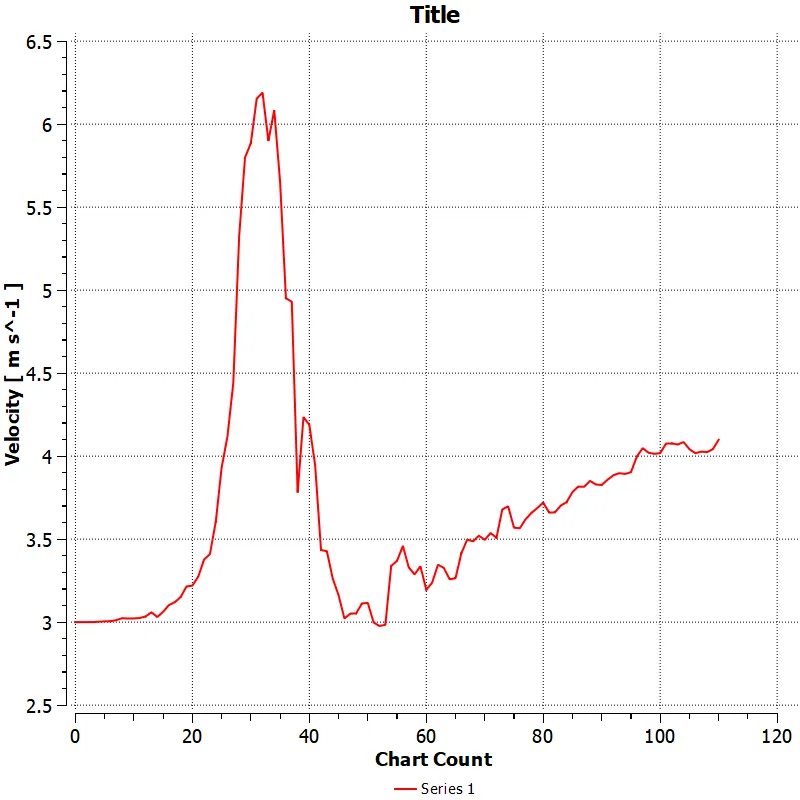
velocity line plot across the pipe
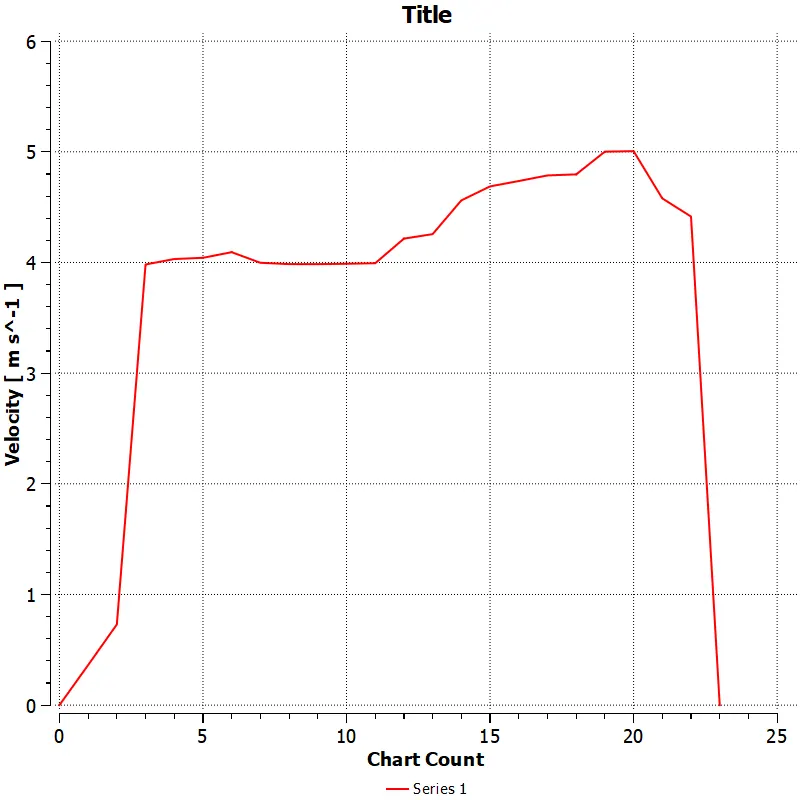
K-`omega` sst model
in this model, the same mesh generated in the k-`varepsilon` has been followed
| convergence | 344 iteration |
| average temperature | 30.2093`C^circ` |
| standard deviation | 1.9946 |
velocity contour along the pipe
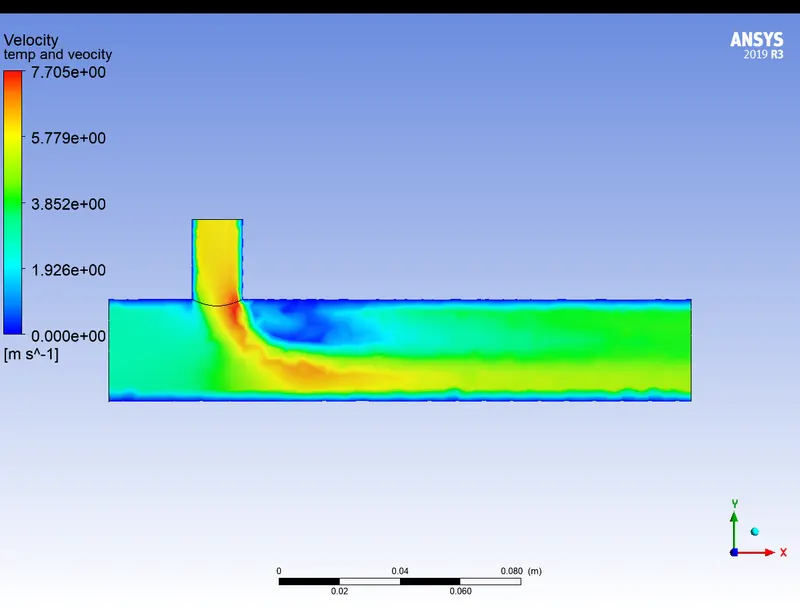
K-`varepsilon` and K-`omega` sst models
k-`varepsilon` model is used to capture the effect of turbulence in the region away from the wall and this model fails in complex flows involving severe pressure gradients, separations, and streamlined curvature.
k-`omega` sst model is used to capture the effect of turbulence at both regions away from the wall as well as in the near-wall region.
by comparing the models used in case 1 with momentum ratio 2 we can see the k-`omega`sst model need more iteration to converge than the k -`varepsilon`model but the average temperature obtained from k-`omega` sst model has more accuracy than k-`varepsilon` model.
but in this case, since we are more interested in the `T_(mixture)` rather than the near-wall effects so there is no need of using the k`omega`sst model so we will follow the k`varepsilon` model for further cases.
momentum ratio 4
This subcase will have 2 mesh for the same short Tee to perform mesh independent test but the temperature of the fluids remains unchanged.
T_mix=27.27860`C^circ`
mesh 1 :
element size:1.00210e-002 m
node:2819
number of elements:12646
temperature contour along the pipe
temperature contour across the pipe
temperature line plot along the pipe:
temperature line plot across the pipe
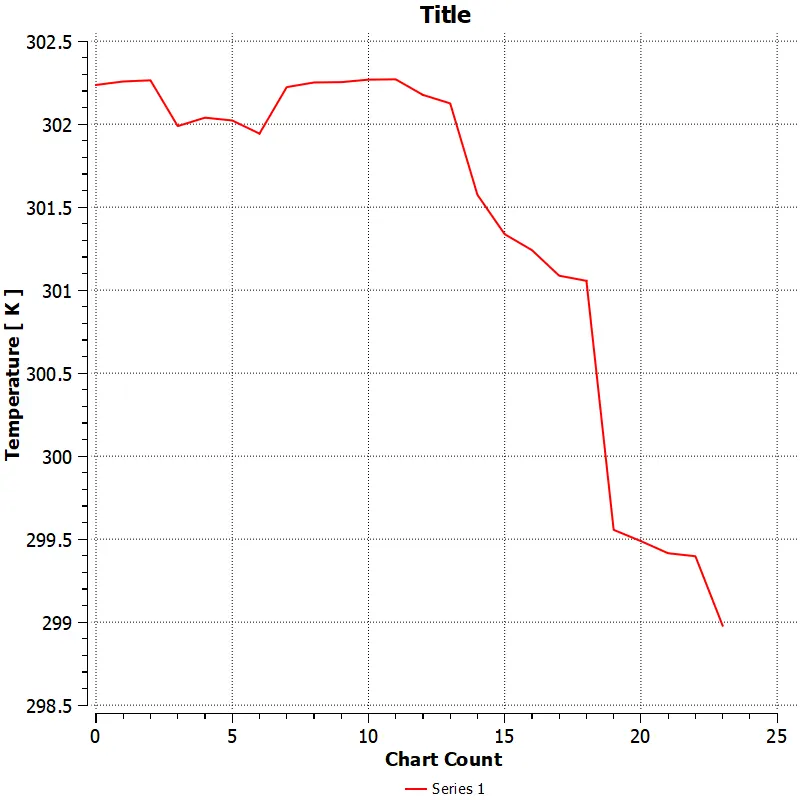
velocity line plot along and across the pipe
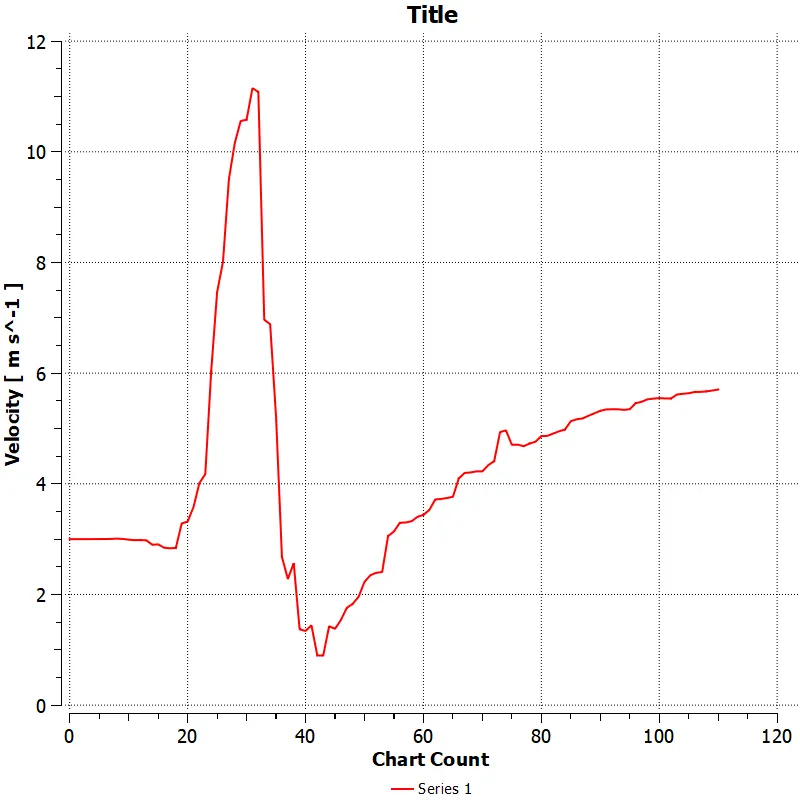
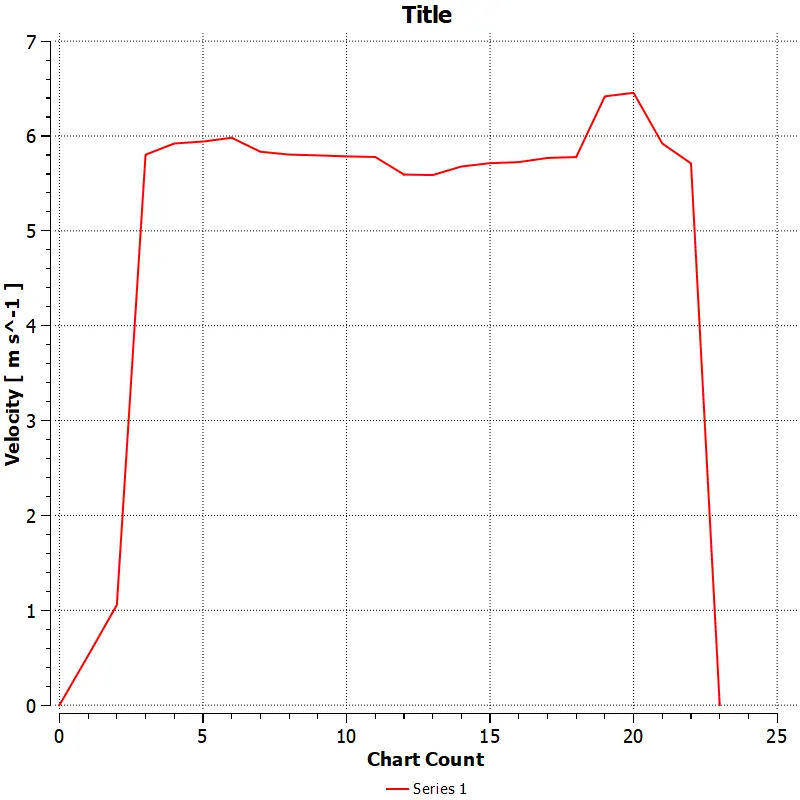
| convergence | 121 |
| average temperature | 27.54 |
| standard deviation | 1.1367 |
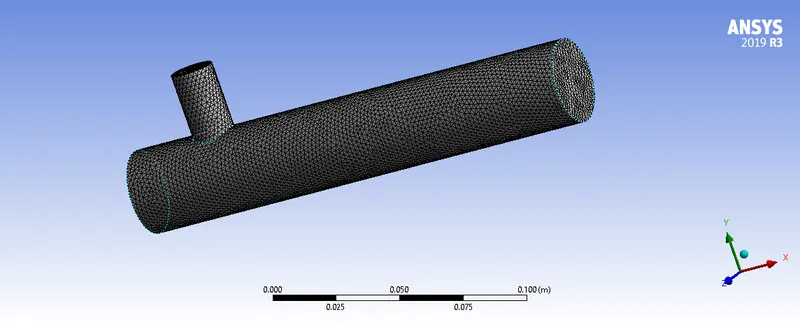
mesh 2:
element size:0.002 m
nodes:21349
number of elements:105949
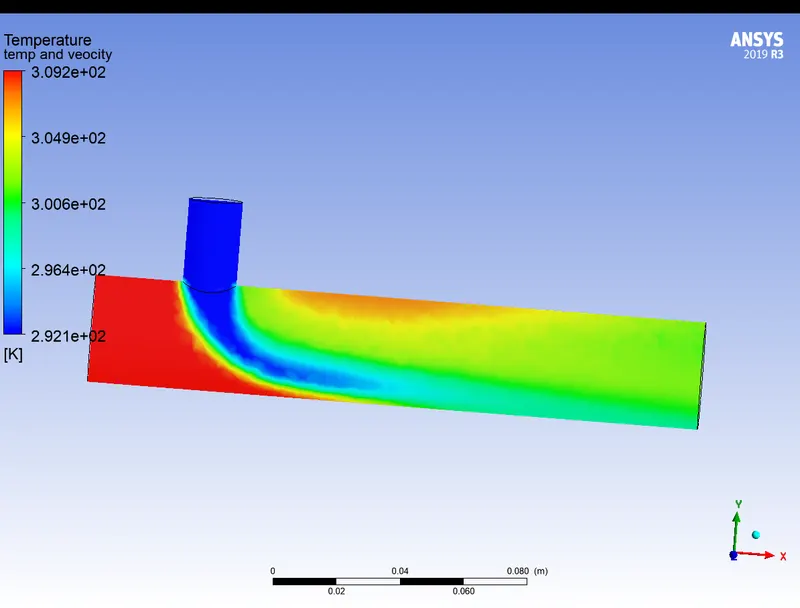
Temperature contour along the pipe
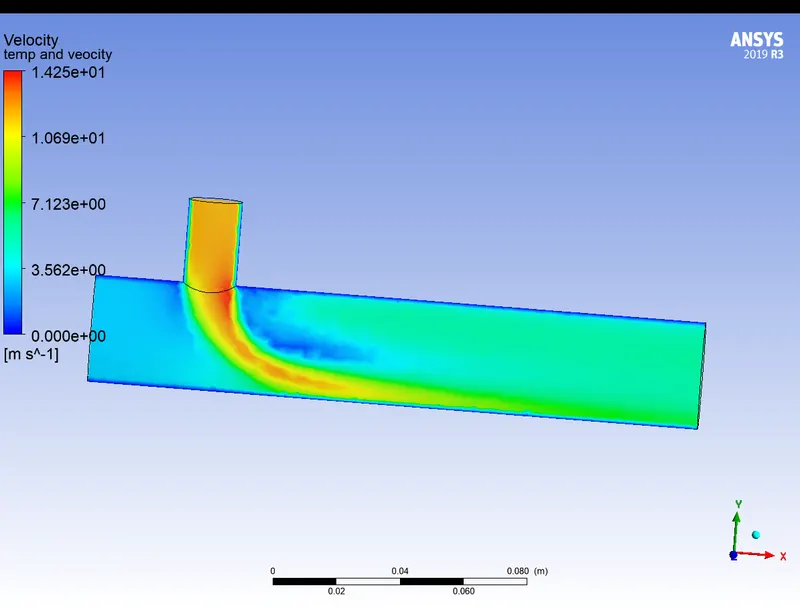
velocity contour along the pipe
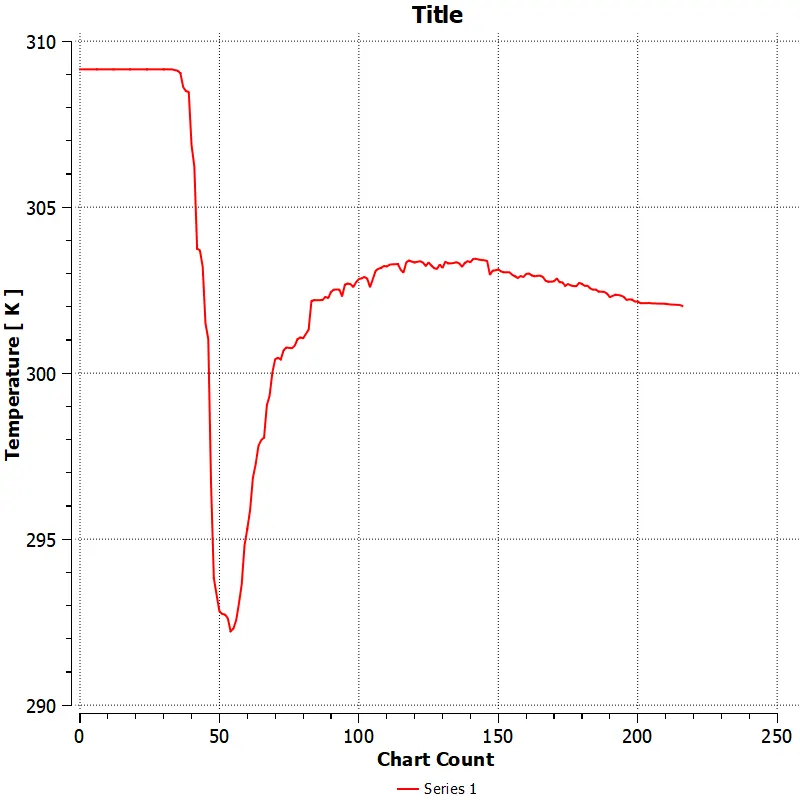
temperature line plot along the pipe
velocity line plot along the pipe
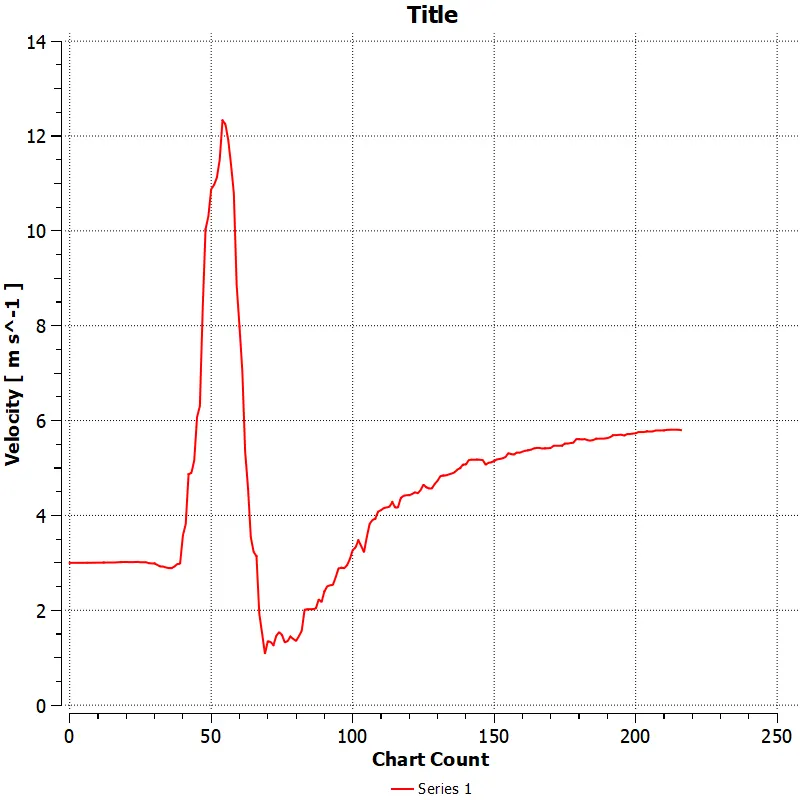
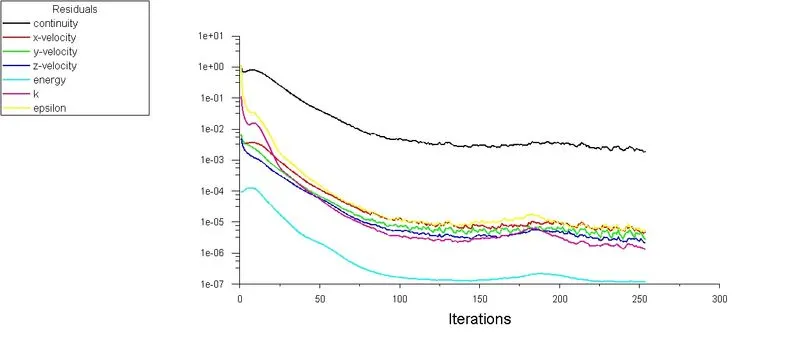
| convergence | 253 |
| average temperature | 27.5484 |
| standard deviation | 0.7472 |
Discussion about the mesh
As we can see both temperature and velocity contour along the pipe are smother for finer mesh. and also we can observe that default mesh will converge faster than finer mesh.
even though the average temperature of both meshes is approximately the same the finer mesh gives us more smother contours which will help us to understand the process better.
for further cases, the finer mesh will be followed to obtain smoother contours.
CASE 2: LONG TEE
momentum ratio 2
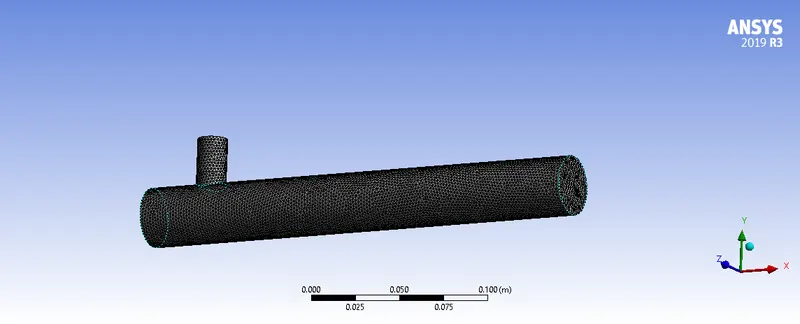
Element size: 0.002m
nodes:28334
number of elements:140297
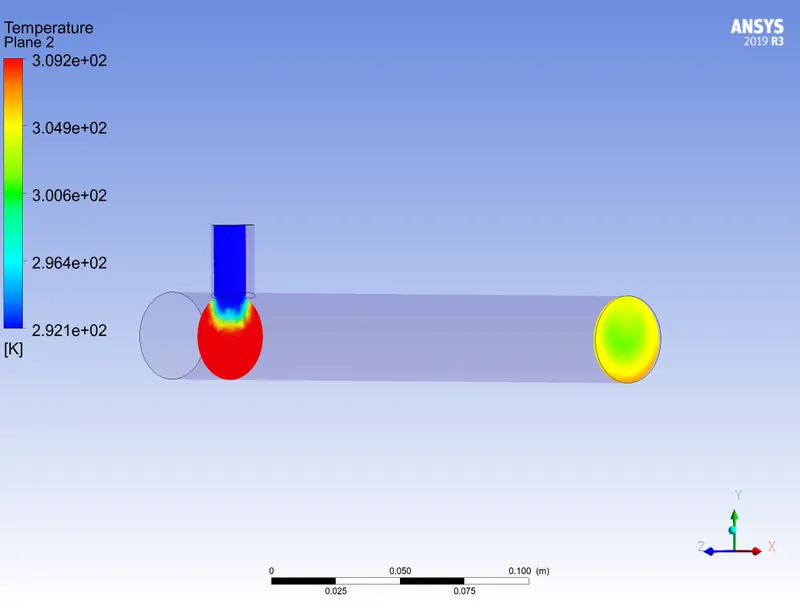
temperature contour along the pipe
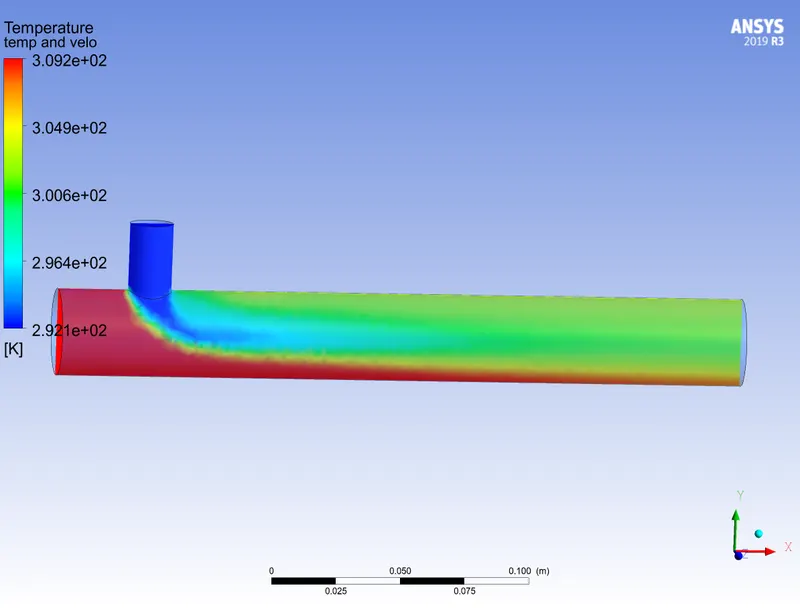
temperature contour across the pipe
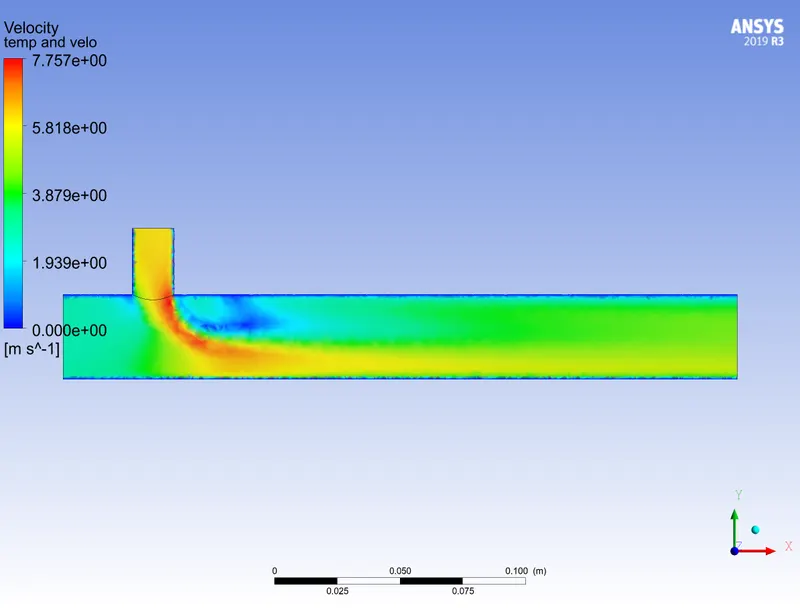
velocity contour along the pipe
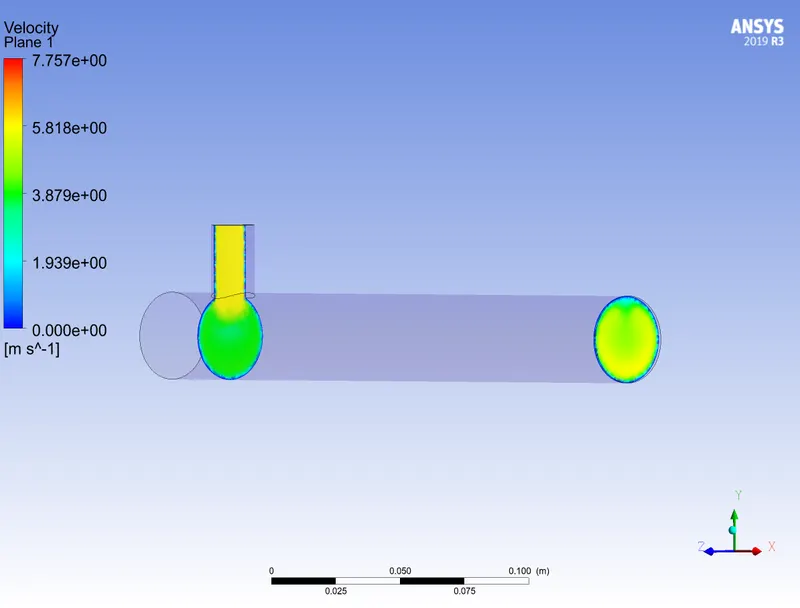
velocity contour across the pipe
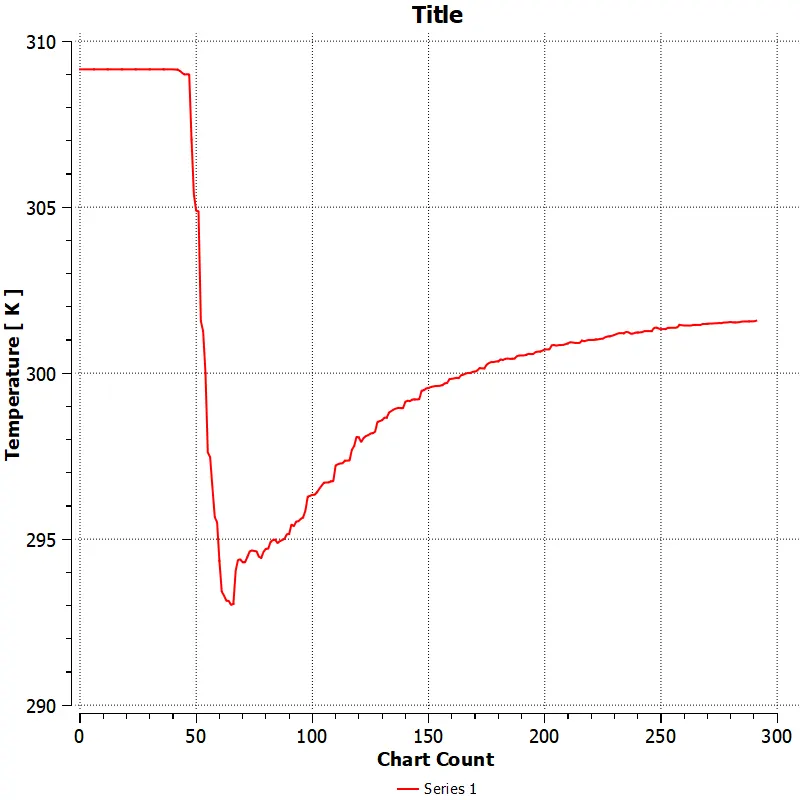
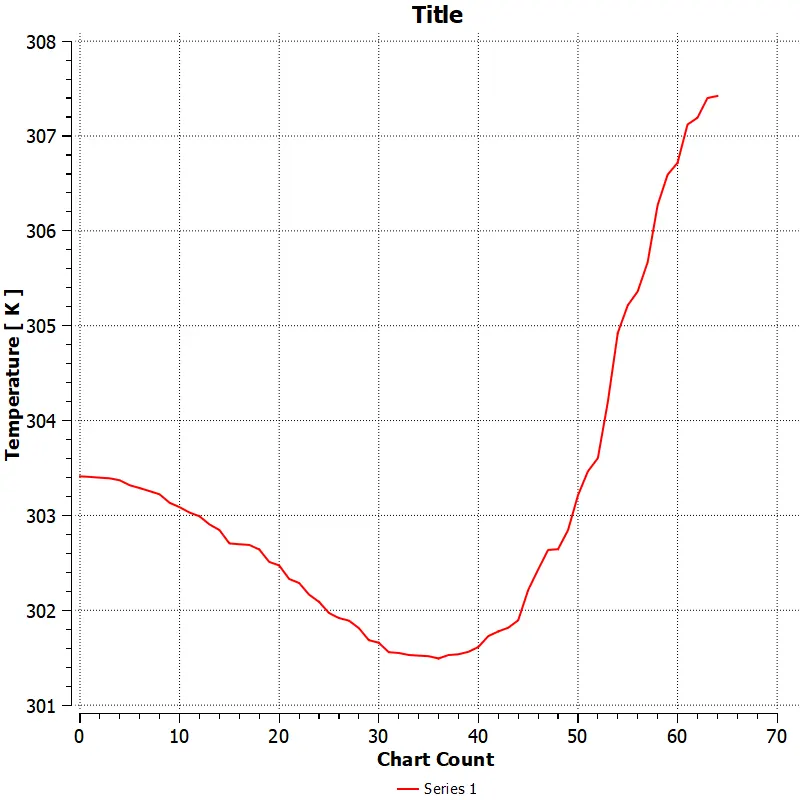
line plot of temperature along and across the pipe
line plot of velocity along and across the pipe
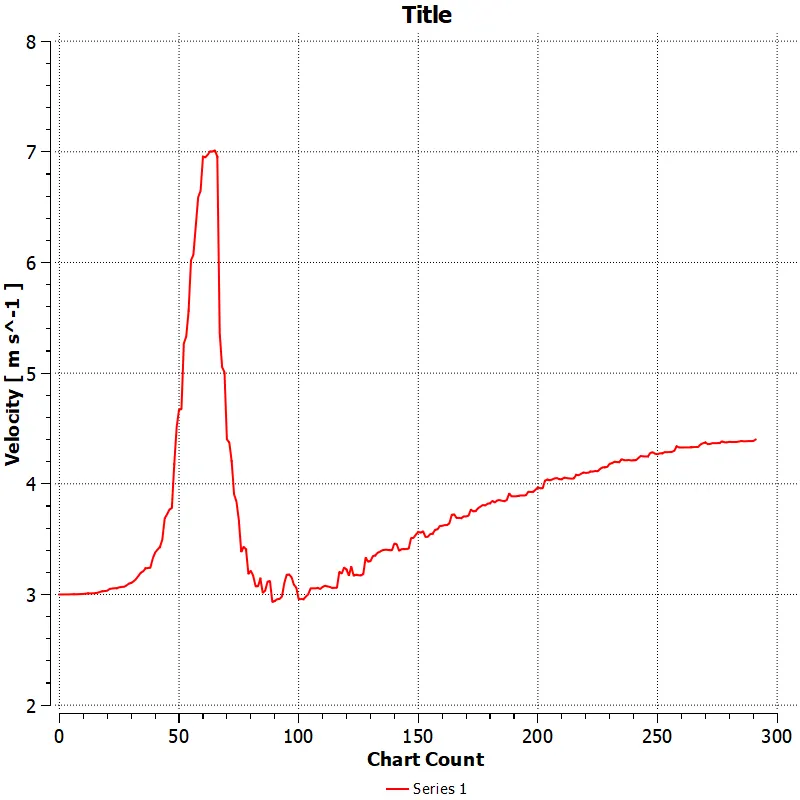
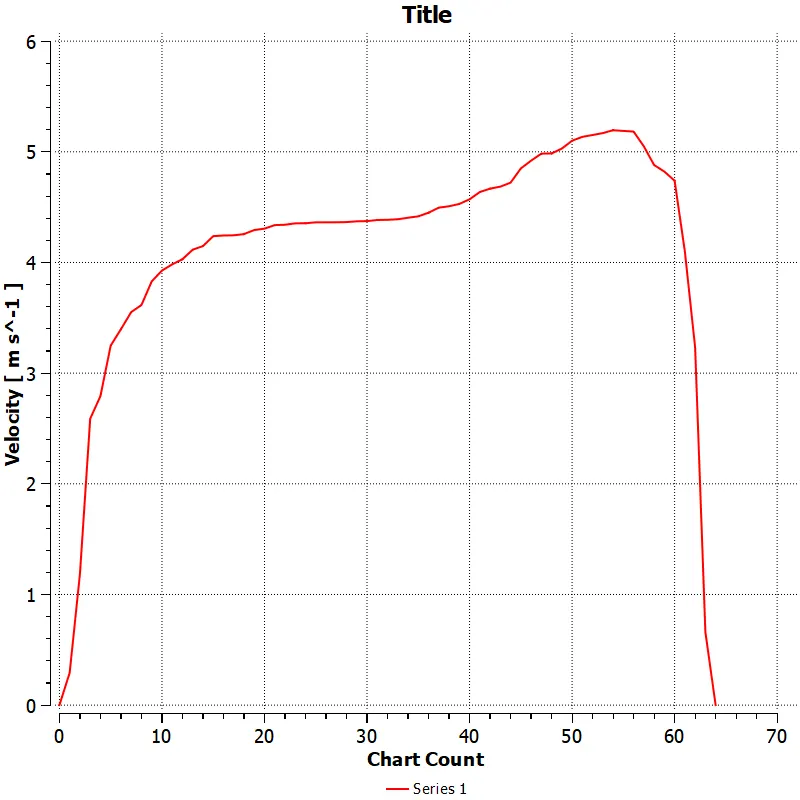
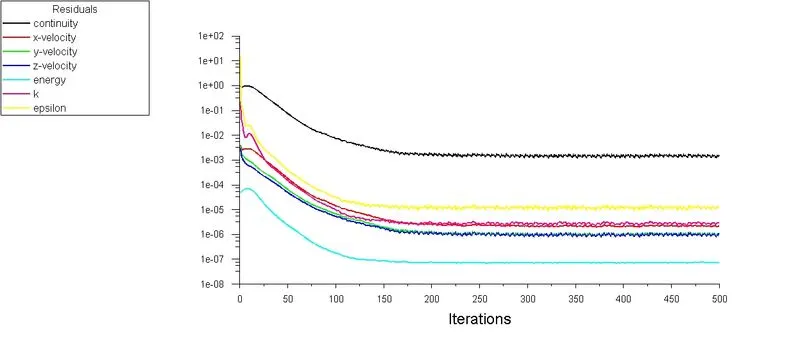
| convergence | 250 |
| average temperature | 30.395104 |
| standard deviation | 1.6525 |
CASE 2 :
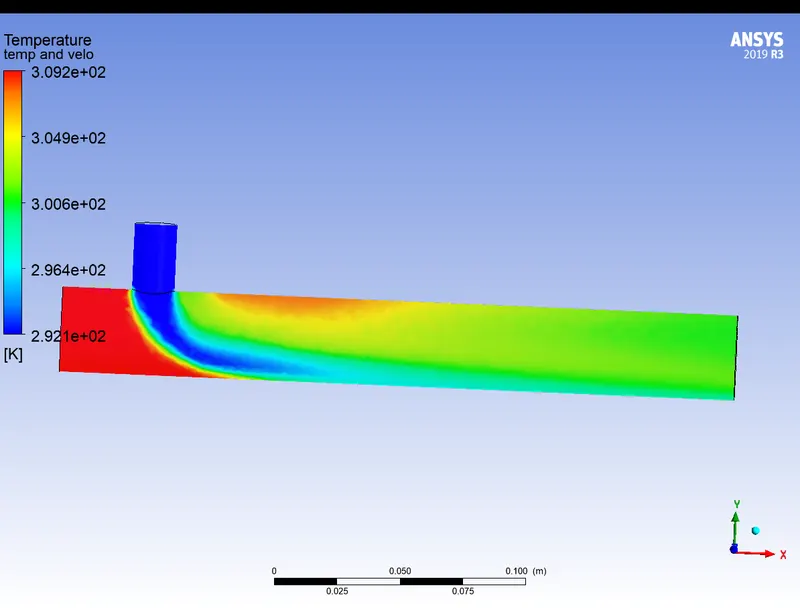
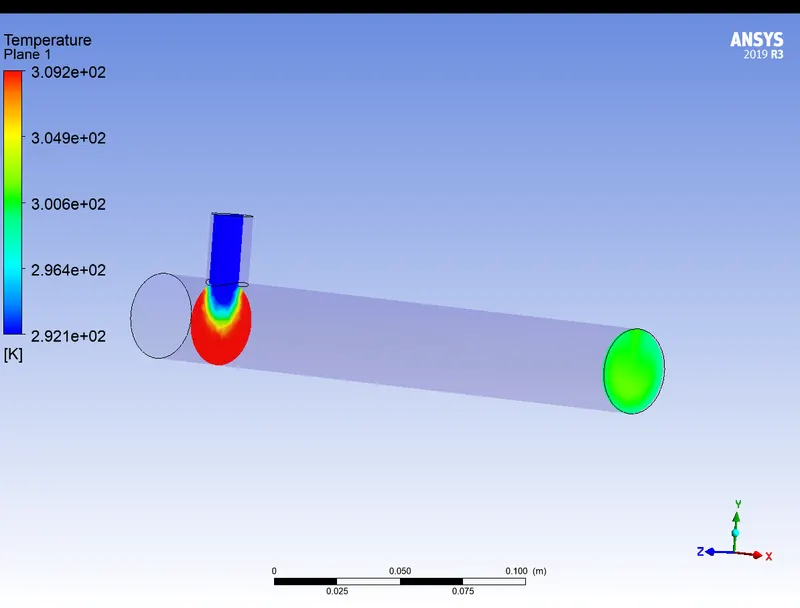
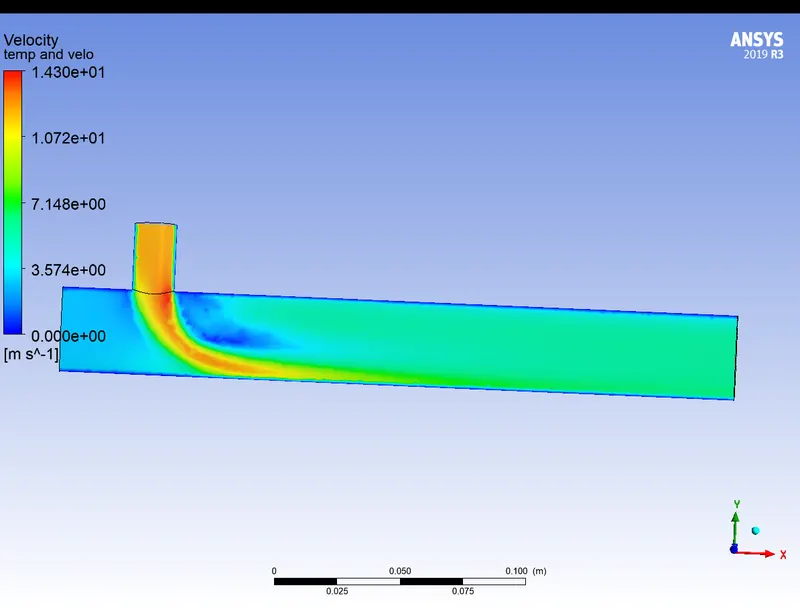
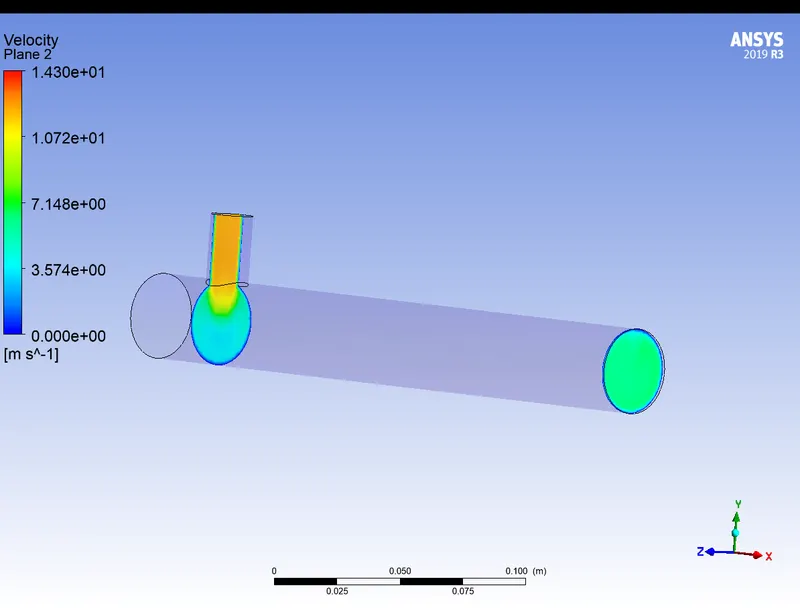
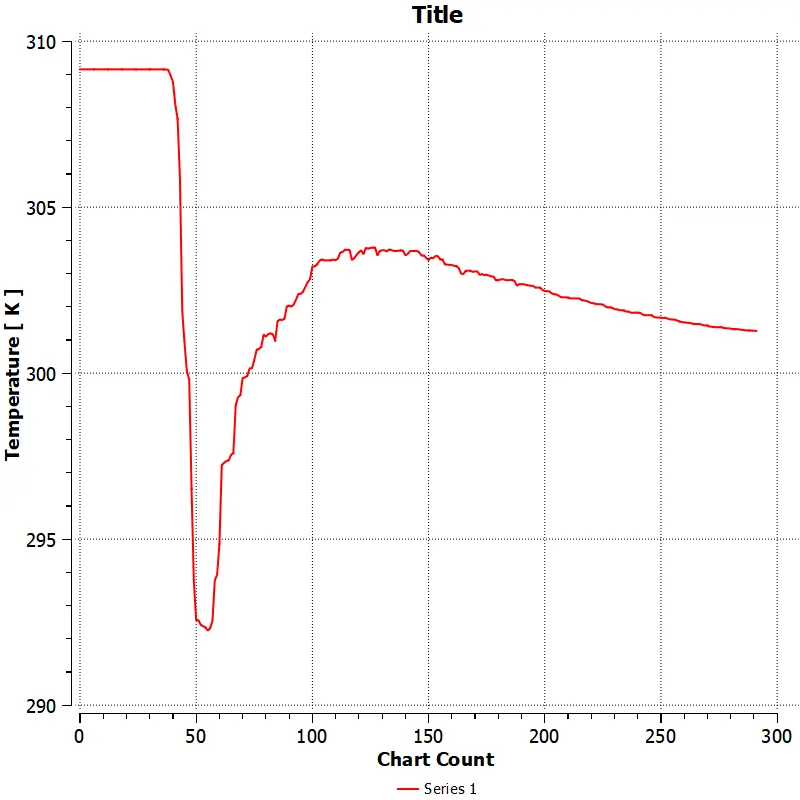
momentum ratio 4:
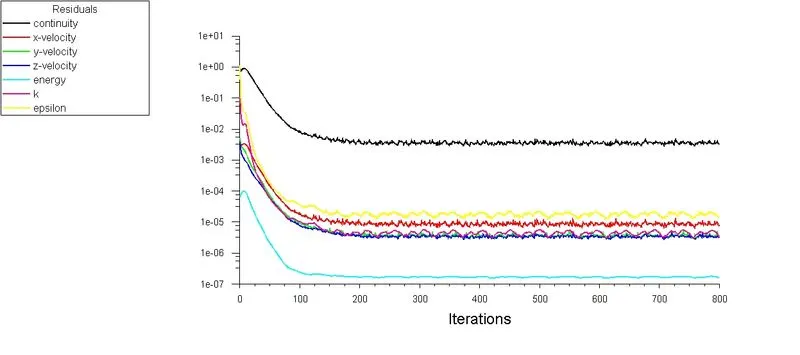
The mesh used in this simulation and the previous simulation is the same
Temperature contour along and across the pipe
velocity contour along and across the pipe
line plot of temperature along the pipe
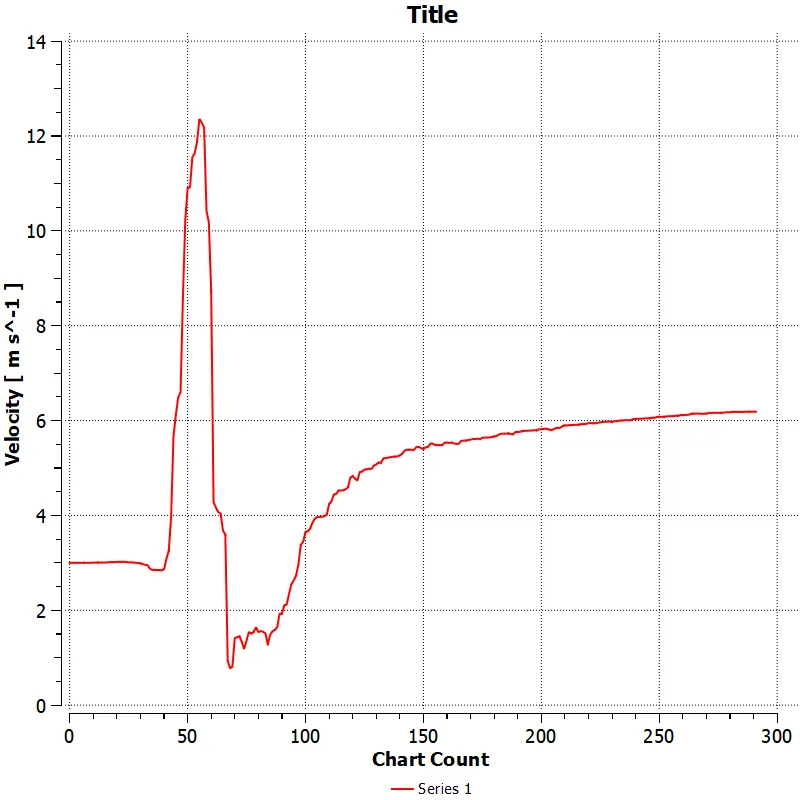
line plot of velocity along the pipe
| convergence | 325 |
| average temperature | 27.50248 |
| standard deviation | 0.7106 |
| CASE no | cell count | number of iteration to converge | average temperature |
|
CASE 1 momentum ratio 2 |
1264 | 228 | 30.2093 |
|
CASE 1(fine mesh) momentum ratio 4 |
105949 | 253 | 27.54 |
|
CASE 2(fine mesh) momentum ratio 2 |
140297 | 250 | 30.395 |
|
CASE 2(fine mesh) momentum ratio 4 |
140297 | 325 | 27.5024 |
Conclusion :
- As we can see in case 1 and case 2 temperature at the outlet decrease significantly when the cold inlet velocity is increased which is evident that the higher the momentum ratio higher will be the temperature drop at the outlet.
- by comparing the temperature contour along the Tee direction, in case 1 and case 2 which can say that in case 2(long tee) we can clearly say that case has higher mixing in the fluid this is because for some momentum ratio the mixing of hot and cold fluids will also be determined by the length of the Tee.