Simulation of a Mixing Tee with two dimensional cases
AIM:
- To set up steady state simulations to compare the mixing effectiveness when the hot inlet temperature is 36C, and the cold inlet is 19C.
- Use the K-epsilon and k-omega SST models for the first case to get proper judgement about each method, later use the most suitable model for further simulations.
OBJECTIVE:
- Simulate each case for the given velocity and momentum ratio.
- Compare the results from the 2 cases about the cell count, average outlet temperature, and the number of iterations for convergence.
- Plot the velocity and temperature contour plots along and across the pipe.
- Also, plot the velocity and temperature line plots along and across the length of the pipe.
- Perform mesh independent for any one case.
- Moreover, discuss the effect of length and momentum ratio results.
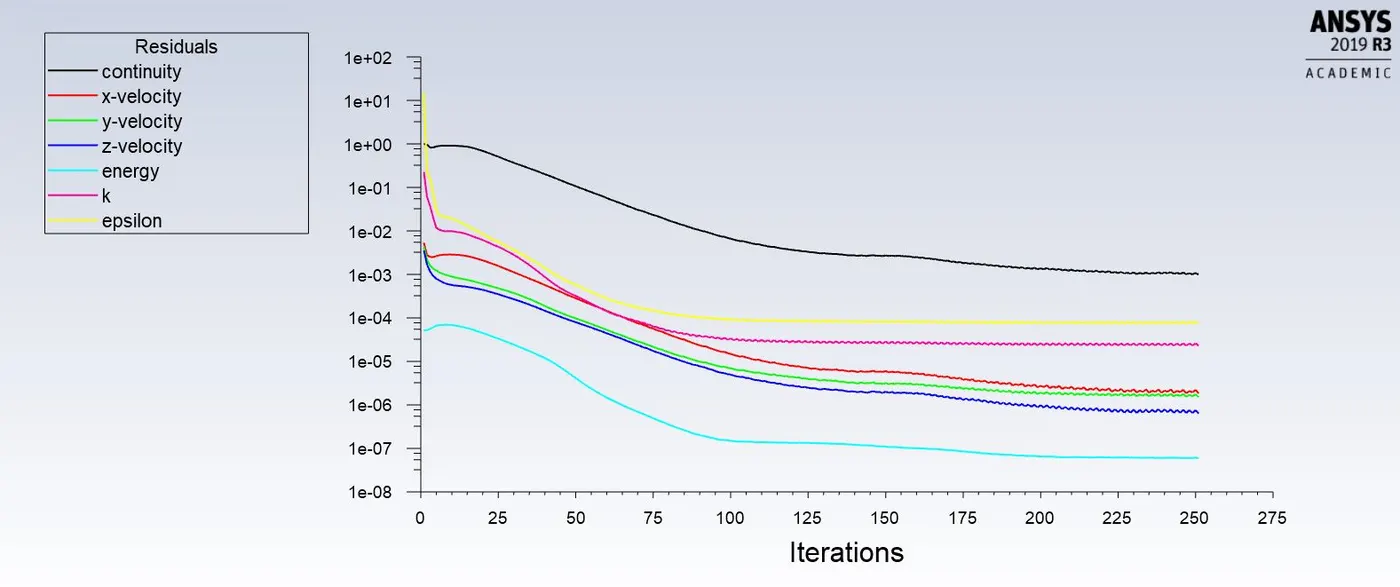
- Lastly, for each simulation show the convergence plot.
INTRODUCTION
Mixing of gases in internal flows occurs in many applications related to the process industry and power generation. A good example is the production of natural gas of a required calorific value. Natural gas from several production wells and nitrogen are mixed to the specified composition. The production gas is sampled, and on the basis of the samples the individual flows are adjusted. In order to minimize delay times in the feedback a mixer is employed.
The T-Junction is an apparatus used for mixing of different fluids. In the T-junction the phenomenon of mixing occurs.Thermal mixing is one of the causes of thermal fatigue failure in nuclear power plants. Thermal mixing characterizes the phenomenon where hot and cold flow streams join, mix and result in temperature fluctuations.
PROBLEM DESCRIPTION:
To simulate the mixing effectiveness with two different cases
CASE 1(a):
- Short Mixing Tee with inlet velocity of 3m/s.
- Momentum ratio 2
CASE 1(b):
- Short Mixing Tee with inlet velocity of 3m/s.
- Momentum ratio of 4
CASE 2(a):
- Long Mixing Tee with inlet velocity of 3m/s.
- Momentum ratio of 2
CASE 2(b):
- Long Mixing Tee with inlet velocity of 3m/s.
- Momentum ratio of 4
*Momentum Ratio = Velocity at cold inlet/Velocity at hot inlet*
Reference Formulas:-
SETTING UP THE PROBLEM:
- Open ANSYS WORKBENCH and set up a fluent simulation setup.
- In The fluent open the geometry which opens the space claim, and load the geometry.
- From the solid model extract the Working fluid using the Extract the volume command in the space claim to compute the simulation in the selected region.
- Now, close the space claim and open the mesh setup and then create the boundary and provide them the names accordingly.
- Now generate the mesh to the selected volume, after generating the mesh close the mesh setup.
- Open the Setup module and the give all the parameters required for calculation such as simulation type, input velocity and materials and boundary conditions.
- Now setup the models for k-epsilon model and understand its concept.
- Now in Results section start check the results for the number of iterations required to see all the simulated results.
- Close the results section and open the solution setup and check the contours for temperature and velocity.
- After that again go to mesh and change the mesh size and repeat the same procedure for the given mesh.
- Change the mesh size one more time so that it is easy to run the mesh independence test.
- Now check how it influence the dimension and momentum ratio.
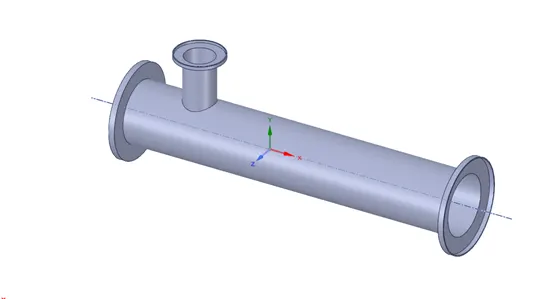
MODEL SHORT TEE:
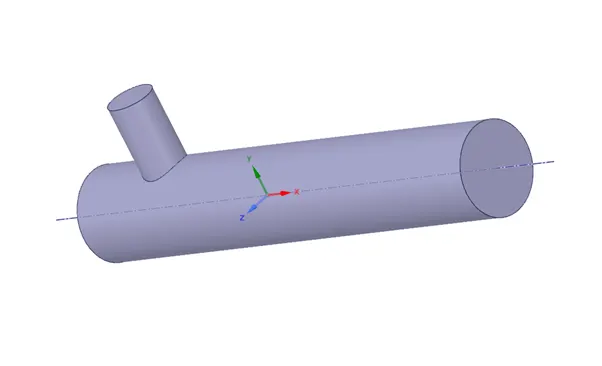
VOLUME EXTRACTED MODEL:
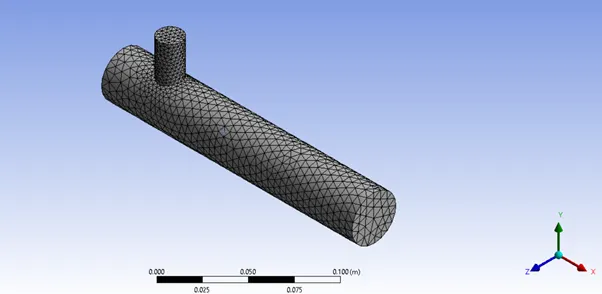
DEFAULT MESH:
Default: 0.010219 m
This is a baseline mesh where it is provided by ansys itself without taking any element size
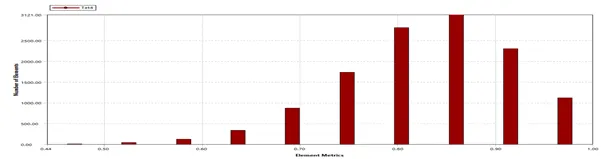
MESH QUALITY:
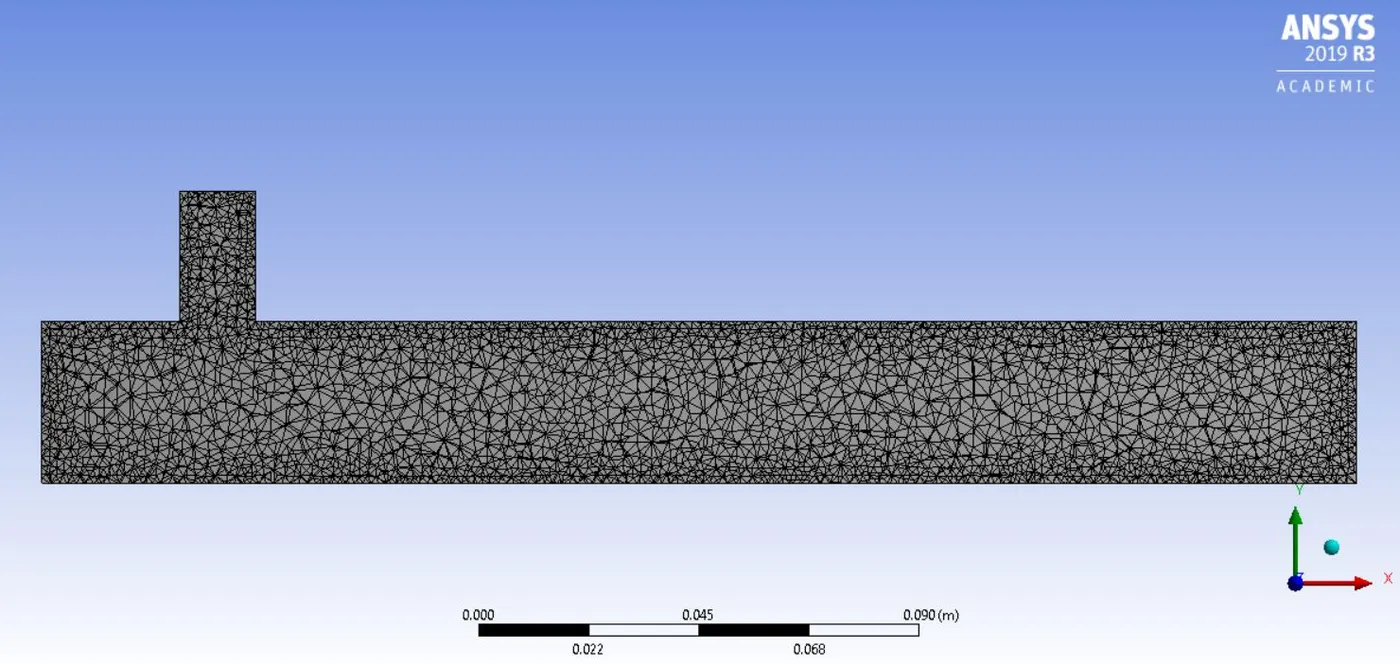
A mesh element metric that identifies the quality of mesh was employed and it can be seen that the elements of the lowest quality are minimal. Most of the elements have quality in the range of 0.7-1. Hence, the mesh is of acceptable quality.
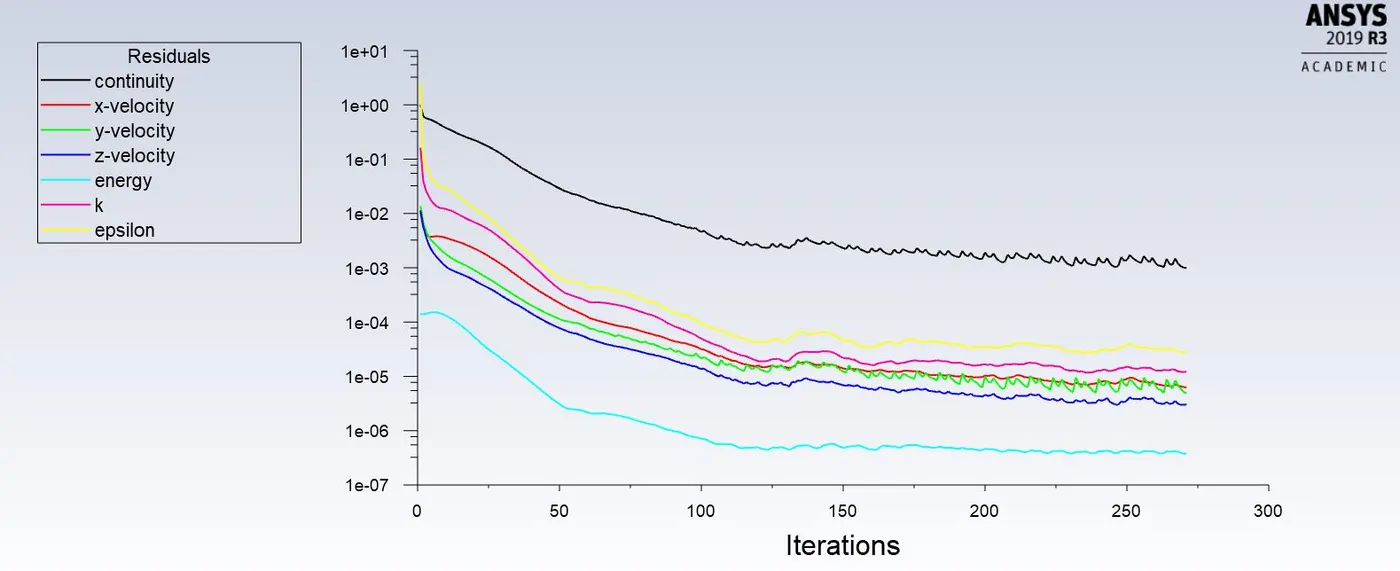
Residual plot:
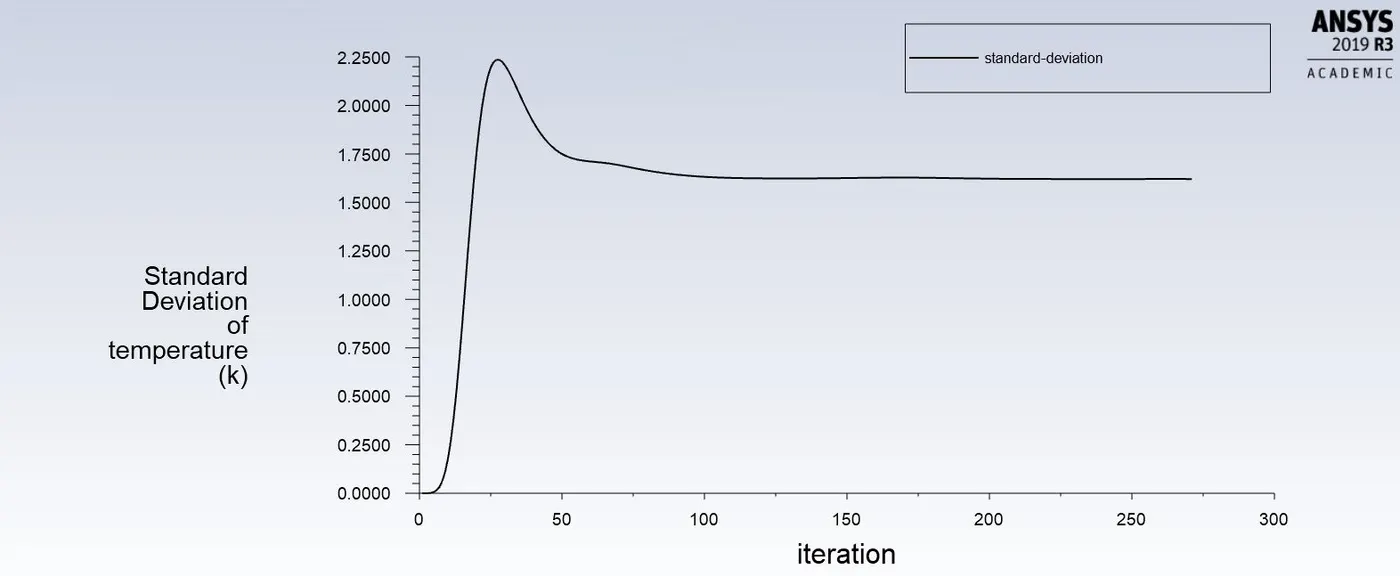
Standard Deviation:
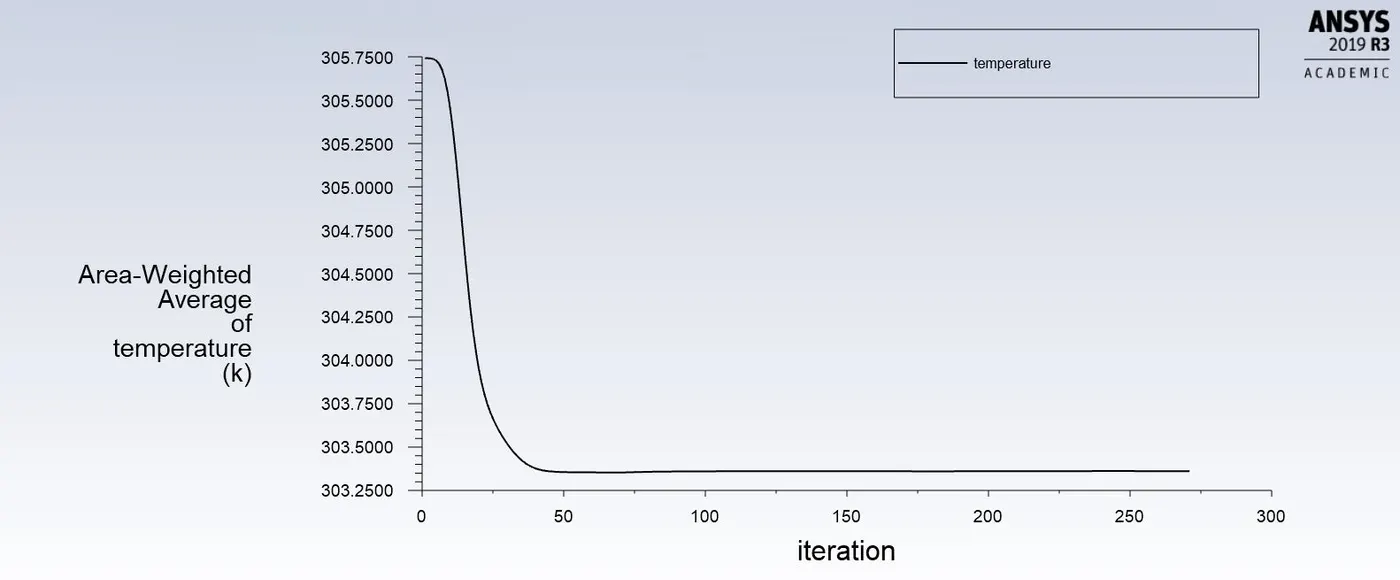
Temperature:
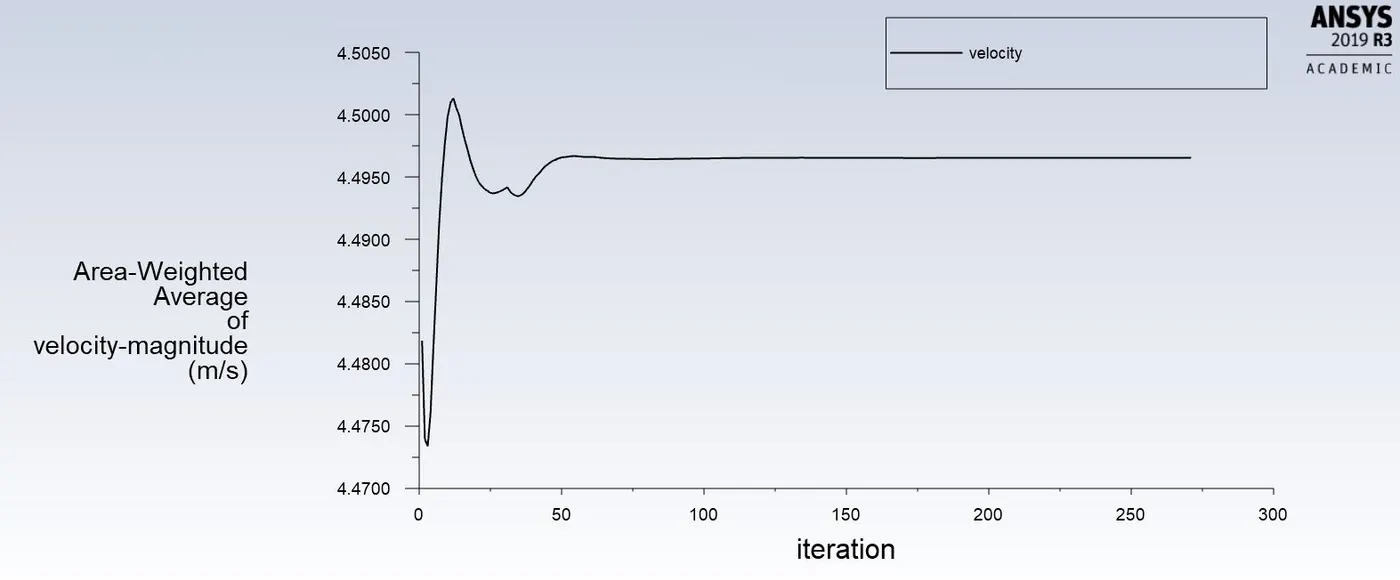
Velocity:
CFD POST:
Post processing is carried out in this setup where using differnet contours to showcase the results with idffernt colours in it this is the final step taken place in the fluent for all the case studies
Contours-
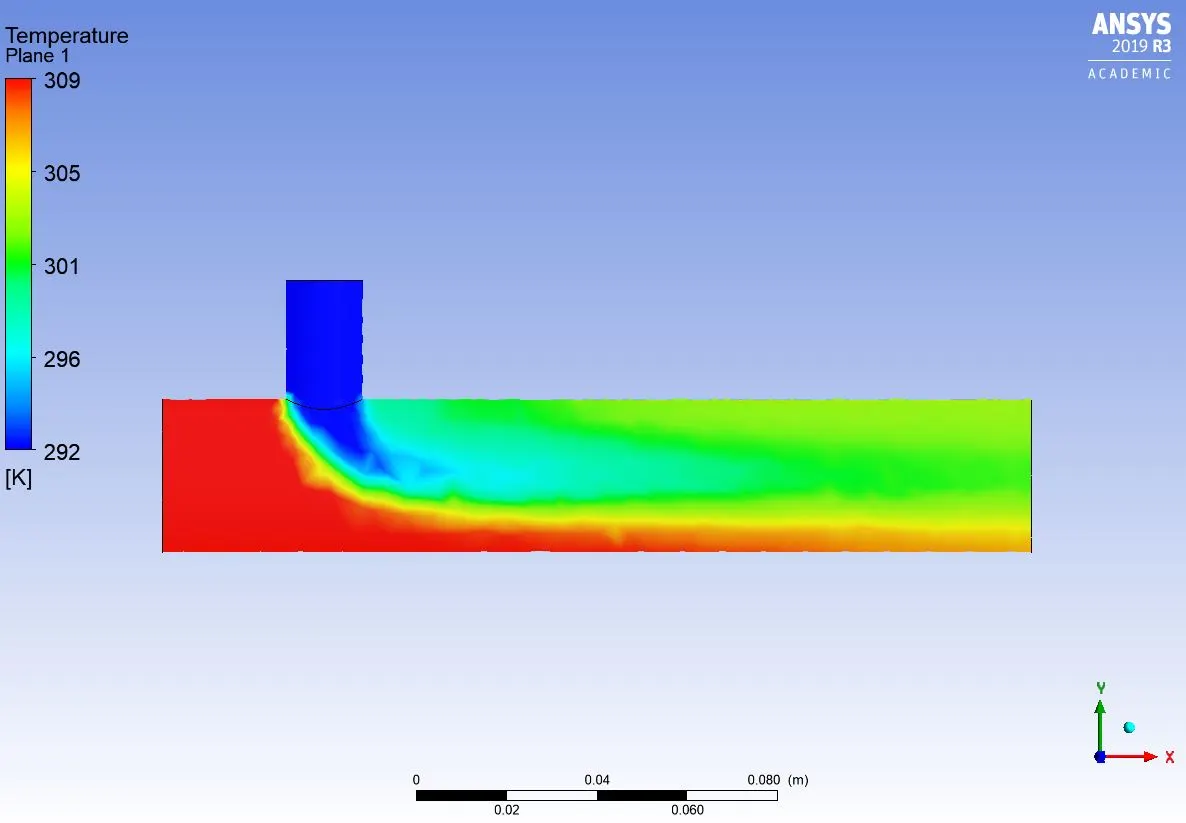
1) Temperature:
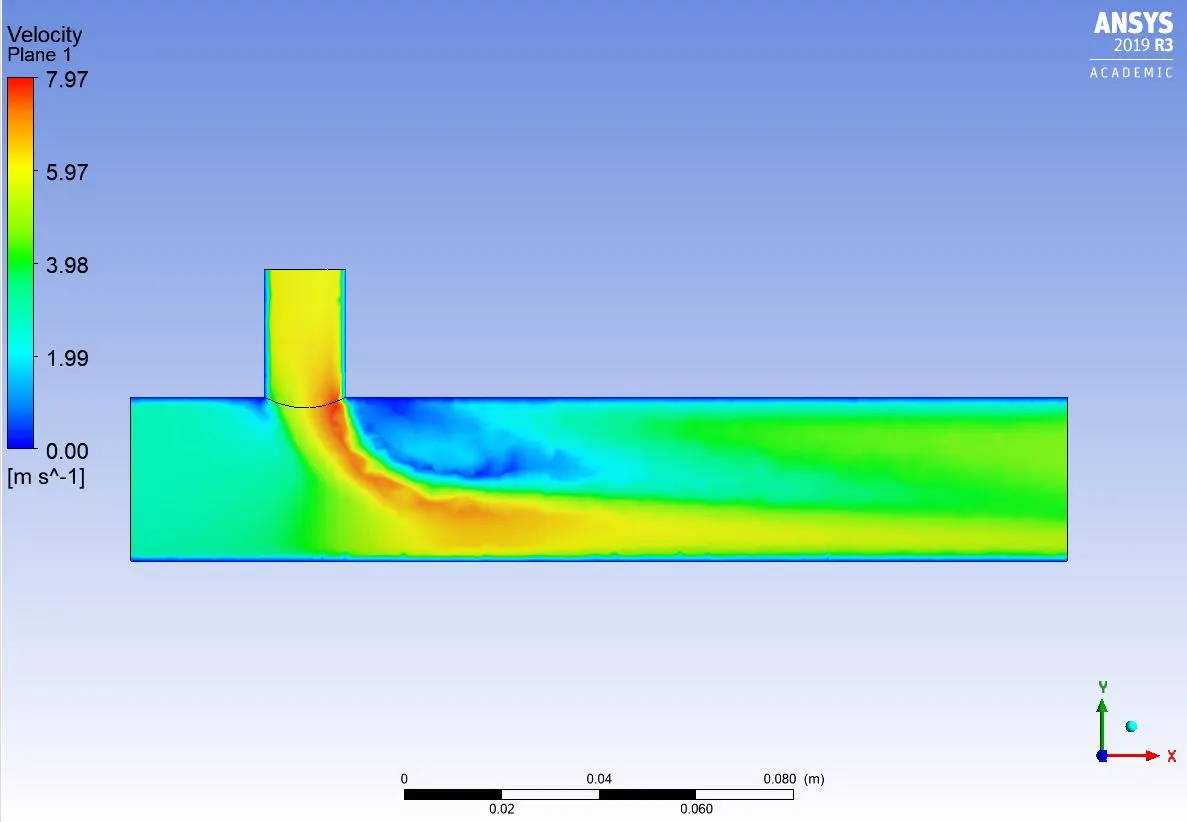
Velocity:
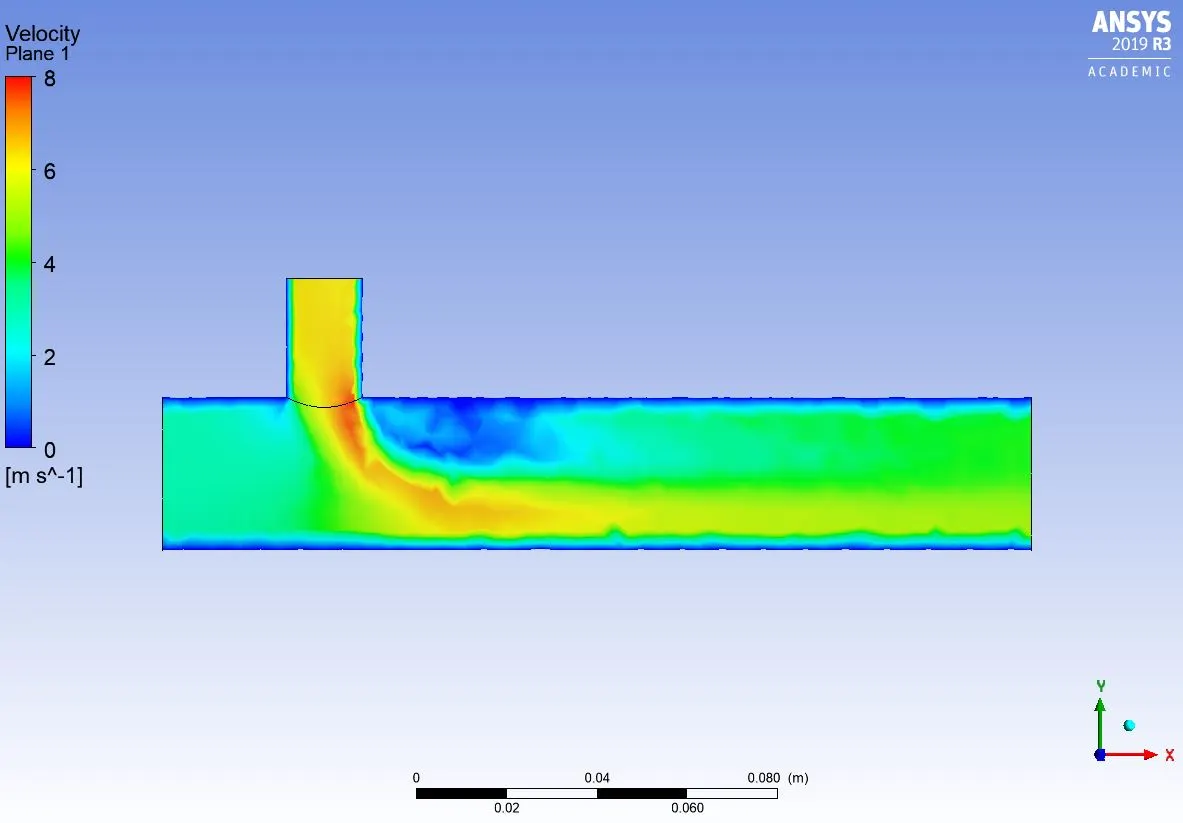
As seen from the above contour pictures, the flow field of air in velocity and temperature is diffused and not adequately picturised due to coarse mesh. The number of elements is 12,760 which is less to capture the physics properly. Therefore, a finer mesh is set up for further simulation.
CASE 1- SHORT TEE
a) For inlet velocity of 3m/s and momentum ratio of 2
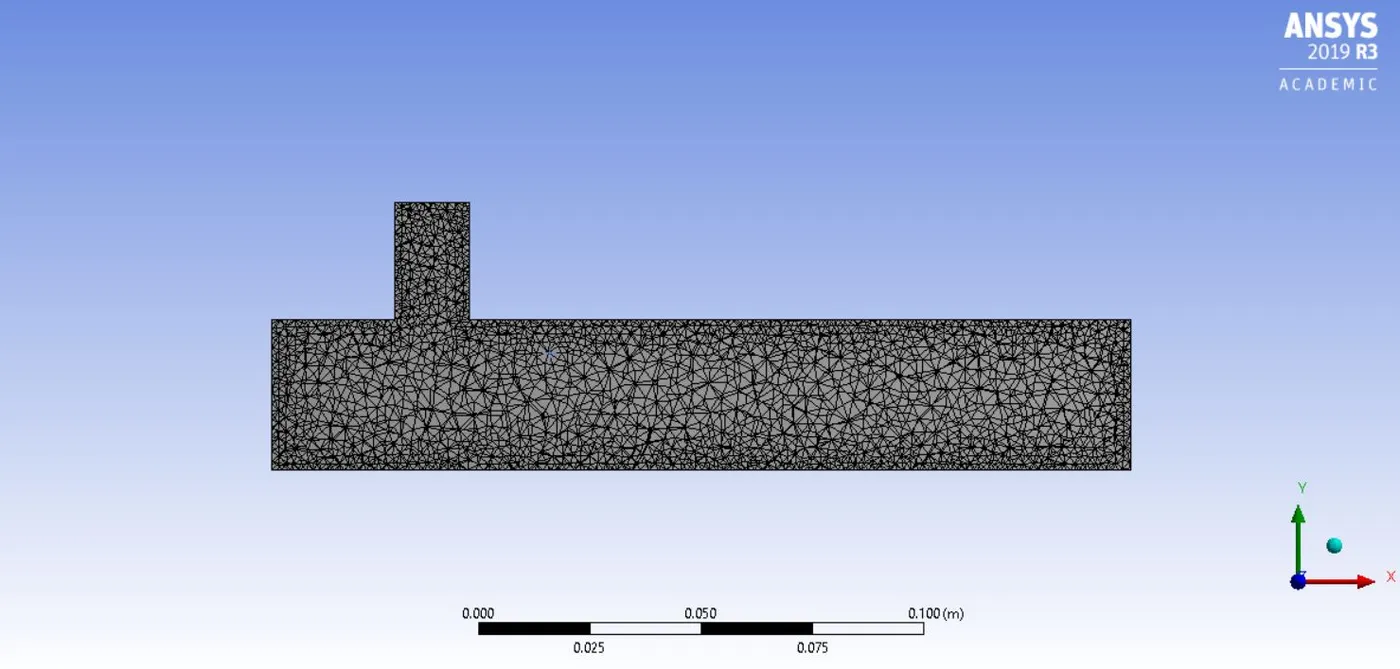
Mesh size- 0.002 m
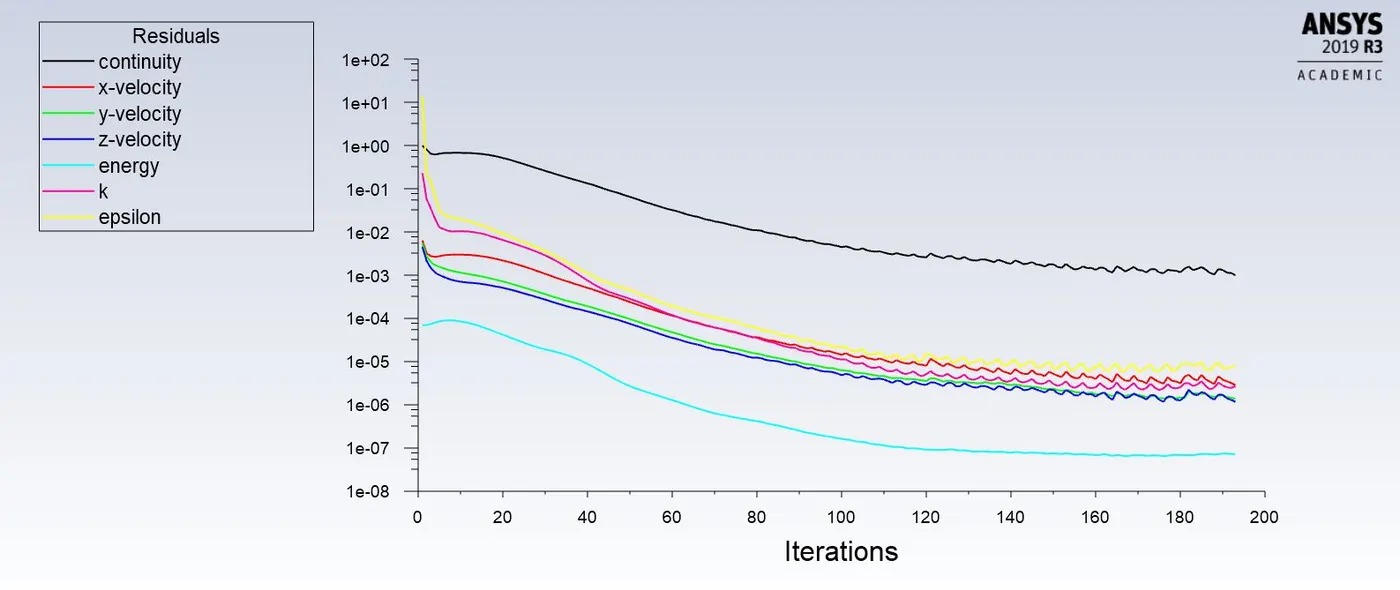
Residual:
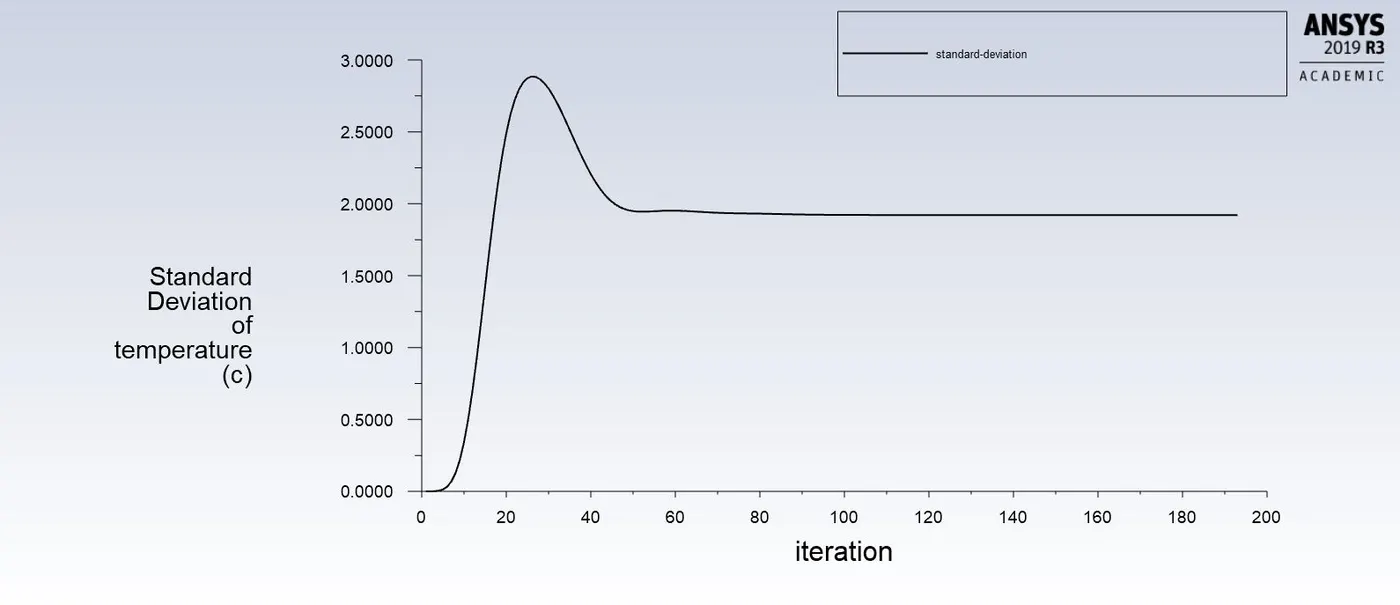
Standard-deviation:
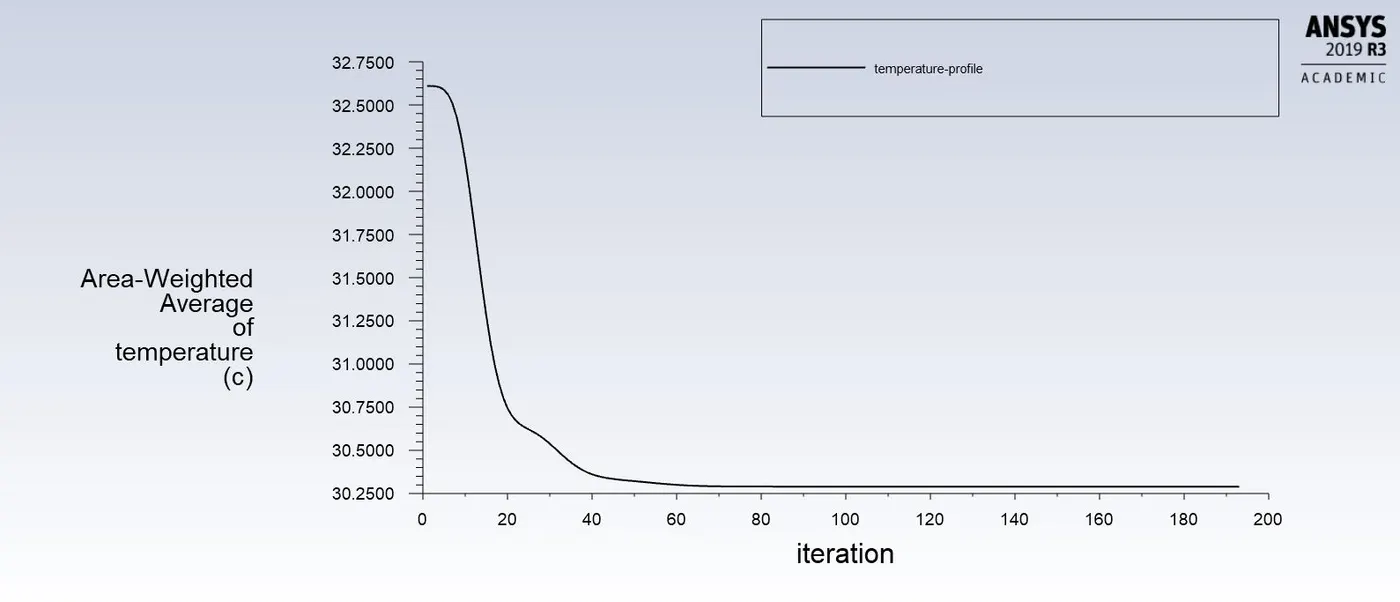
Temperature plot:
Contour-
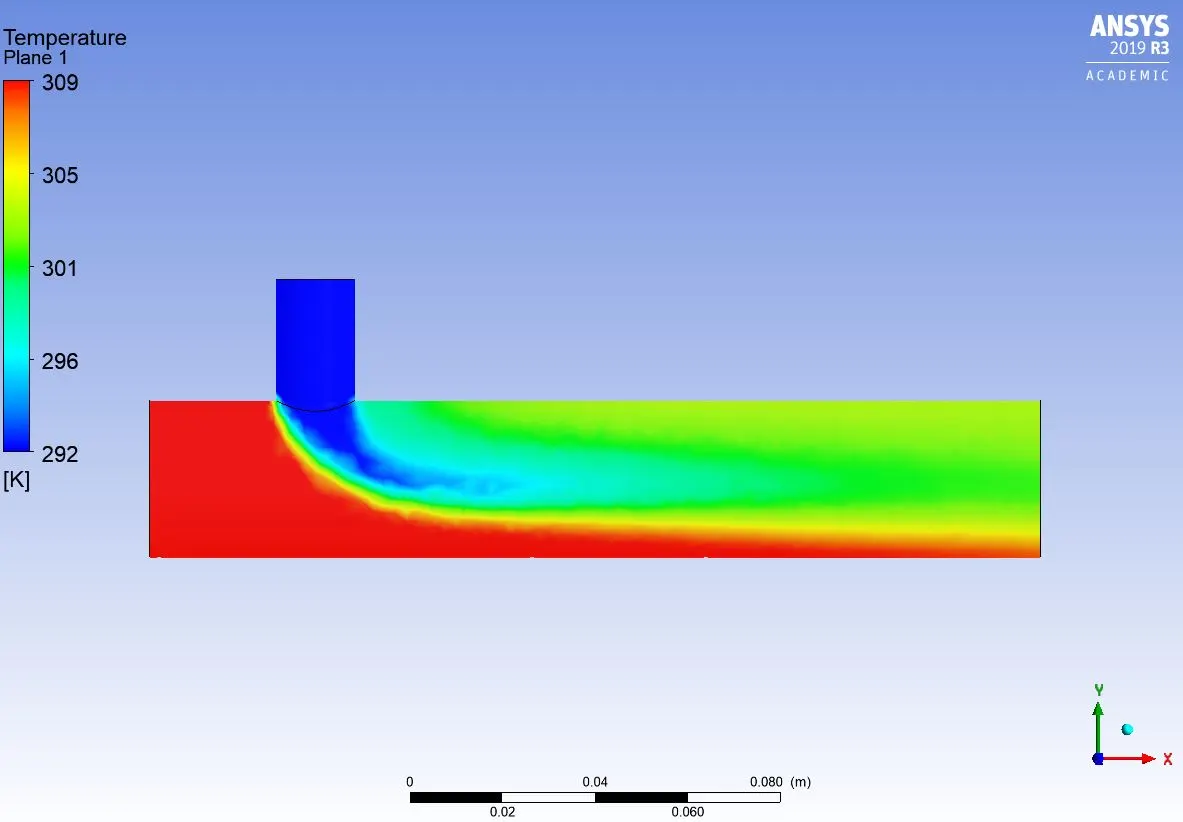
1) Temperature:
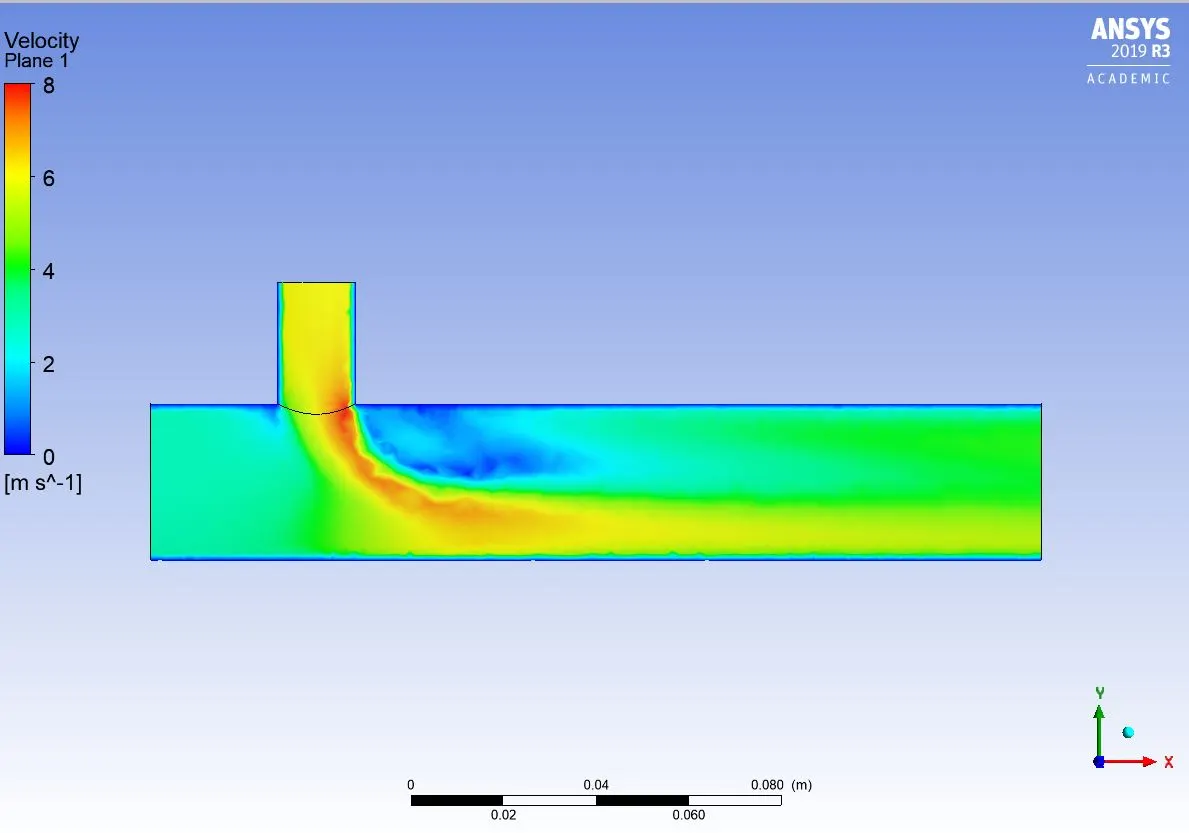
2) Velocity:
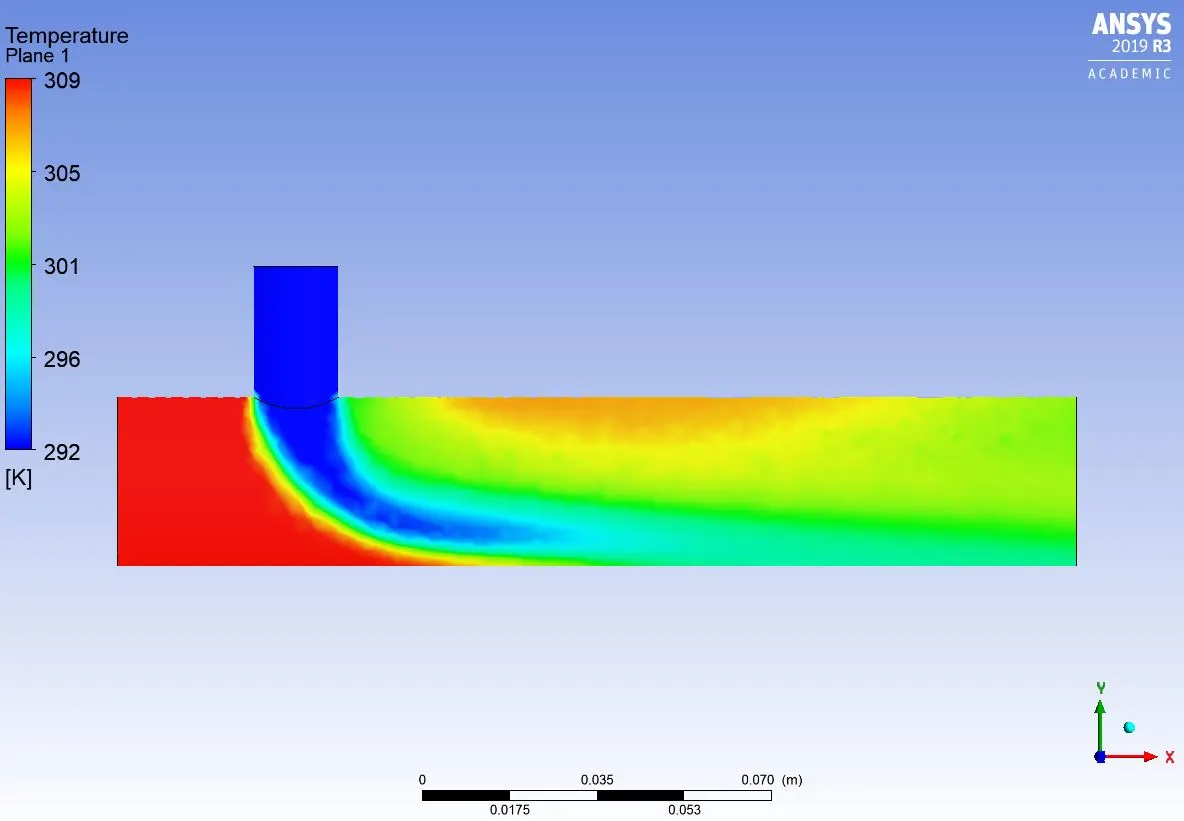
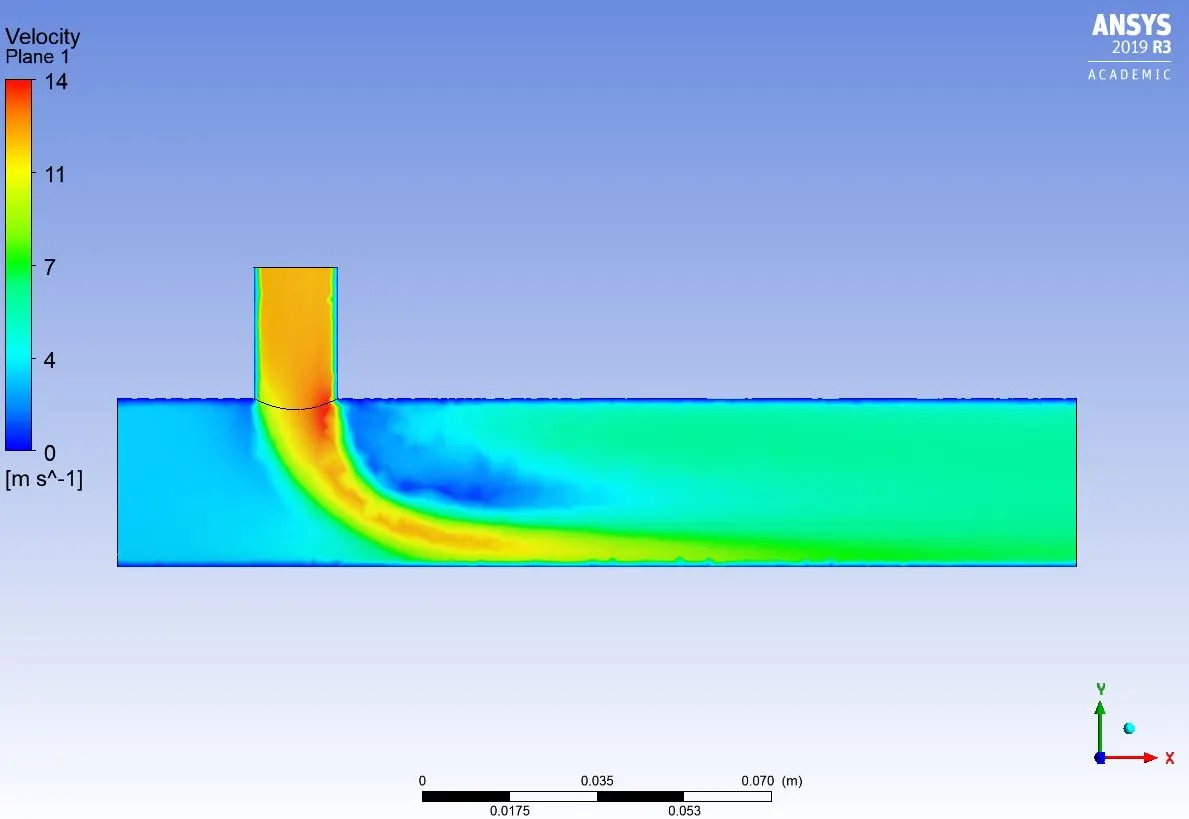
b) For inlet velocity of 3m/s and momentum ratio of 4
Mesh size- 0.002 m
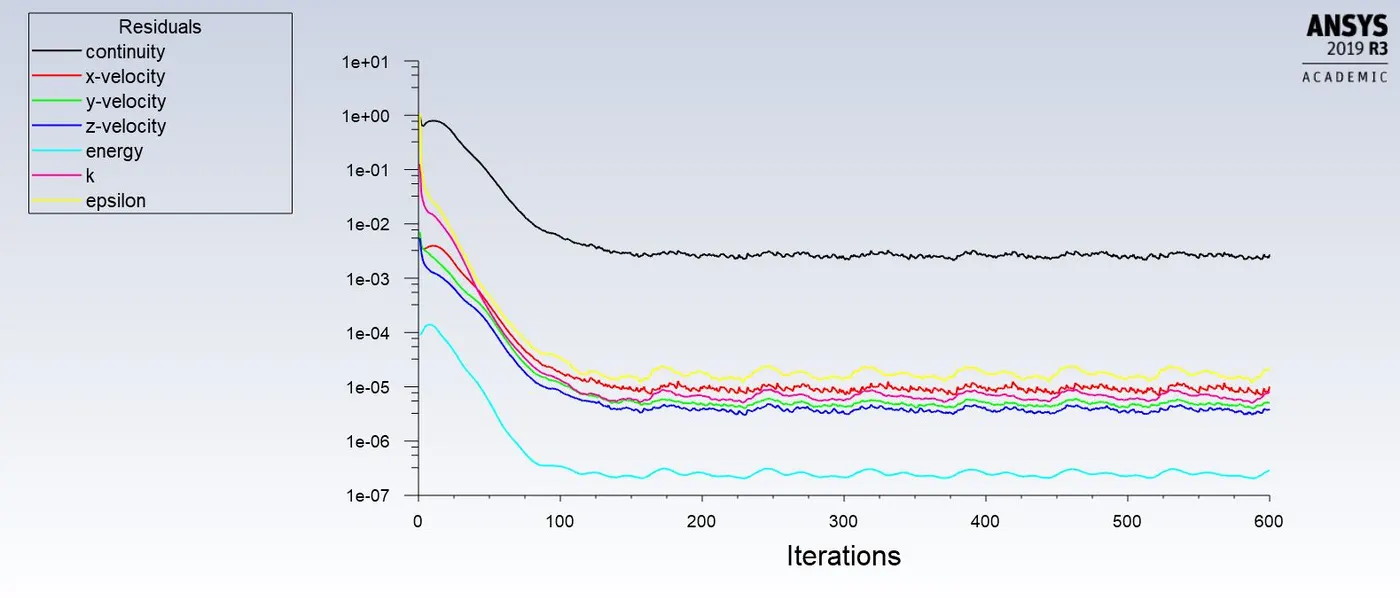
Residual plot:
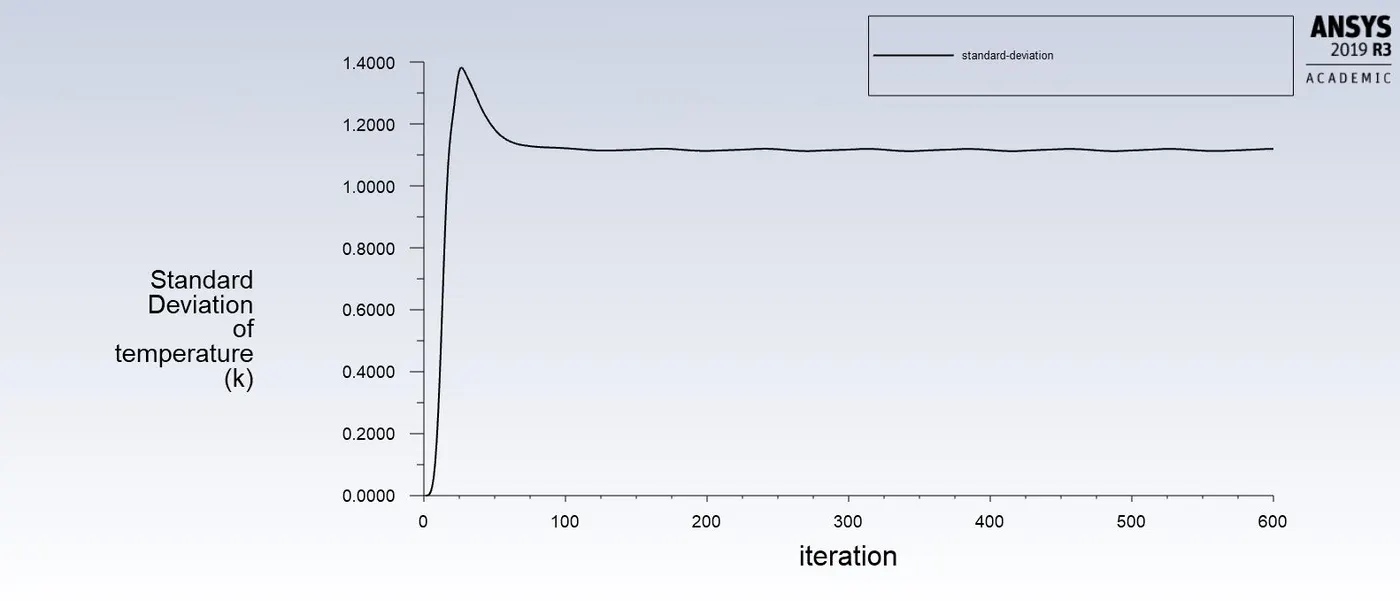
Standard Deviation:
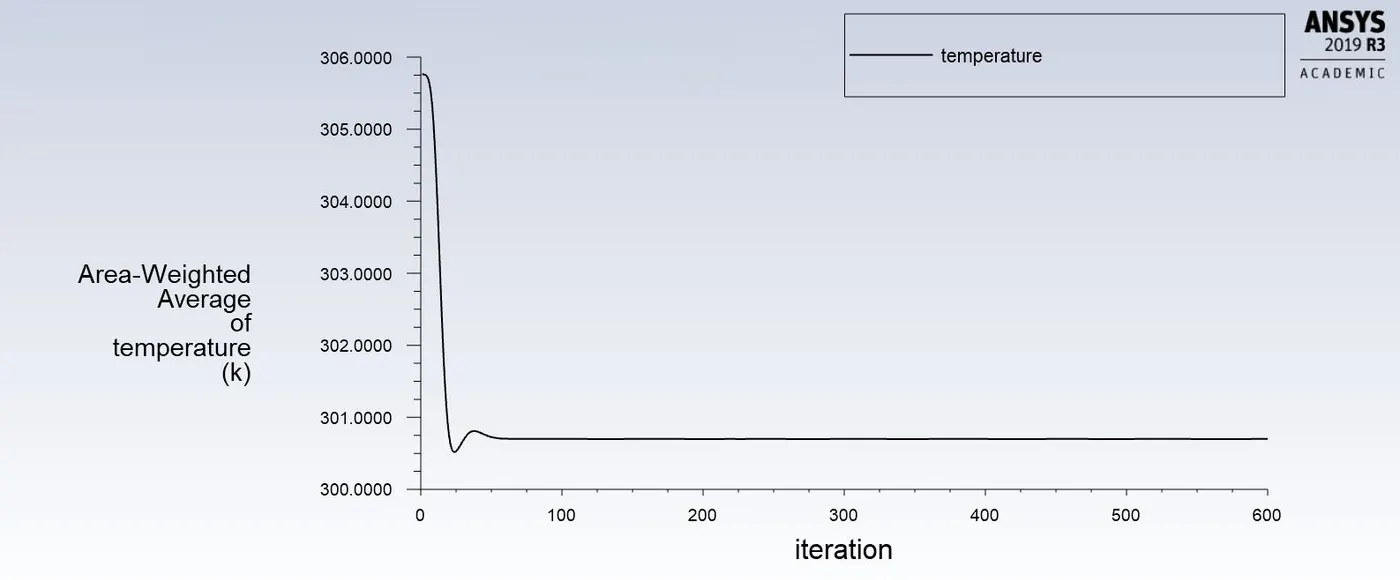
Temperature plot:
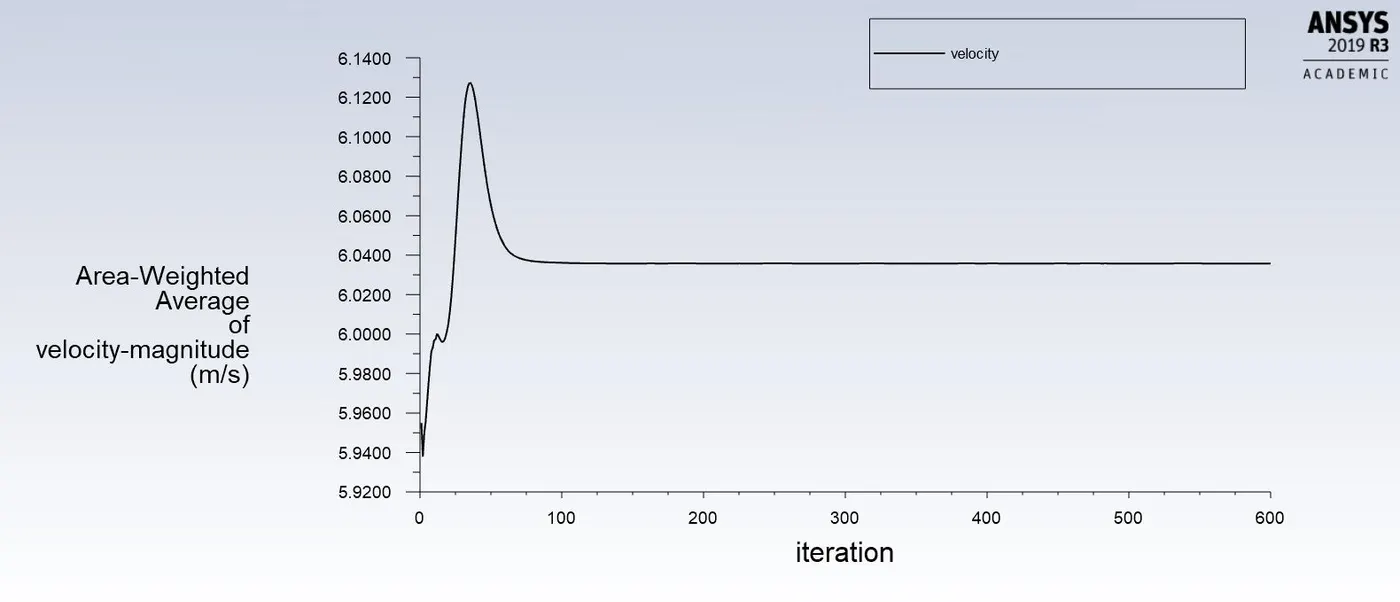
Velocity plot:
Contour-
1) Temperature:
2) Velocity:
CASE 2- LONG TEE
a) For inlet velocity of 3m/s and momentum ratio of 2
Mesh size- 0.002 m
Residual:
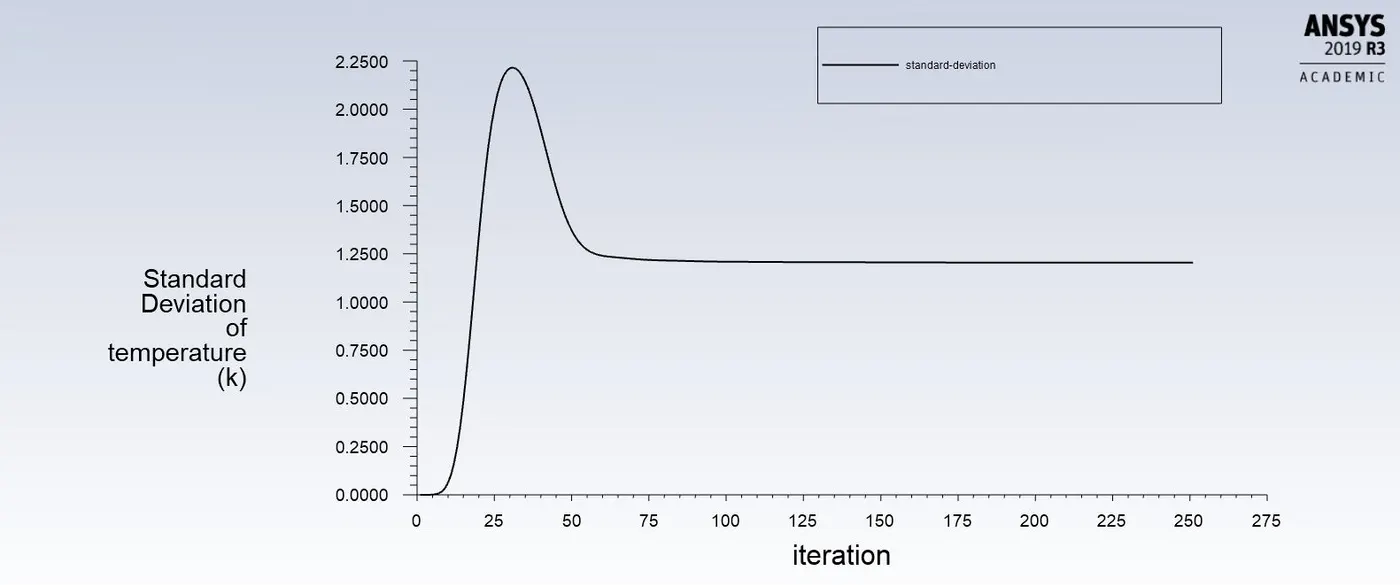
Standard deviation:
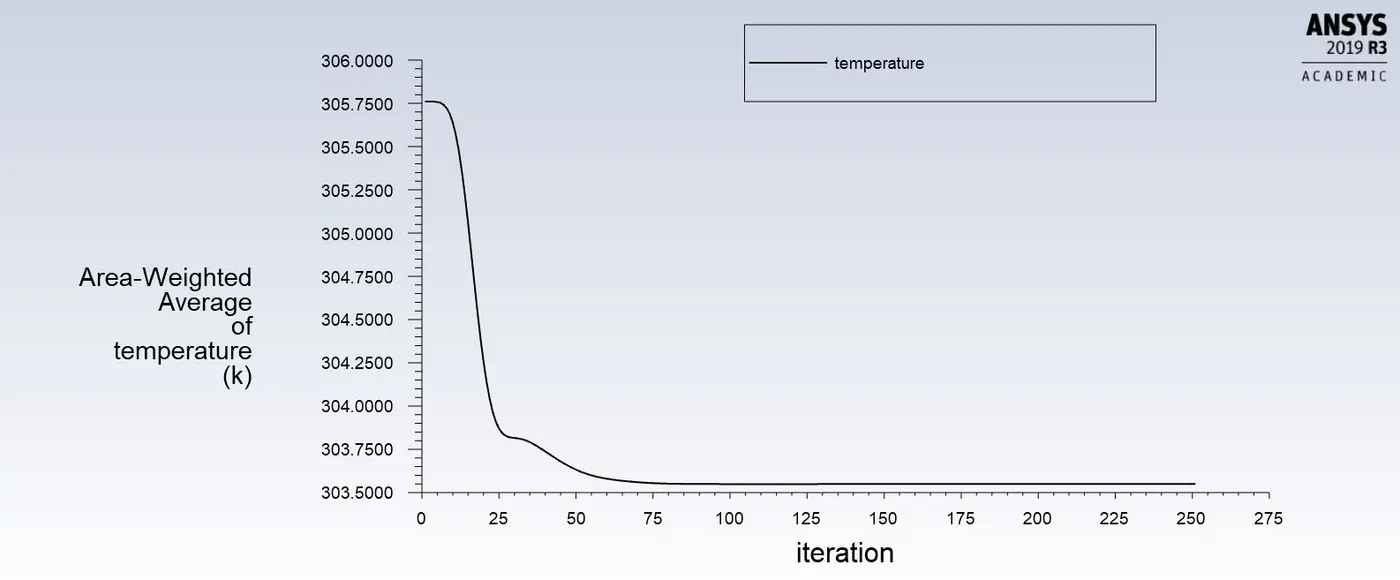
Temperature plot:
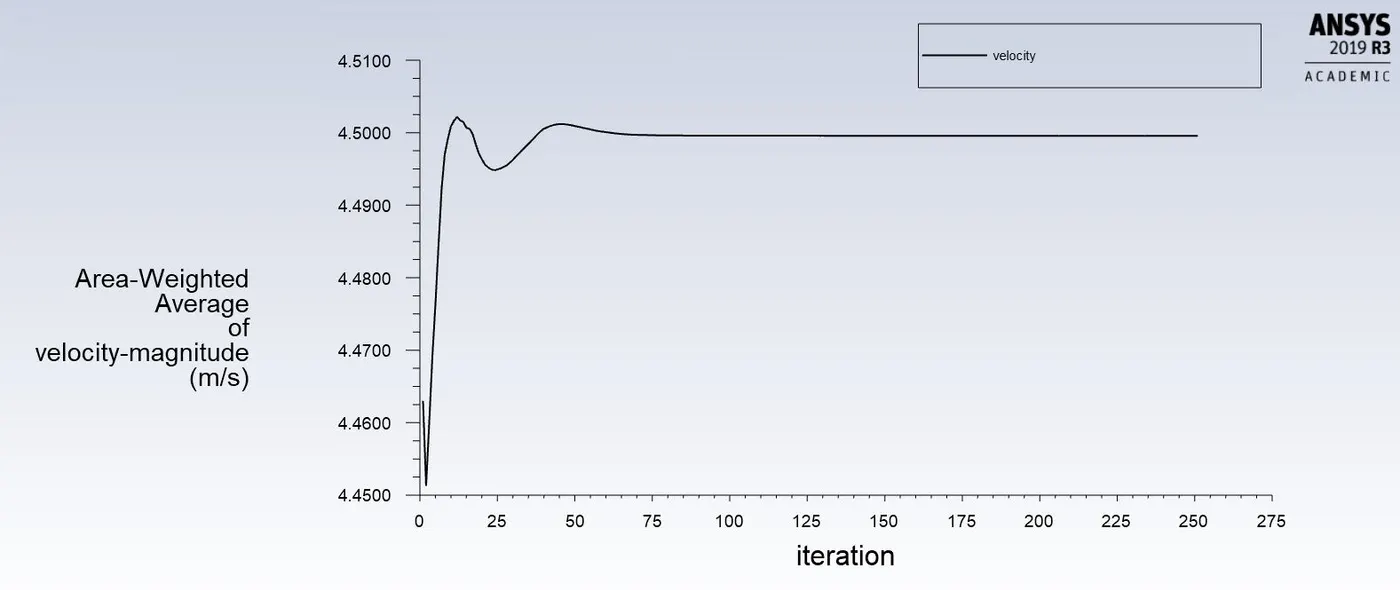
Velocity plot:
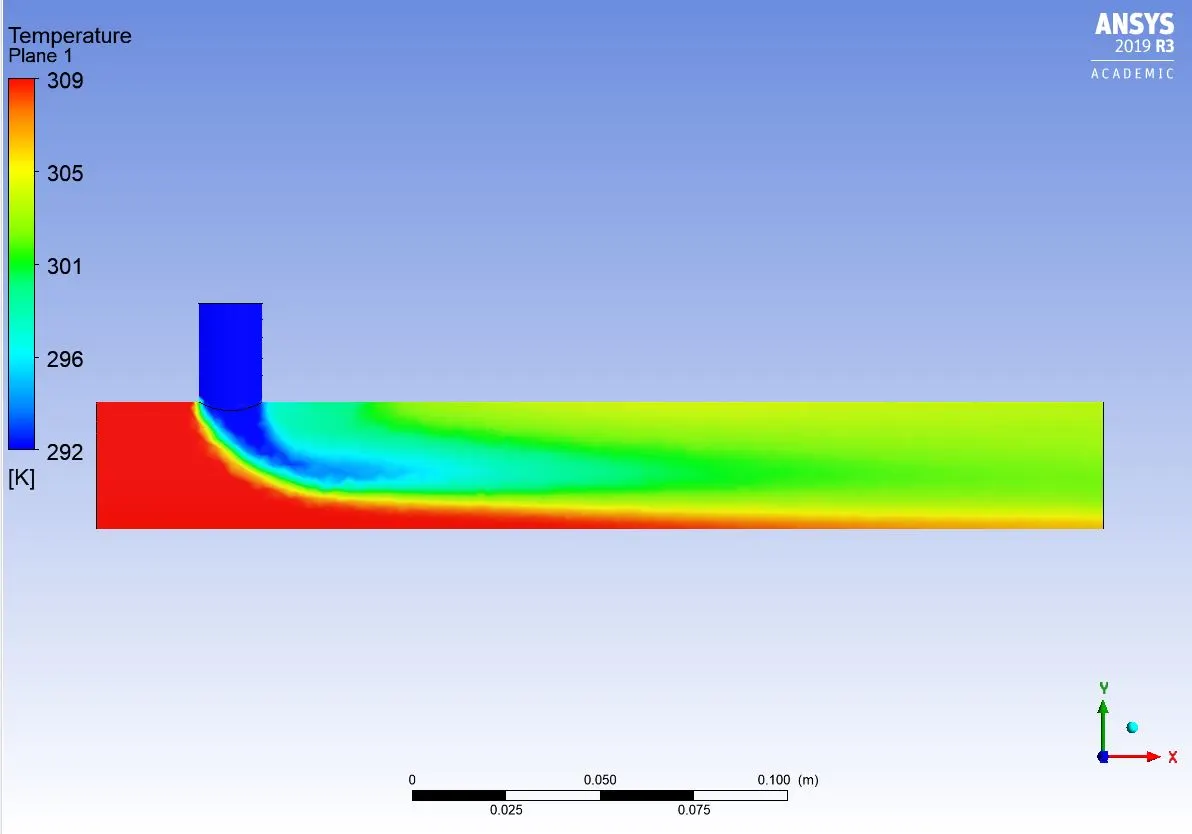
Contour-
1) Temperature:
2) Velocity:
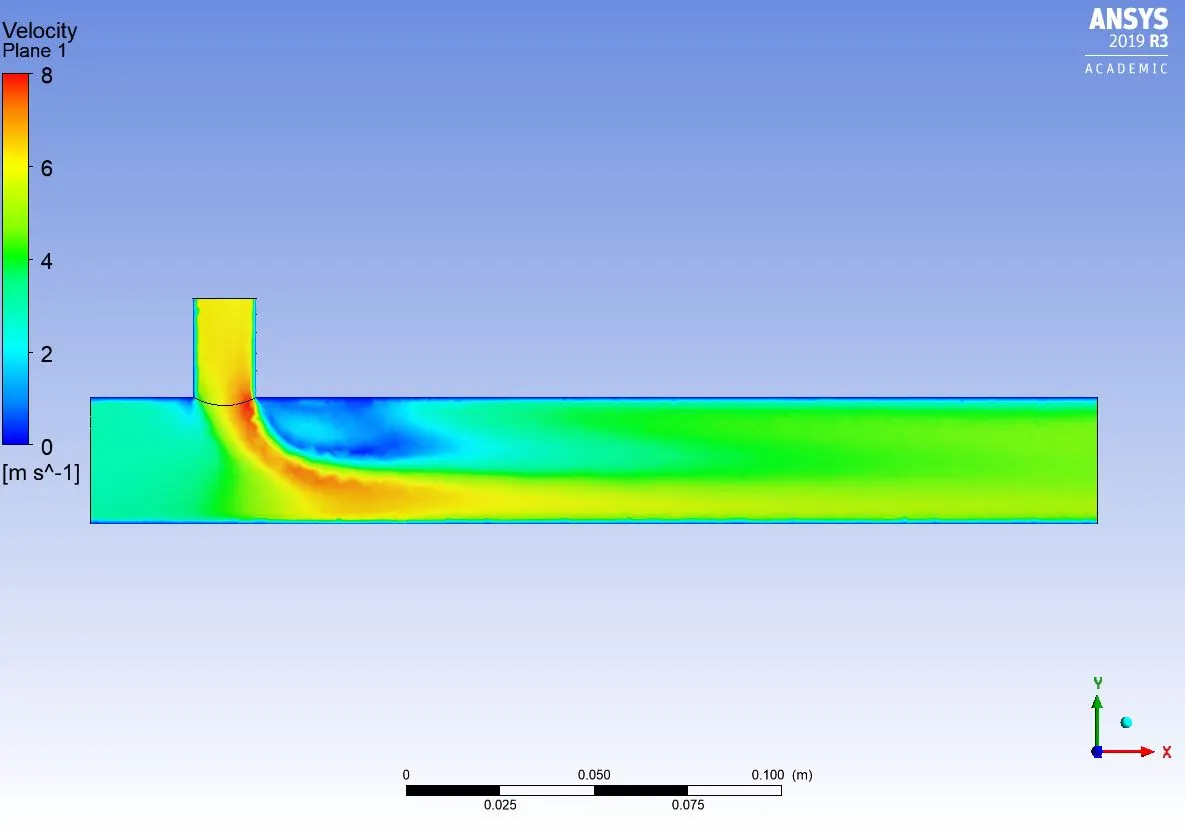
b) For inlet velocity of 3m/s and momentum ratio of 4
Mesh size- 0.002 m
Residual:
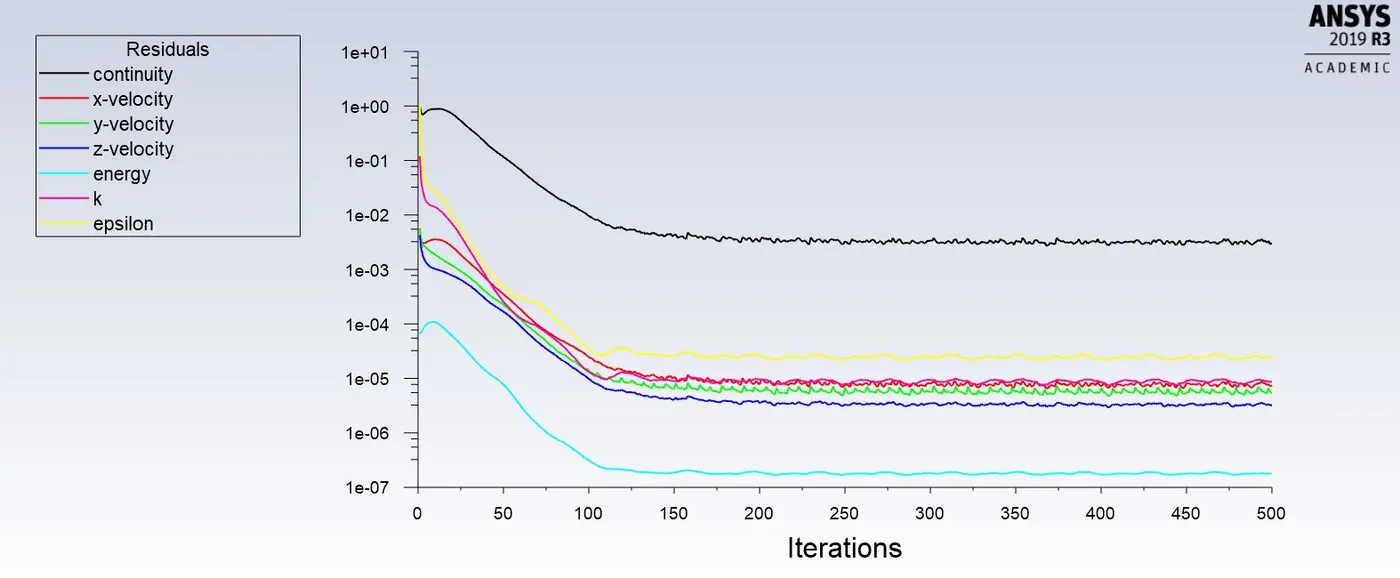
Standard Deviation:
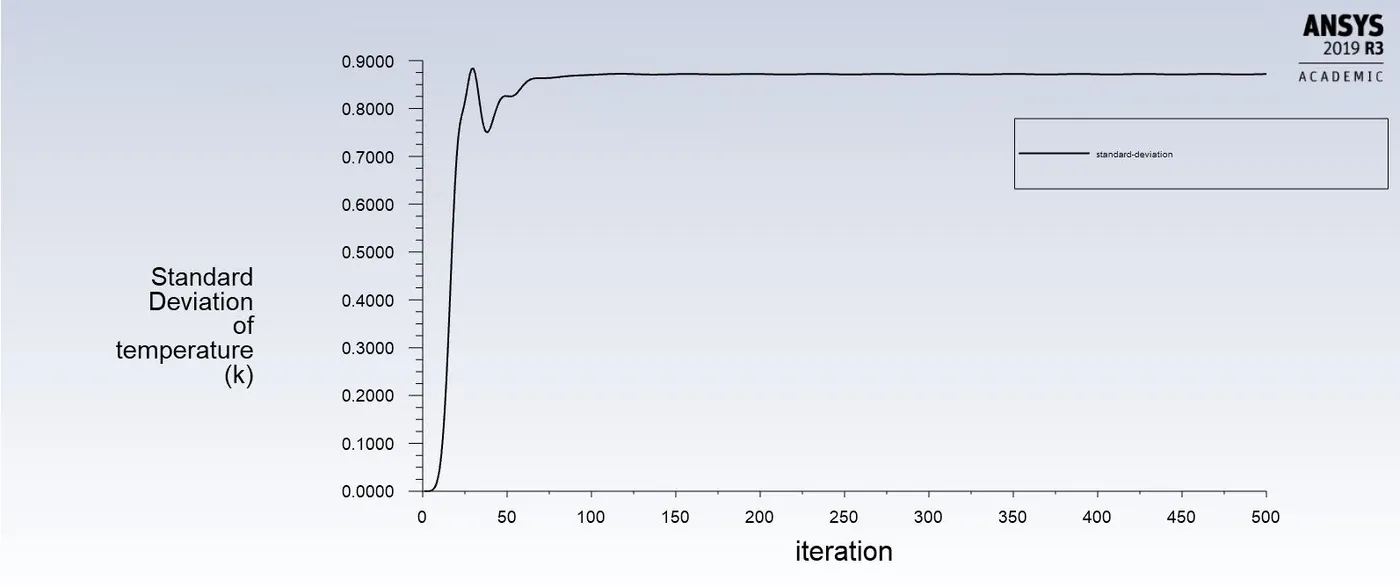
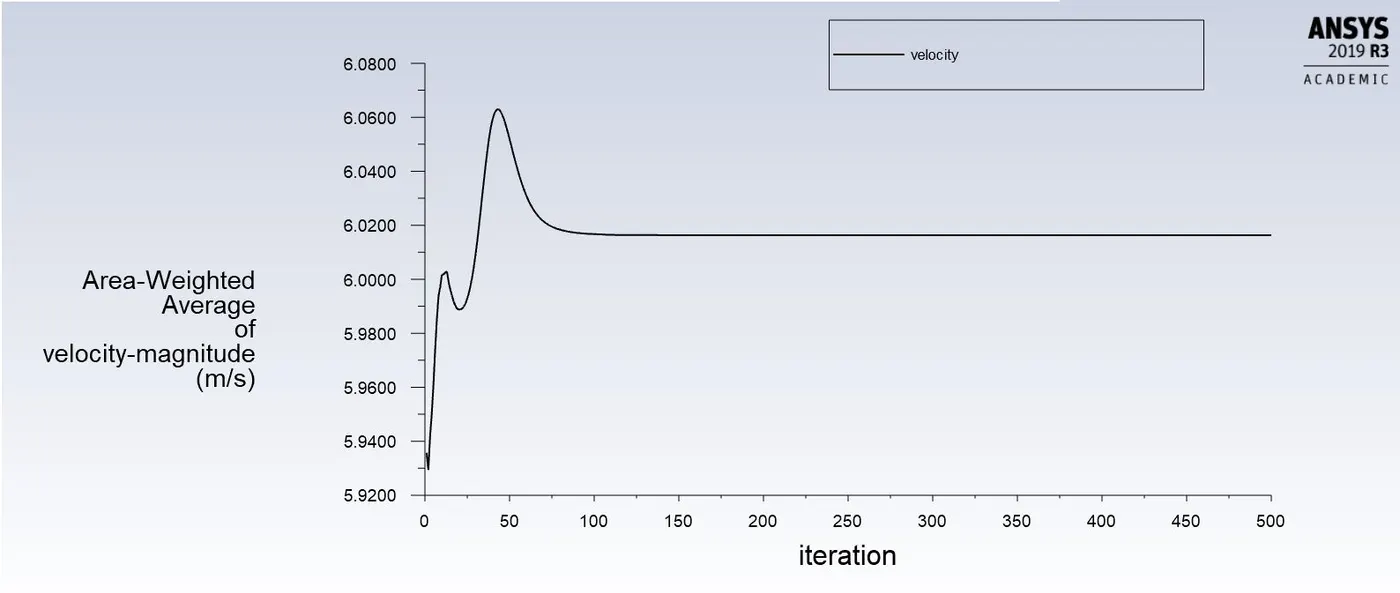
Temperature plot:
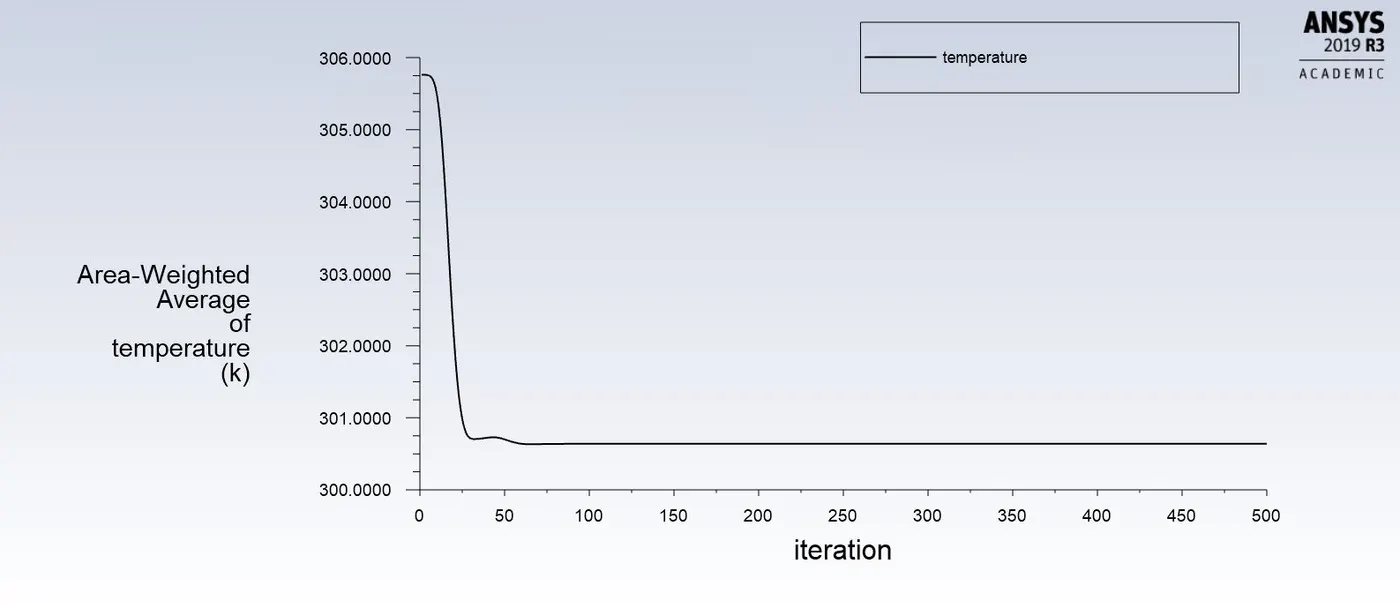
Velocity:
Contour-
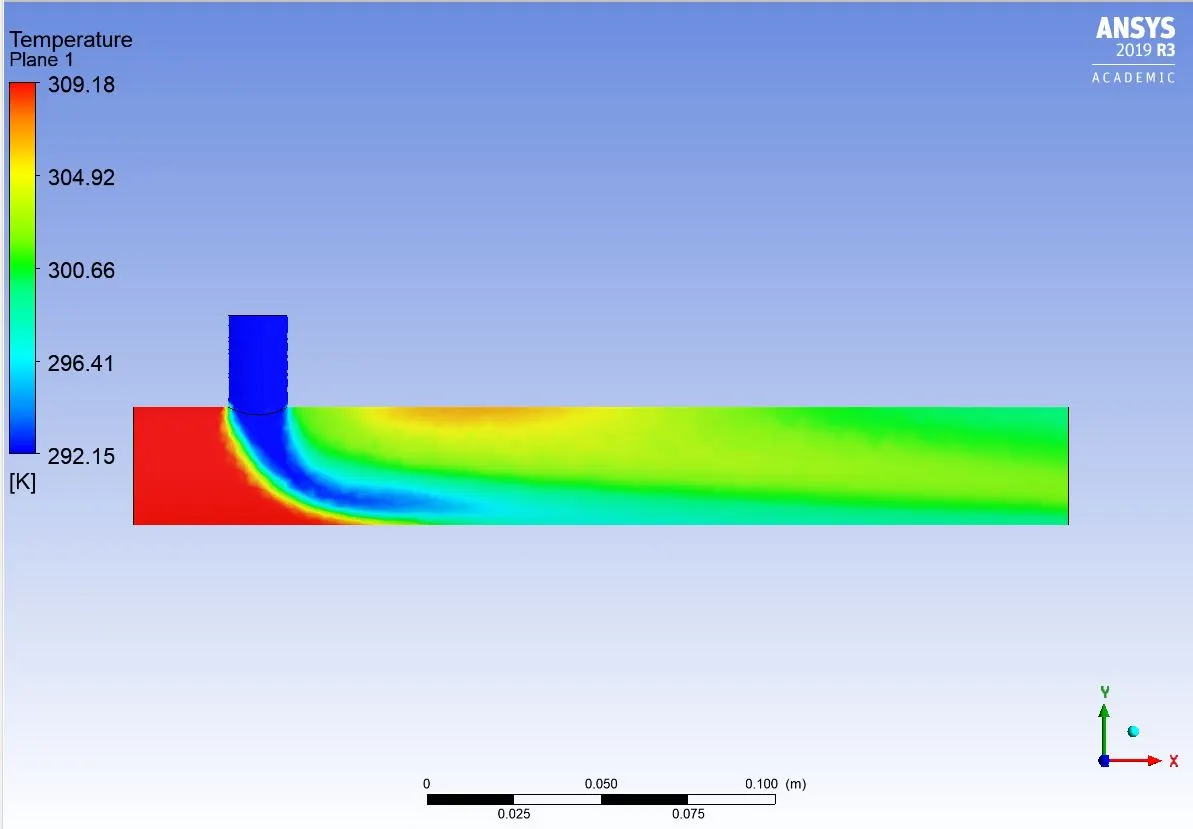
1) Temperature:
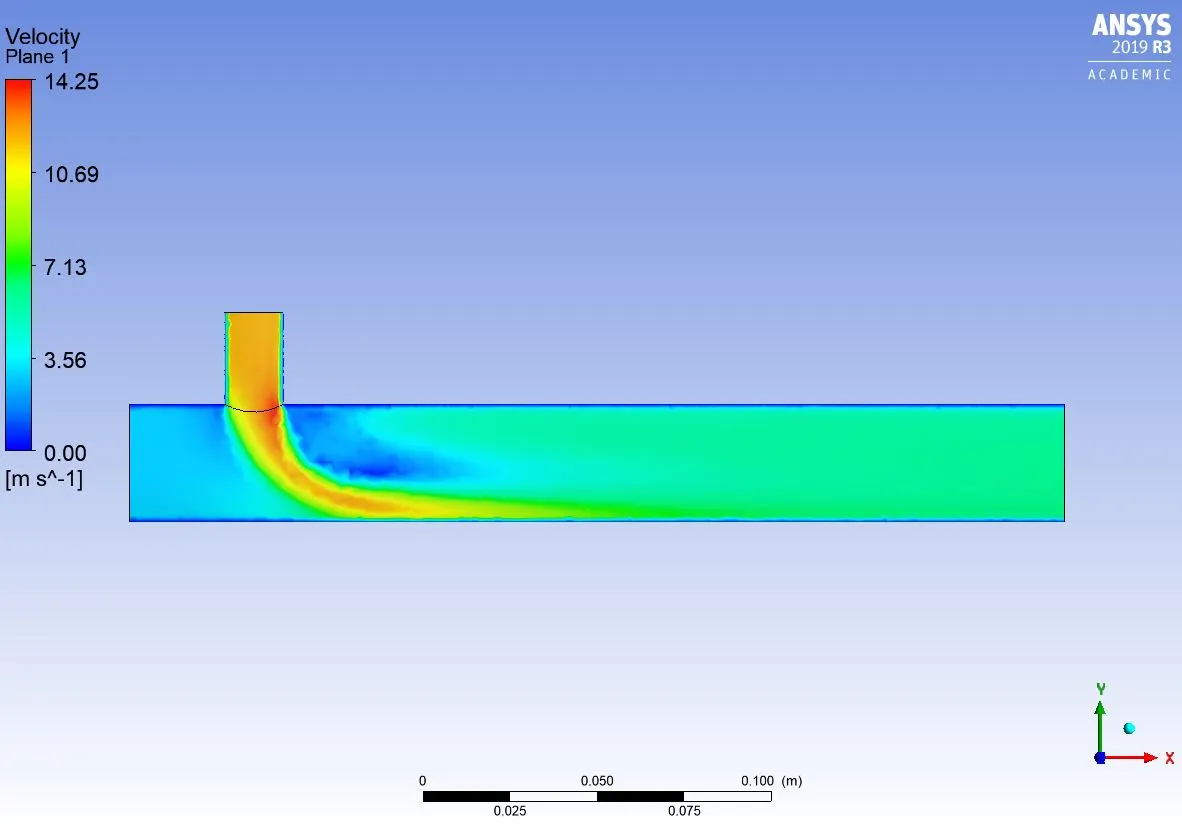
2) Velocity:
Effect of Turbulence model:
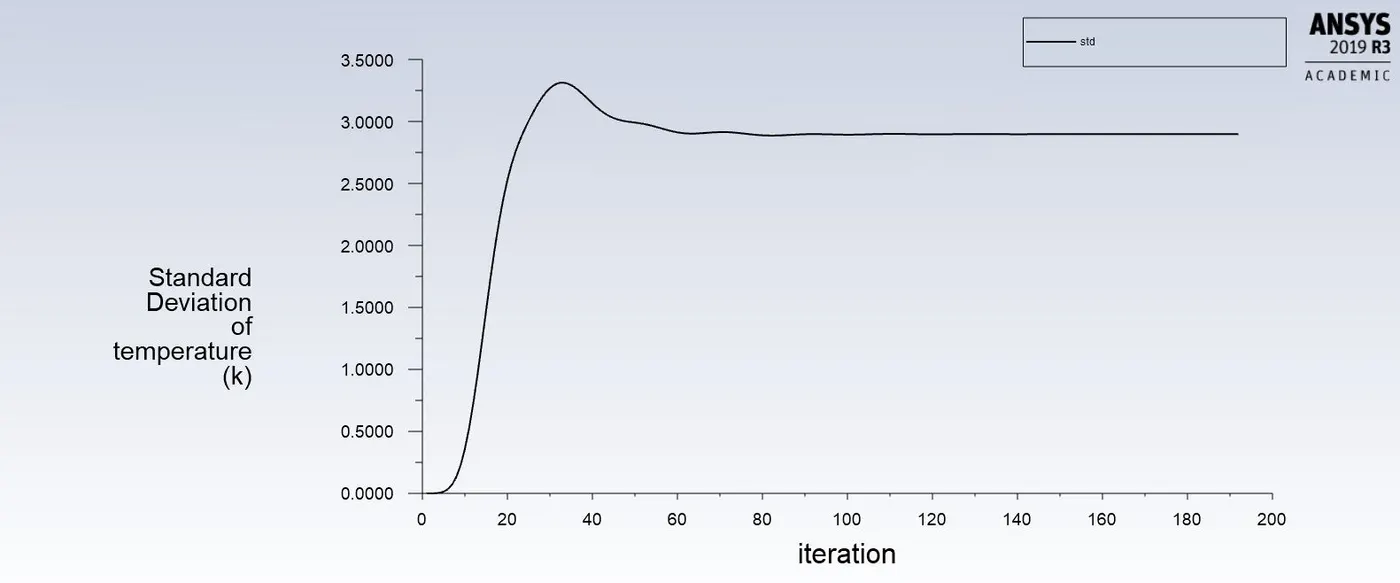
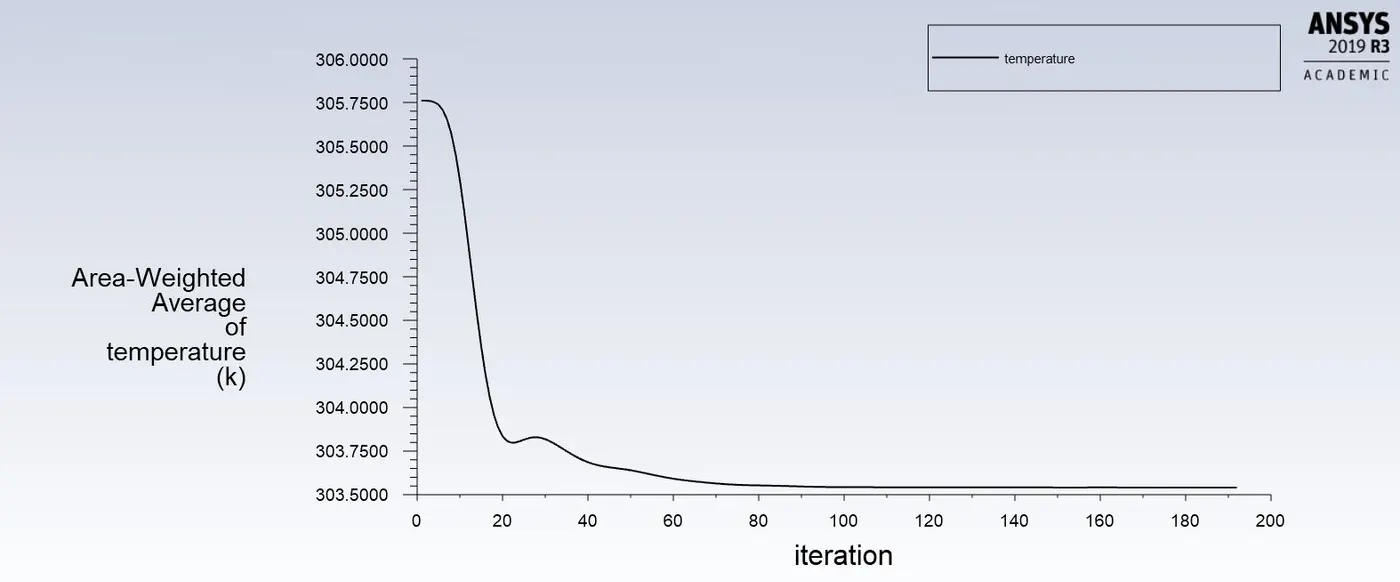
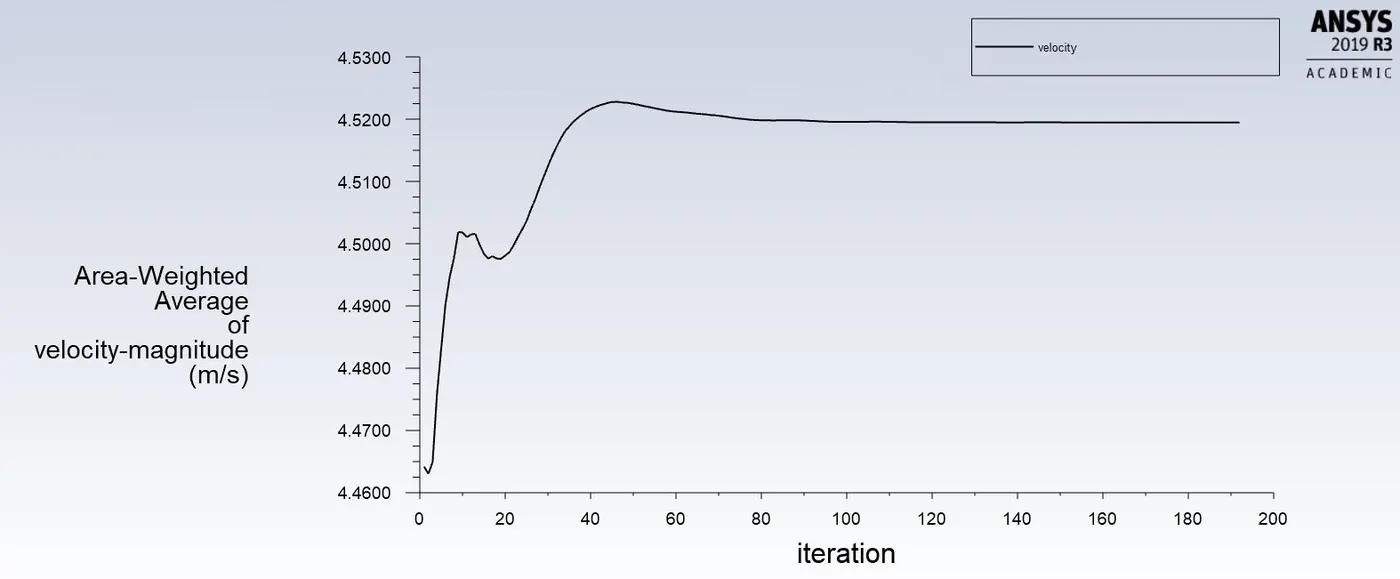
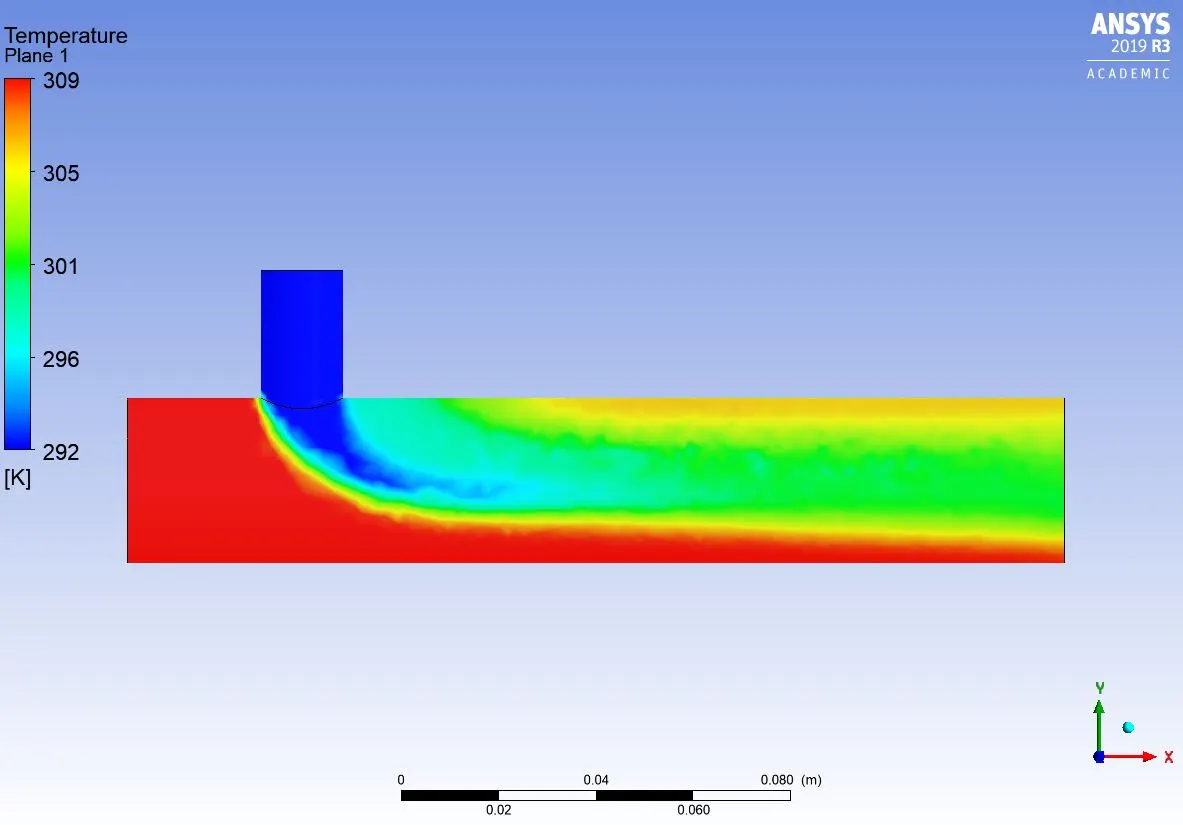
K-ω">ωωSST model used for carrying out this experiment is Short TEE. Mesh remains the same as the Short tee mesh picture is visualized. The inlet velocity is 3 m/s and momentum ration is 2.
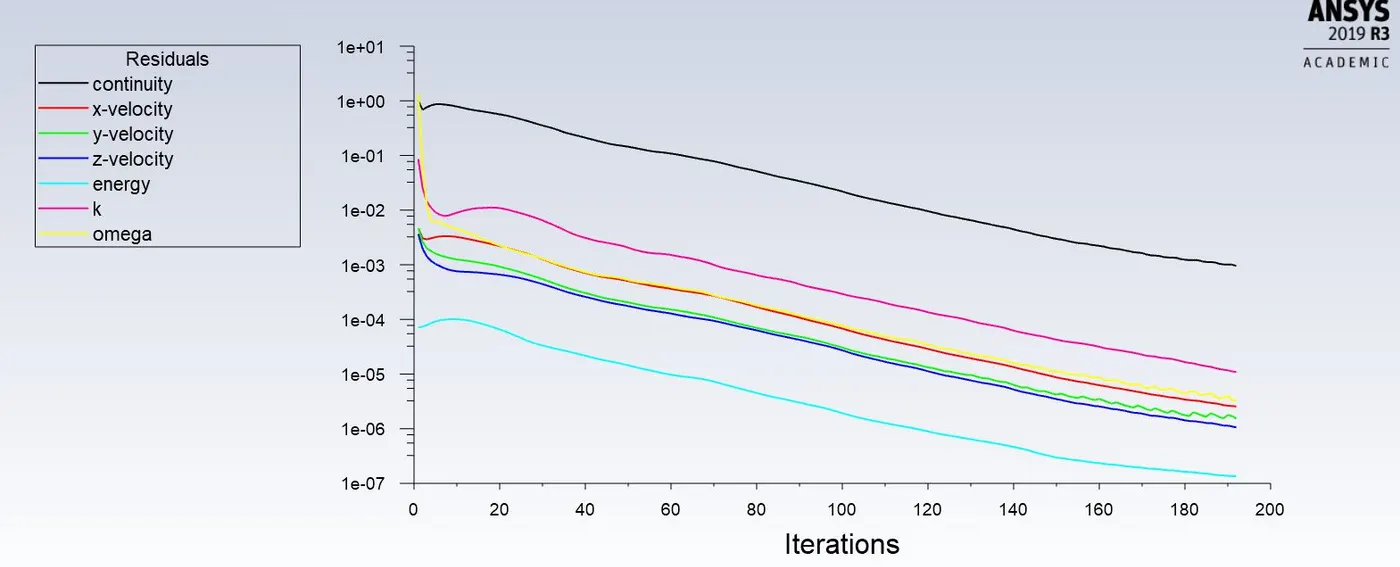
Residual:
Standard Deviation:
Temperature Plot:
Velocity plot:
Contour-
1) Temperature:
2) Velocity:
Comparison of all cases:
| Case | Cell count | Number of iterations for convergence |
| Short tee- Momentum ration 2 | 1,05,751 | 200 |
| Short tee- Momentum ration 4 | 1,05,751 | 250 |
| Long tee- Momentum ration 2 | 1,40,510 | 250 |
| Long tee- Momentum ration 4 | 1,40,510 | 250 |
CONCLUSION:
- As seen in the Case-1-a and Case-1-b, the temperature at the outlet drops down significantly due to high velocity of cold air from the inlet. This is possible due to the turbulent mixing at the tee joint between hot air and cold air because of the high velocity of cold air., which is not possible in case of low-velocity cold air.
- The temperature contour at the outlet for short tee cases shows that some of the high temperatures flow sips through without properly mixing with the flow. Whereas, in the temperature contour of long tee cases, the high temperatures flow thoroughly mixes with the rest of the flow.
- Therefore, we can recommend using the long tee and high-velocity inlet for application. This is because we have a low standard deviation in case of long tee compared to the short tee for both momentum ratios.
- k- epsilon model predicts well far from the boundaries (wall) and k- omega model predicts well near the wall. Even though it depends on Y+. Therefore, K-epsilon model is majorly used for free flow away from the wall and as in this project, there is no dealing with the wall of the mixing tee for change in temperature along the length of it, so K-epsilon model was chosen for further simulations.
REFERENCES:
https://www.sciencedirect.com/science/article/pii/S0029549309005676