Week 1- Mixing Tee
Aim:
- To conduct a mixing Tee simultaion through following cases
- Case 1
- Short mixing tee with a hot inlet velocity of 3m/s.
- Momentum ratio of 2, 4.
- Case 2
- Long mixing tee with a hot inlet velocity of 3m/s.
- Momentum ratio of 2, 4.
- Further comparison of following values from two cases (through table)
- Cell count
- Avarage outlet temperature
- Number of Iteration for convergance
Expected results:
- Velocity and temperature contour plots on the cut planes along and across the pipe.
- Velocity and temperature line plots along and across the length of the pipe.
- Perform Mesh independent study for any one case.
- Discuss the effect of length and momentum ratio on results.
Introduction
Mixing tees are widely used in the petrochemical industry, in which two fluid streams with different physical and/or chemical properties mix together. When there is a large temperature difference between the two streams, large metal temperature fluctuations can occur in the region where the two streams meet if proper design steps are not taken. The temperature fluctuations in the metal may lead to thermal fatigue of the pressure boundary piping. If through-wall cracking occurs, the fluid may leak, possibly causing a fire and damage. It is therefore imperative to make sure that the temperature fluctuations are such that the piping system can withstand them. Options can include improving the mixing of the two streams to reduce the temperature fluctuations through redesign of the piping system such that the momentum ratio of the two fluid streams is favorable to rapid mixing, or to install devices that protect the pressure boundary piping.
A tee junction simulation is used here to evalute the change in temparature by mixing same fluid at different temparatures and with different inlet velocities through two inlet pipe which are perpendicular to each other.The simulation is done in two cases, for each cases only geometry varies (one is shorter than the other).Also for each cases we will be simulating for momentum ratio of 2 and 4.
The workflow in Ansys fluent is as follows
Gemoetry -> Mesh -> Setup -> Solution -> Results
Given datas
Hot inlet temperature = 36 + 273 k
Cold inlet temperature = 19 + 273 k
Hot inlet velocity = 3 m/s
For momentum ratio 2
since, Mometnum ratio = Velocity of cold inlet / Velocity of hot inlet
Therefore,
Velocity of cold inlet = 6 m/s
For momentum ratio 4
Velocity of cold inlet = 12 m/s
Avarage mixing temperatures
`T_(mix)=(m_(hot)T_(hot)+m_(cold)T_(cold))/(m_(hot)+m_(cold))`
`m_(hot) = rho * volume`= rho * area * velocity = 1.297 * 0.0009 * 3 = 0.0035019`kg/s
`m_(cold) = (1.324 )* (0.0009 )* (6) = 0.0071496`kg/s
For momentum ratio = 2,
Tmix = 24.589 c
Geometry
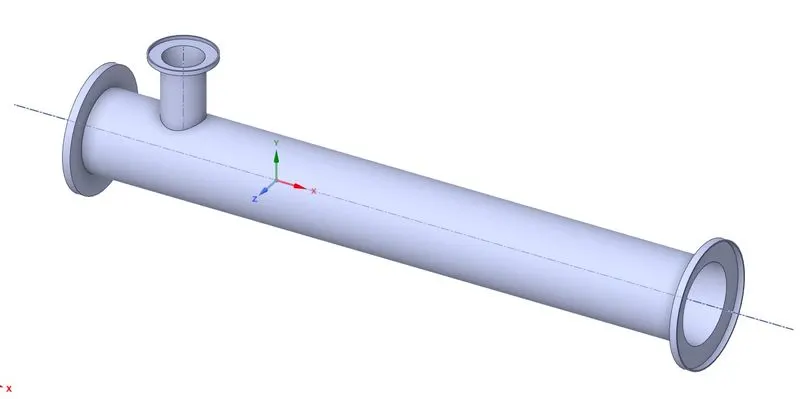
- Here we only consider the volume where flow takes place , hence we suppress the unwanted parts for physics using spaceclaim
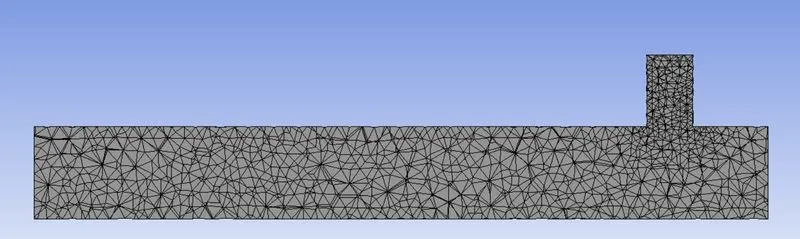
Mesh
Setup and Solution
- Here we setup boundary conditions and initial condition which is then used to calculate the other points as well.
- In physics menu since we are solving for temparature the energy equation should be selected
- The viscous model is changed to k-epsilon
- For the material part the fluid is defined as air
- After that the boundary conditions are setup in the same menu in Cell boundaries, Here in each case the velocity of cold inlet changes and other parametres like temperature is also added
- After that the initilisation is done in Solution menu
- Number of iteration is defined
- Then calculation is done
Mesh independency study
A mesh independence (or grid independence) study is something an analyst can perform to determine the dependence of the results on the mesh density.
Here we have used Short pipe of Momentum ratio 2 for the study
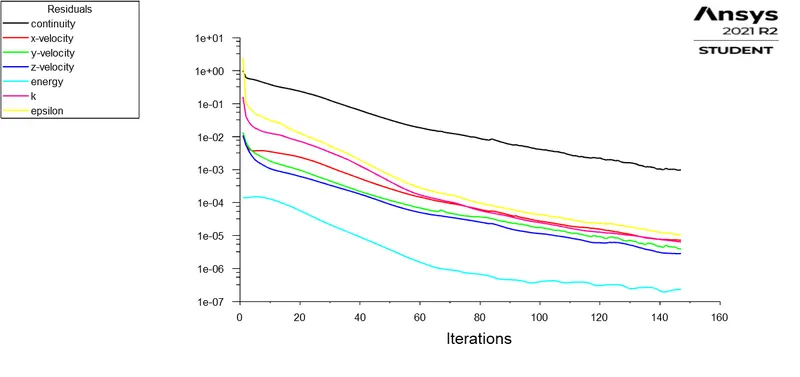
Scaled Residuals of Default meshing
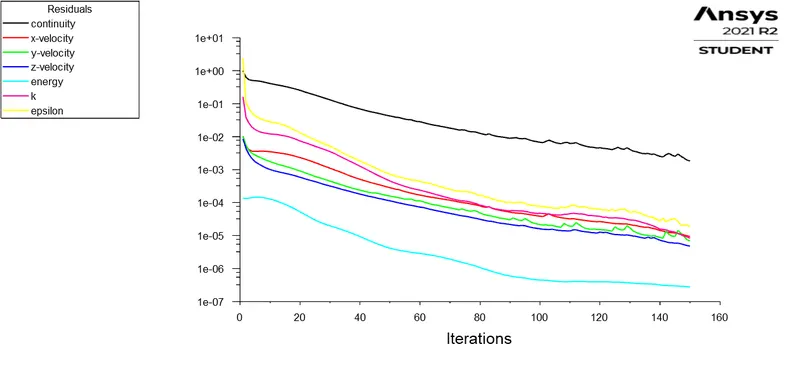
Scaled Residuals of Fine meshing(0.005)
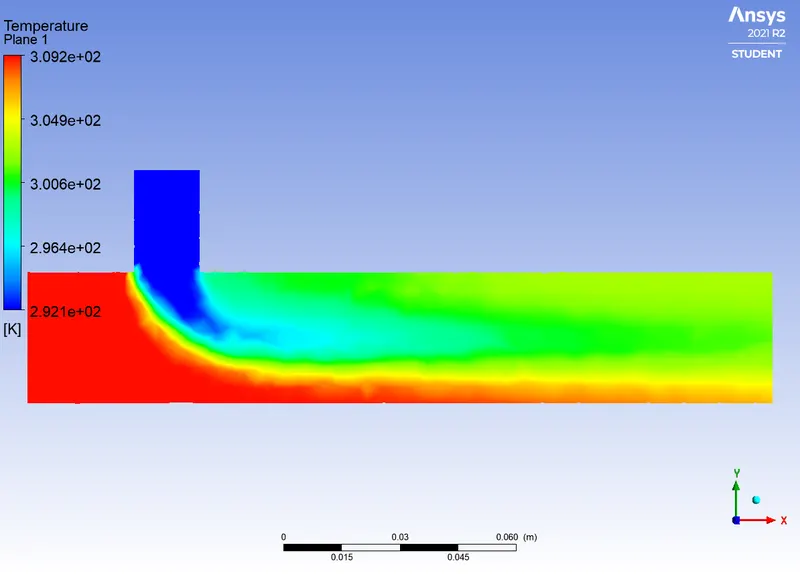
Temperature contour along pipe(mesh size Default)
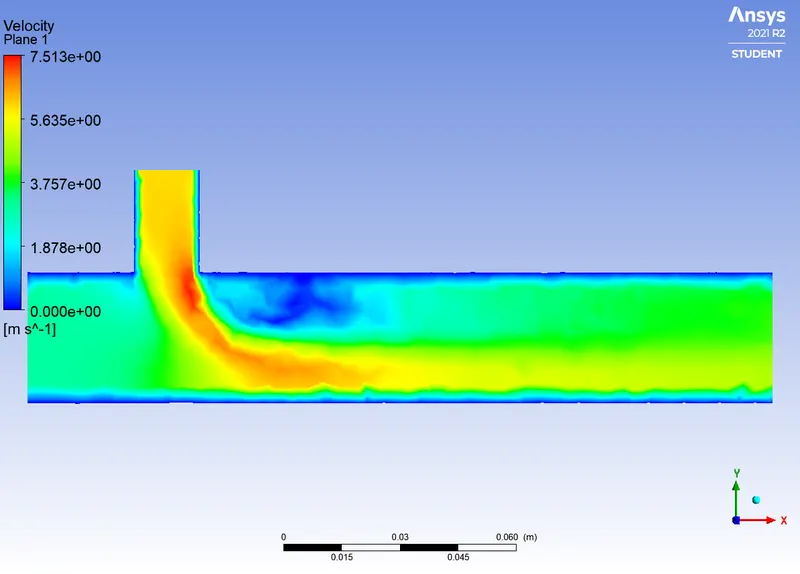
Velocity contour along pipe(mesh size default)
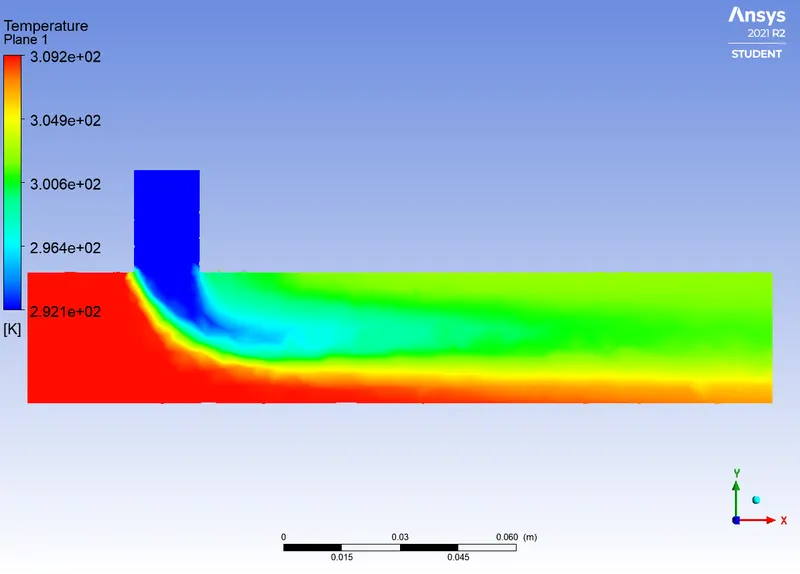
Temperature contour along pipe(fine mesh of element size 0.005)
Velocity contour along pipe (fine mesh of element size 0.005)
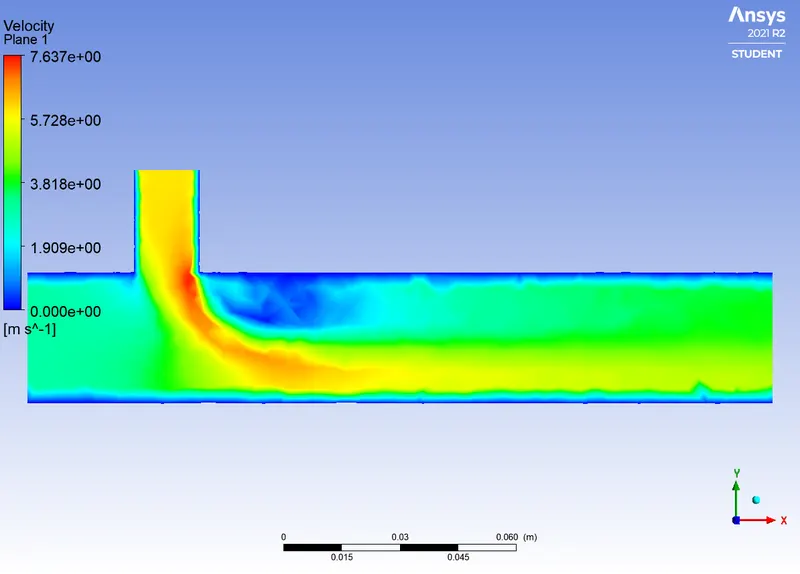
- From the above plots and contours we can conclude that for this problem the solution is Independent of number of mesh as both solution looks very identical
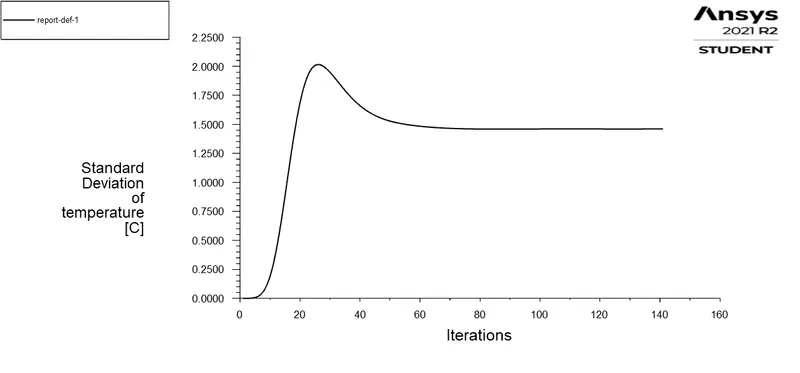
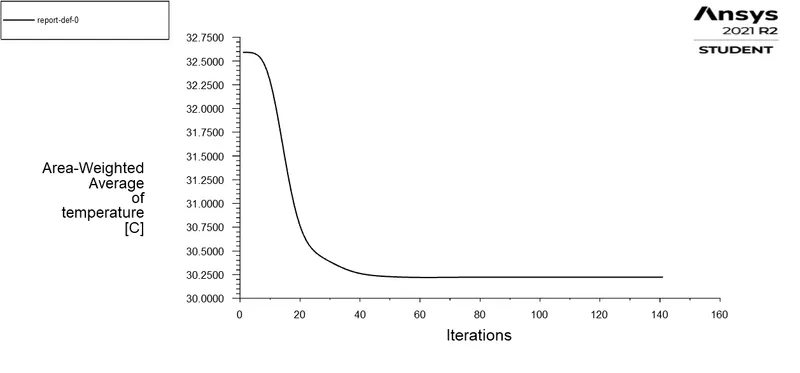
Comparison of K-epsilon model with K-omega model for further calculations
K-epsilon model Results
Scaled residuls
Standard deviation
Area weighted avarage of tempeerature at outlet
K-omega model
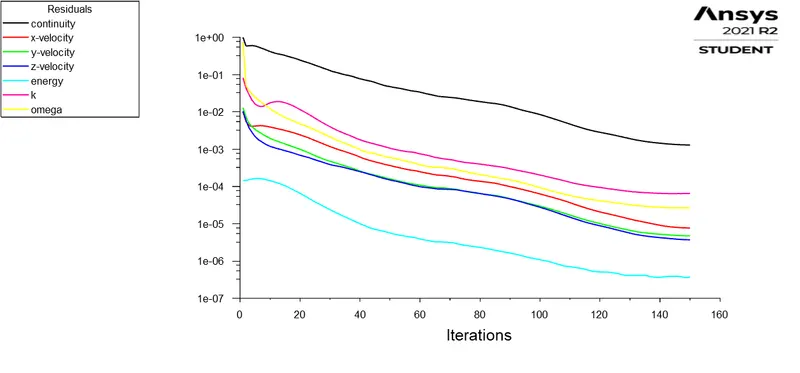
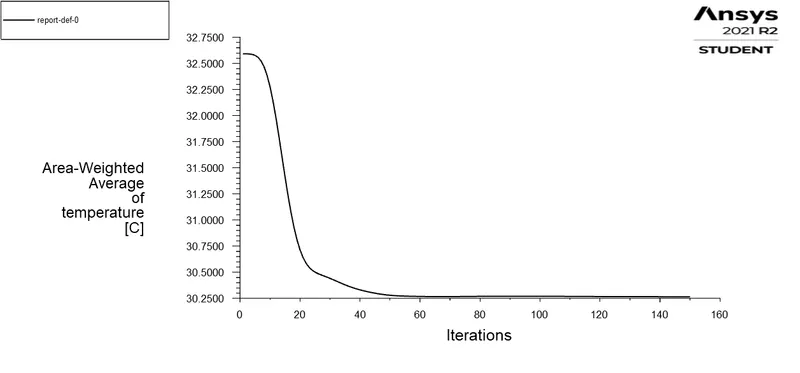
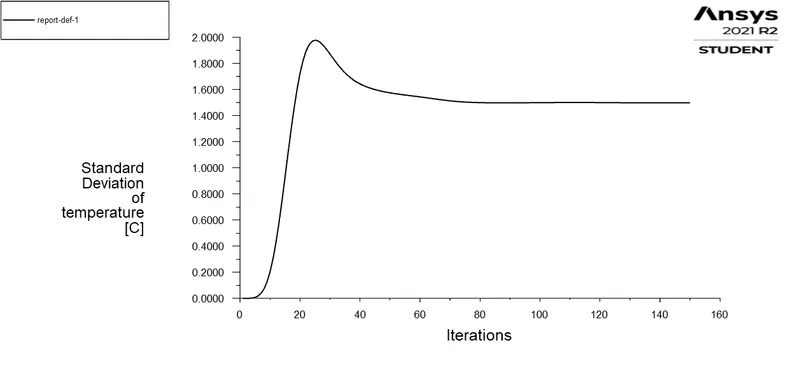
- It was noted that the computation time for k-omega model were less
- also in K-omega model the resudual for omega is lesser than that of k-epsilon model
- After some research it was concluded that the K epsilon is best suited for flow away from the wall, say free surface flow region, whereas k-omega model is best suited for near the wall flow region, where adverse pressure gradient is developed
- hence I will use k-omega model for further simulations
Results (Post-Processing)
Case 1 (for Short pipe)
Momentum Ratio = 2
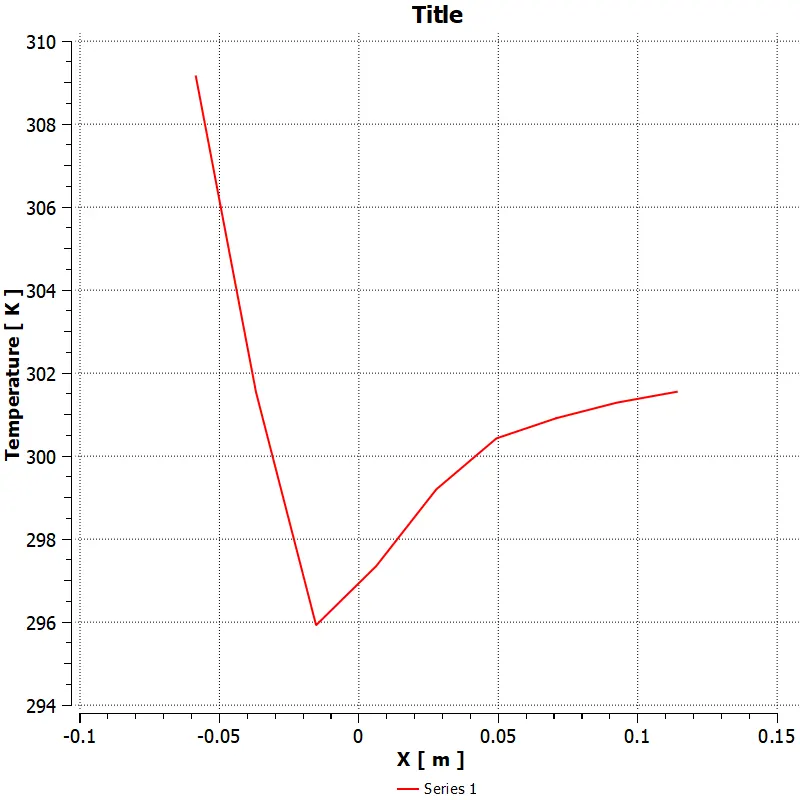
Plot for temperature along pipe
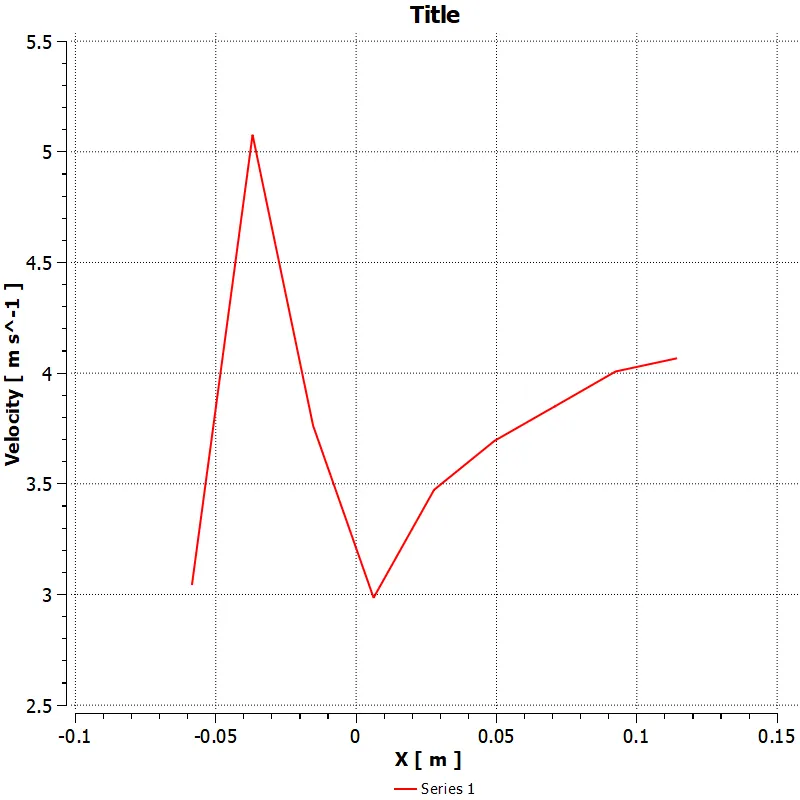
Plot for Velocity along pipe
Temperature Contour along pipe
Velocity Contour along pipe
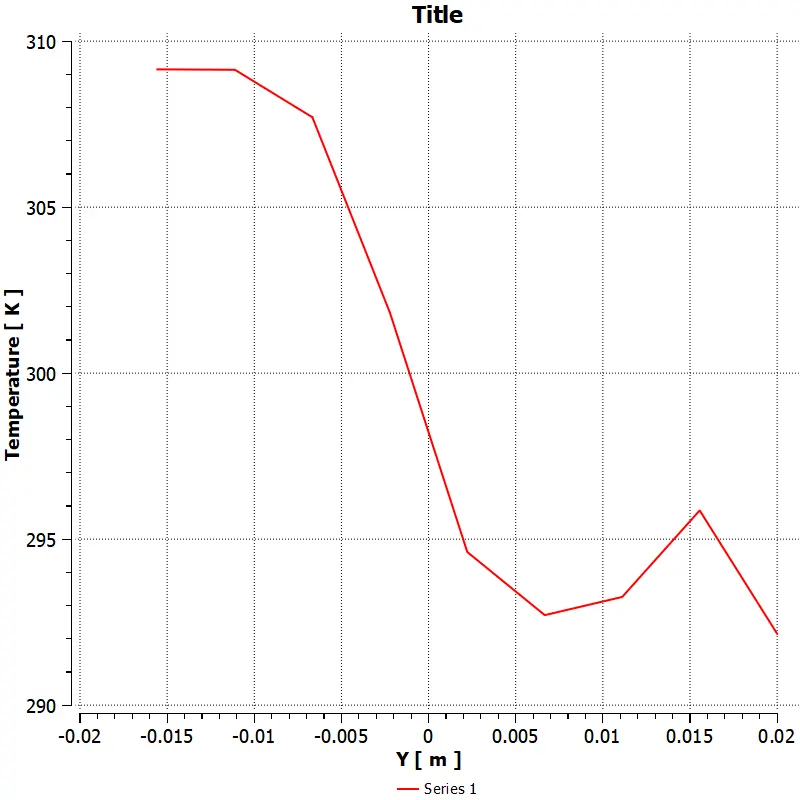
Plot for temperature across pipe at T-inlet
Plot for velocity across pipe at T-inlet
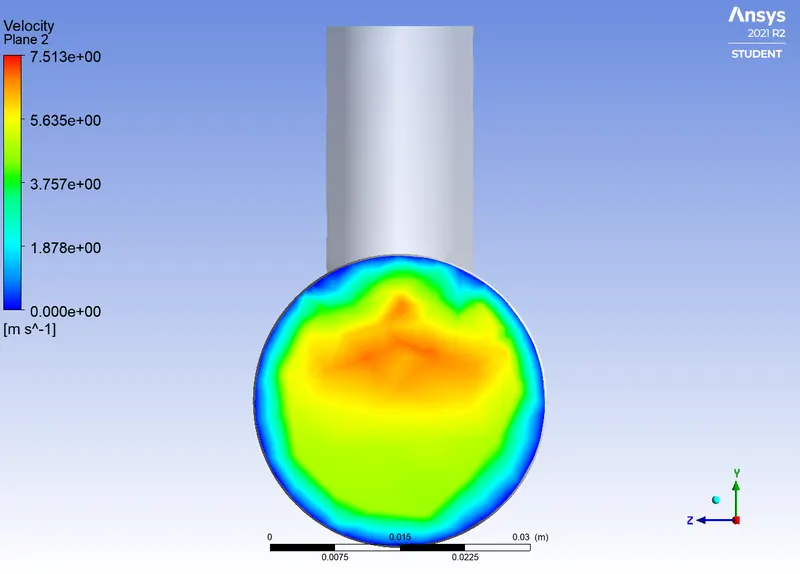
Velocity contour across pipe at T-inlet
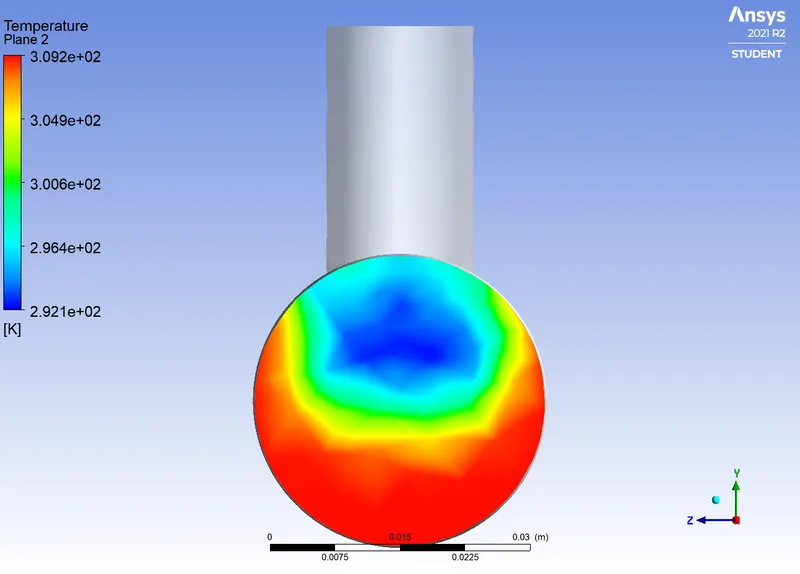
Temperature contour across pipe at T-inlet
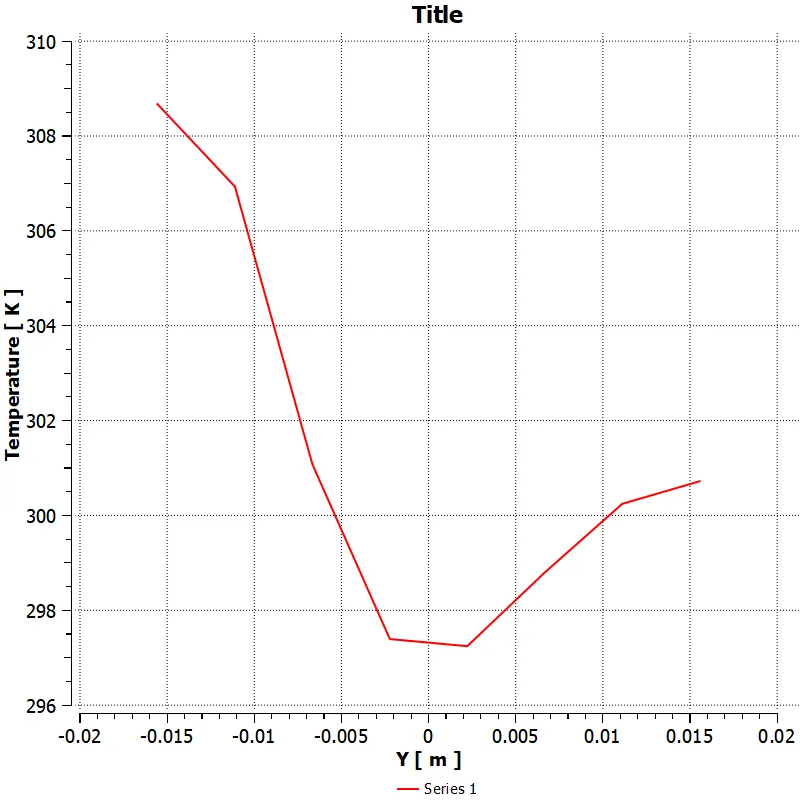
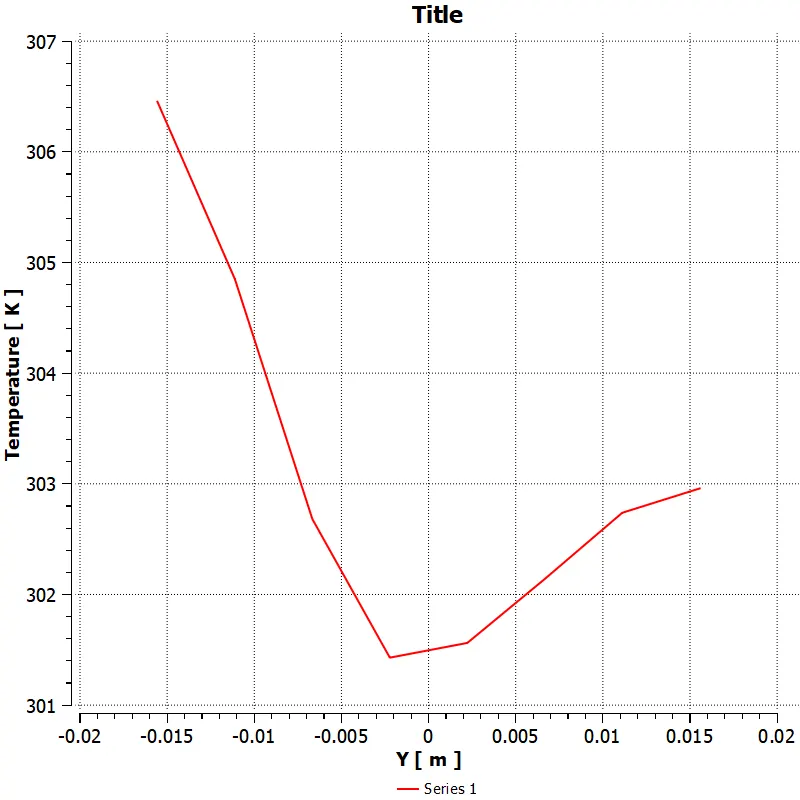
Plot for temperature across pipe at point 1 between T-inlet and pipe exit
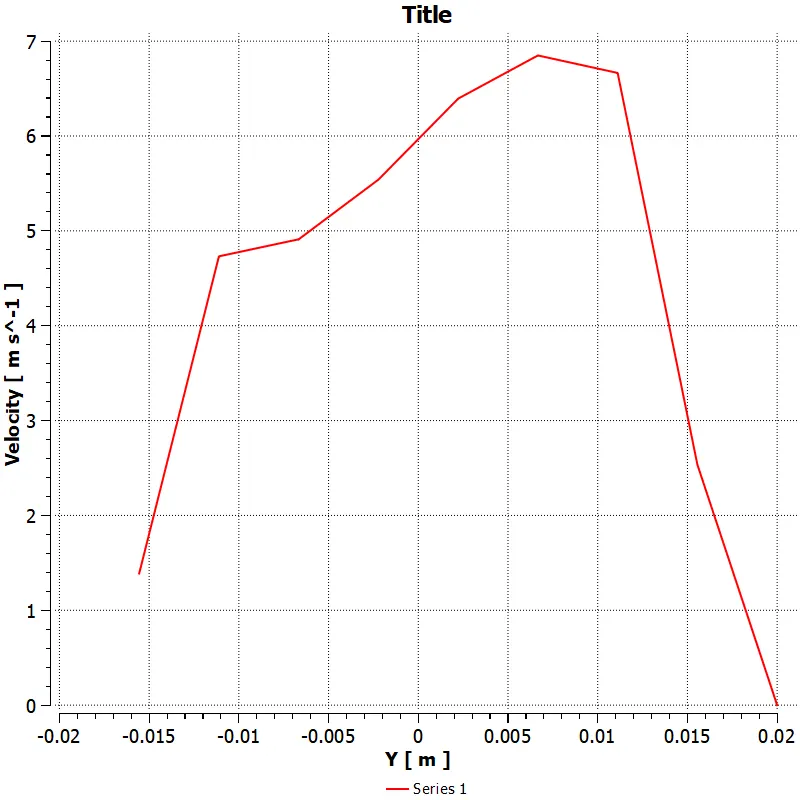
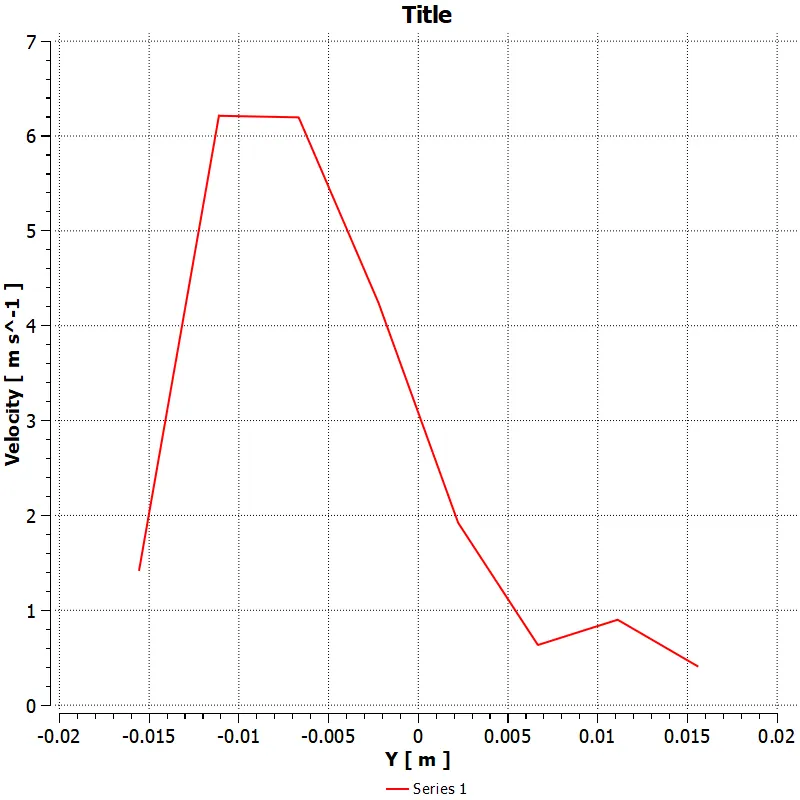
Plot for velocity across pipe at point 1 between T-inlet and pipe exit
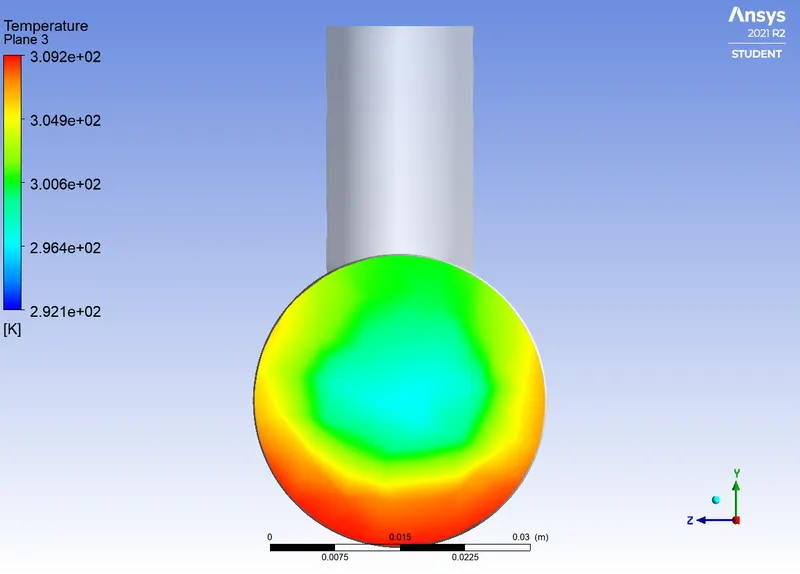
Temperature contour across pipe at point 1 between T-inlet and pipe exit
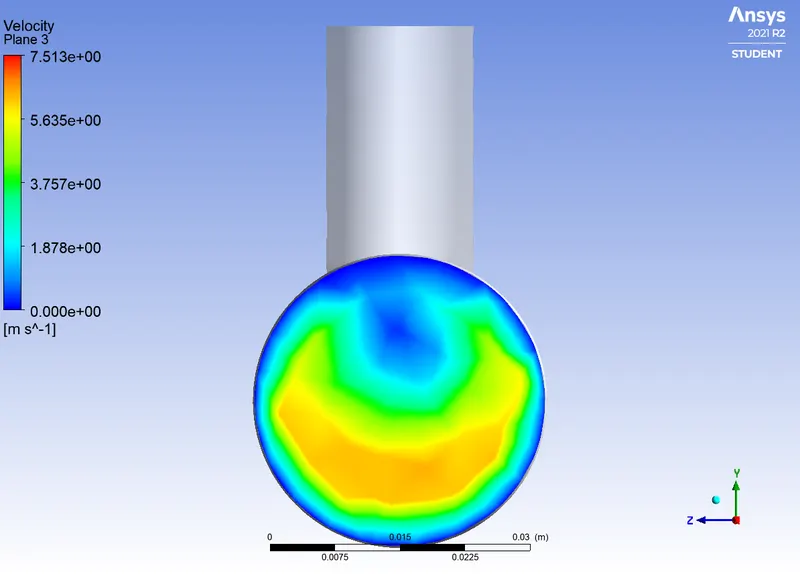
Velocity contour across pipe at point 1 between T-inlet and pipe exit
Plot for temperature across pipe at point 2 between T-inlet and pipe exit
Plot for velocity across pipe at point 2 between T-inlet and pipe exit
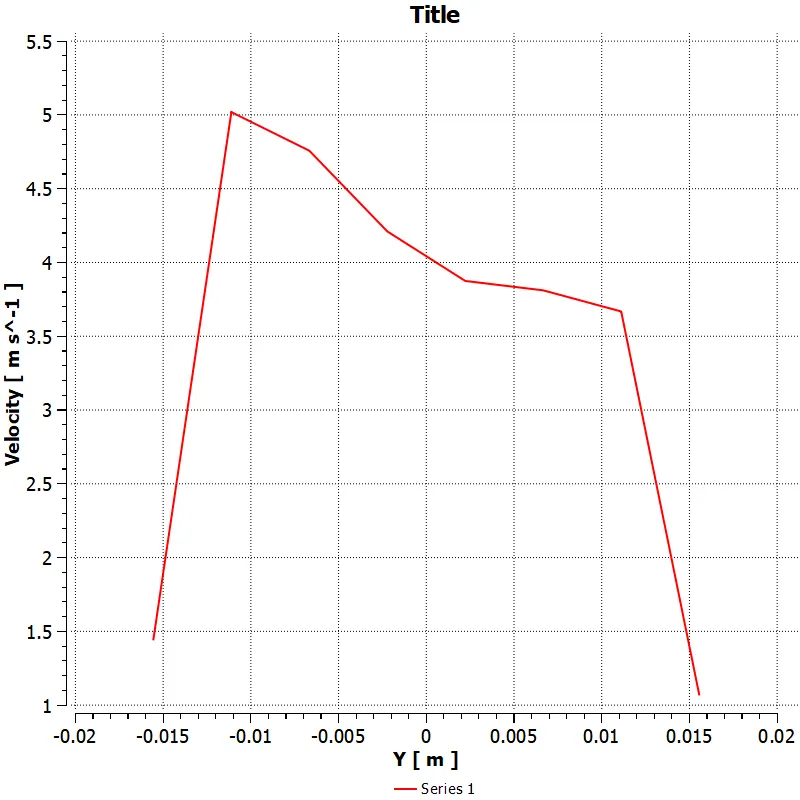
Velocity contour across pipe at point 2 between T-inlet and pipe exit
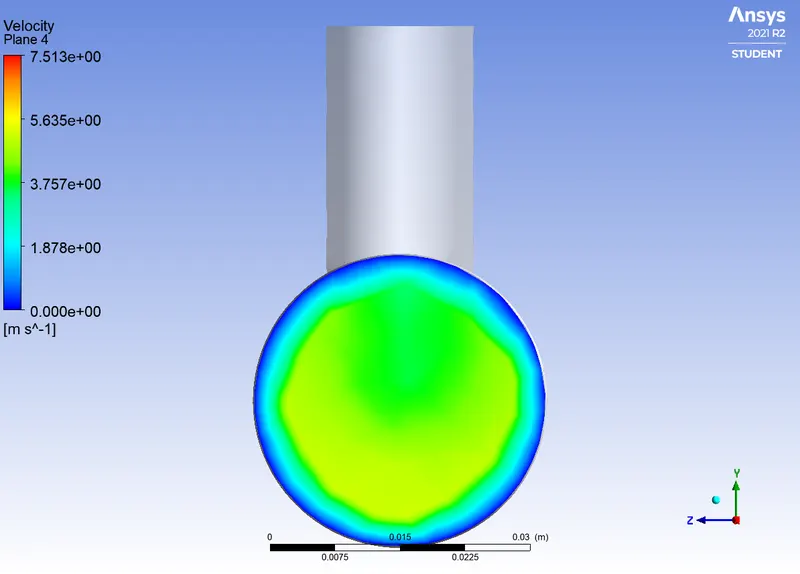
Temperature contour across pipe at point 2 between T-inlet and pipe exit
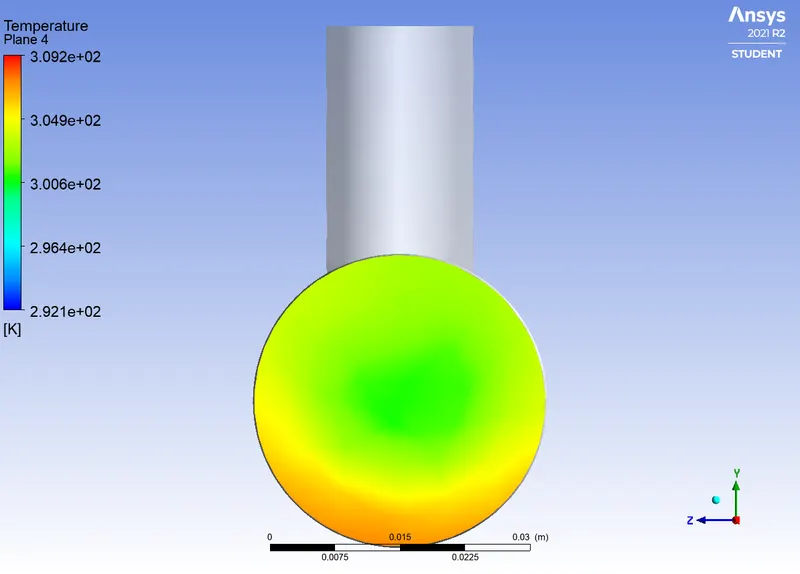
Plot for velocity across pipe at pipe exit
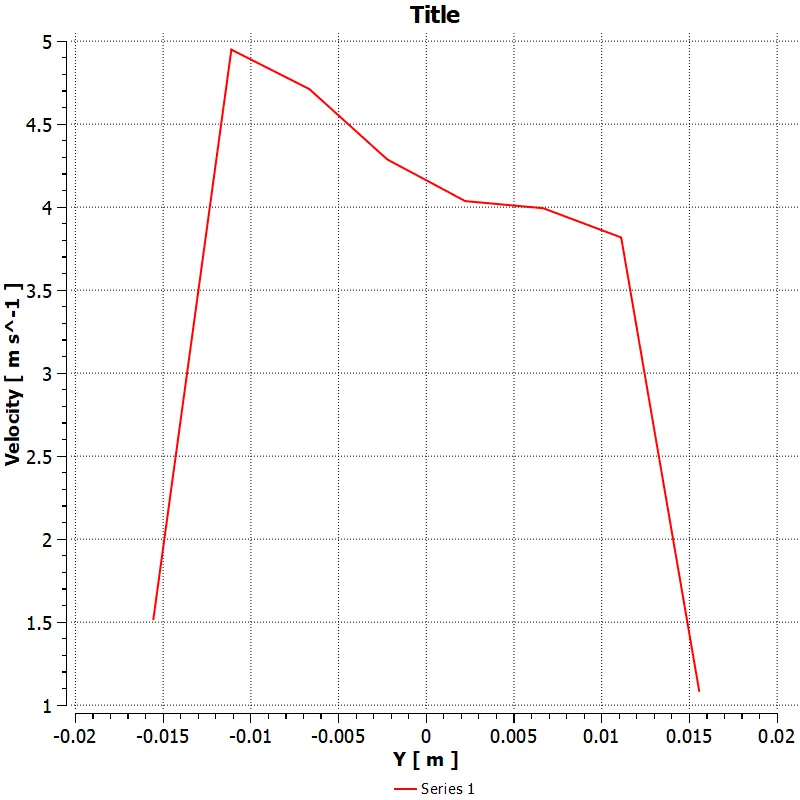
Plot for temperature across pipe at pipe exit
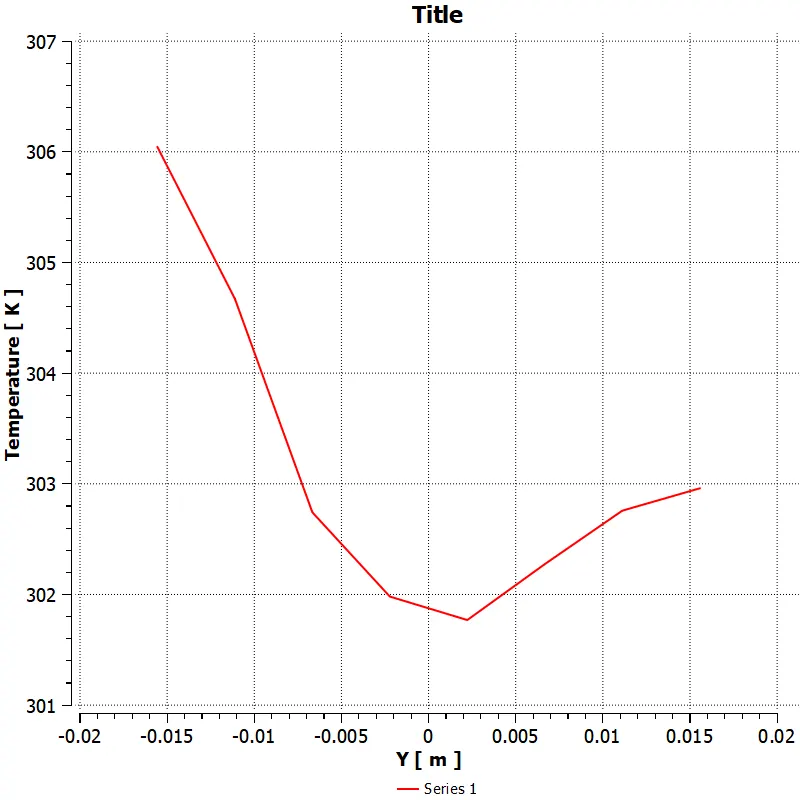
Velocity contour across pipe at exit
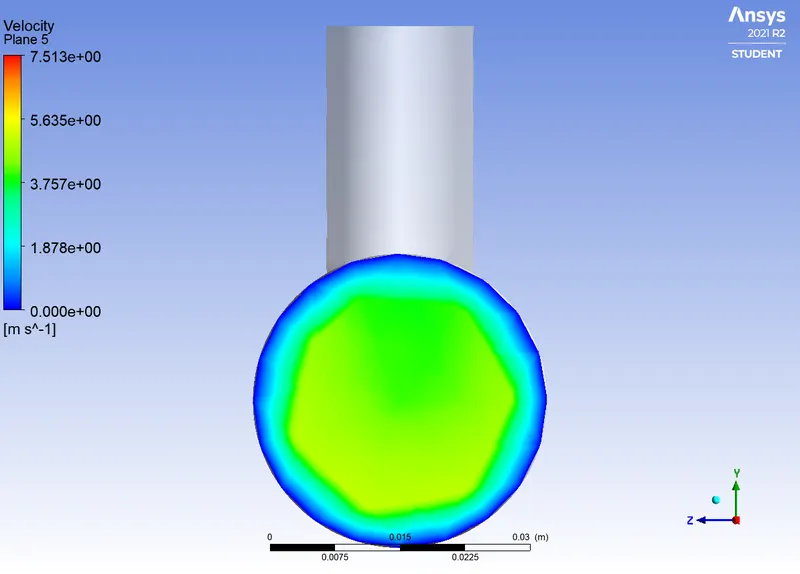
Temperature contour across pipe at exit
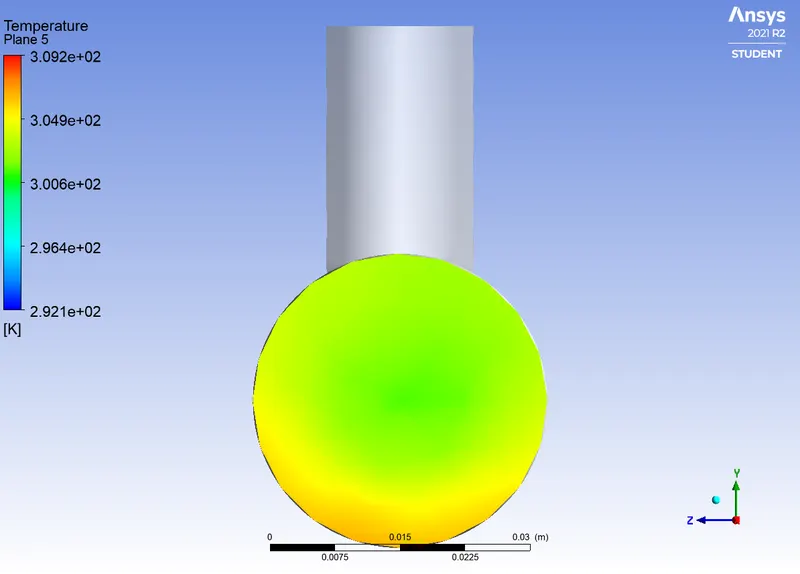
For Momentum Ratio = 4,
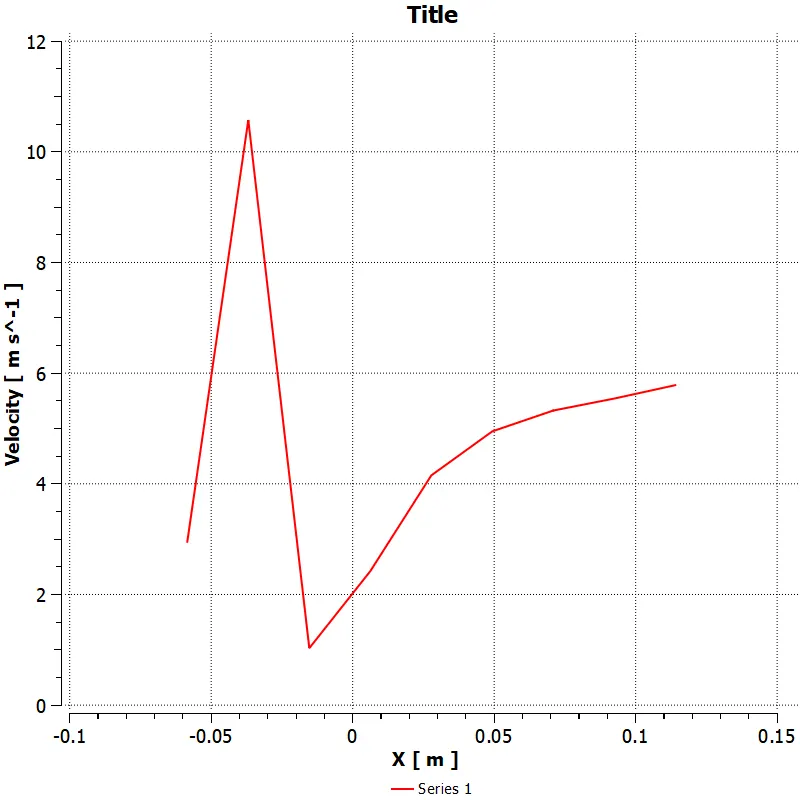
Plot for temperature along pipe
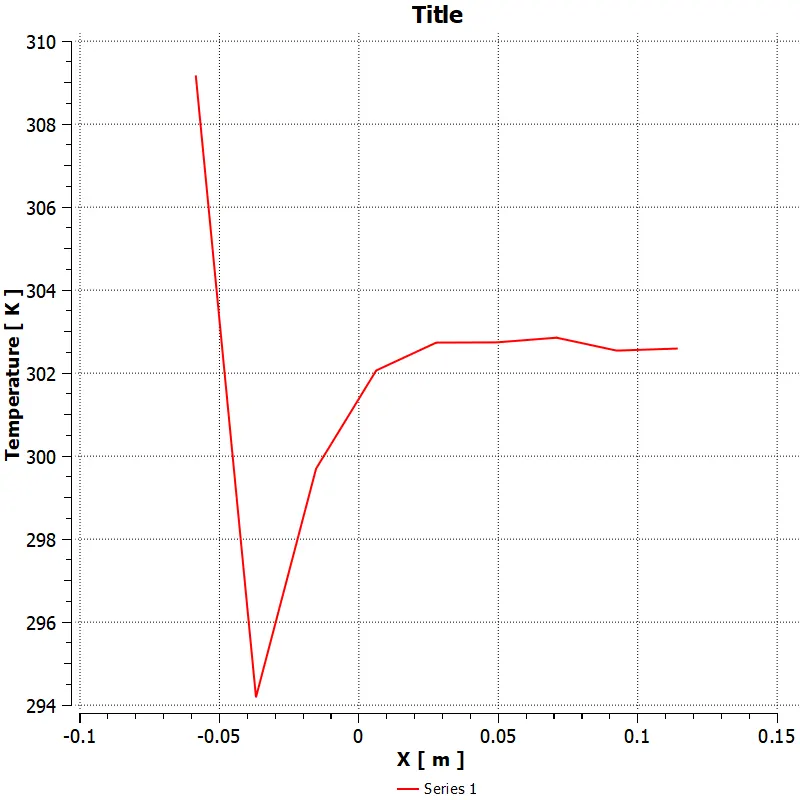
Plot for Velocity along pipe
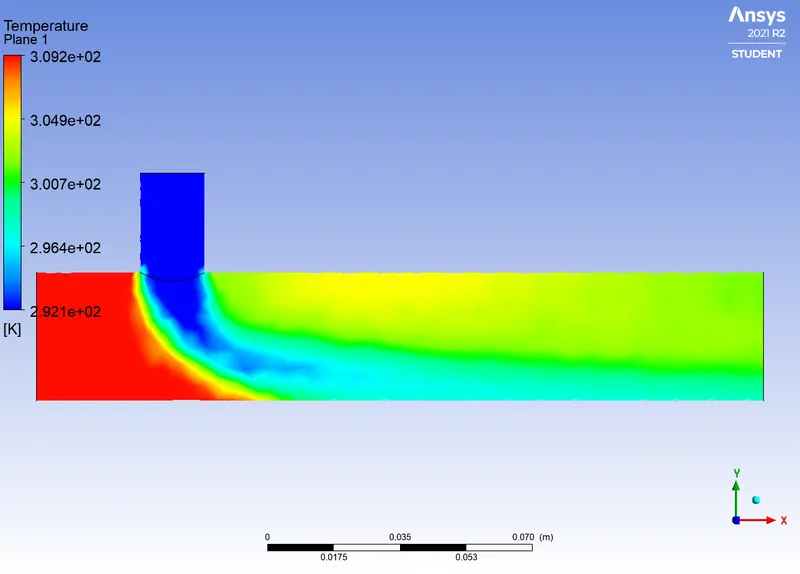
Temperature Contour along pipe
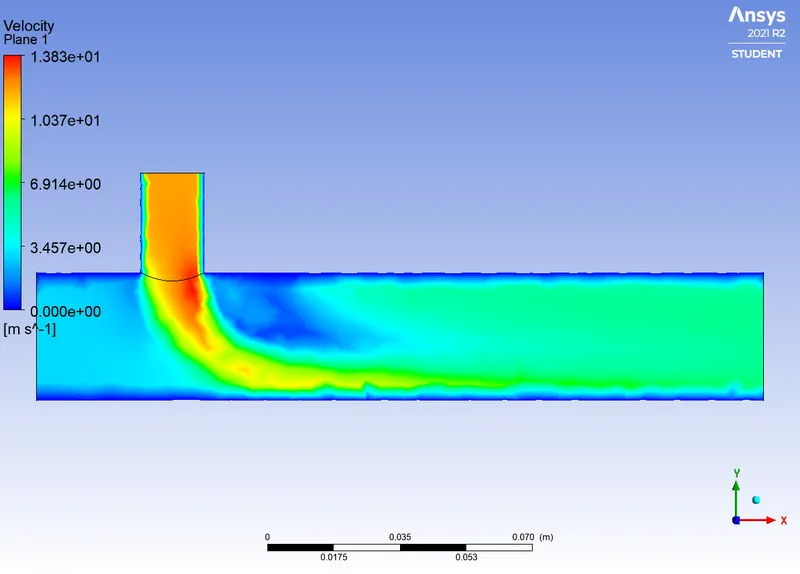
Velocity Contour along pipe
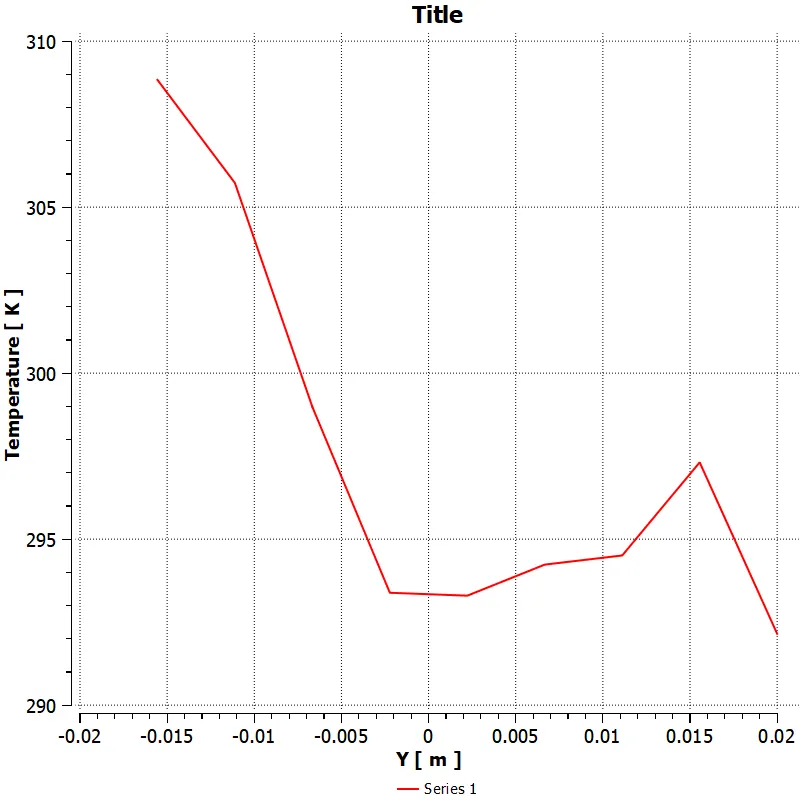
Plot for temperature across pipe at T-inlet
Plot for velocity across pipe at T-inlet
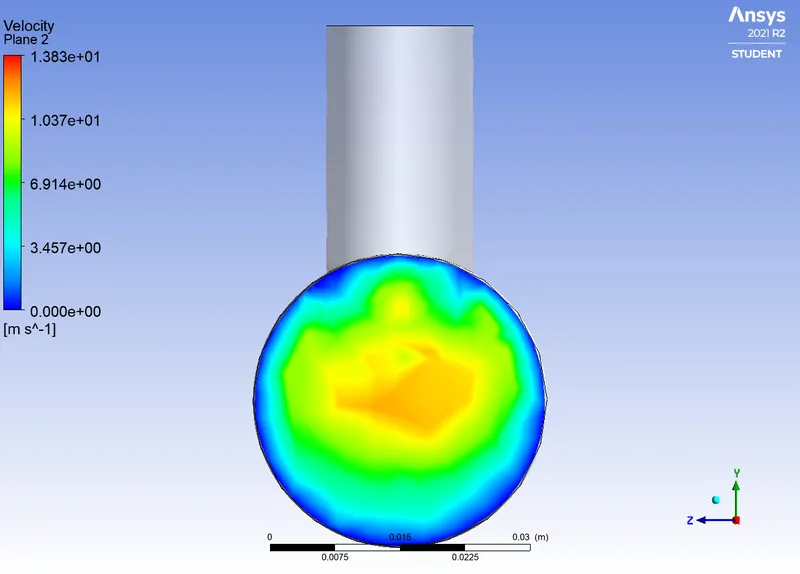
Velocity contour across pipe at T-inlet
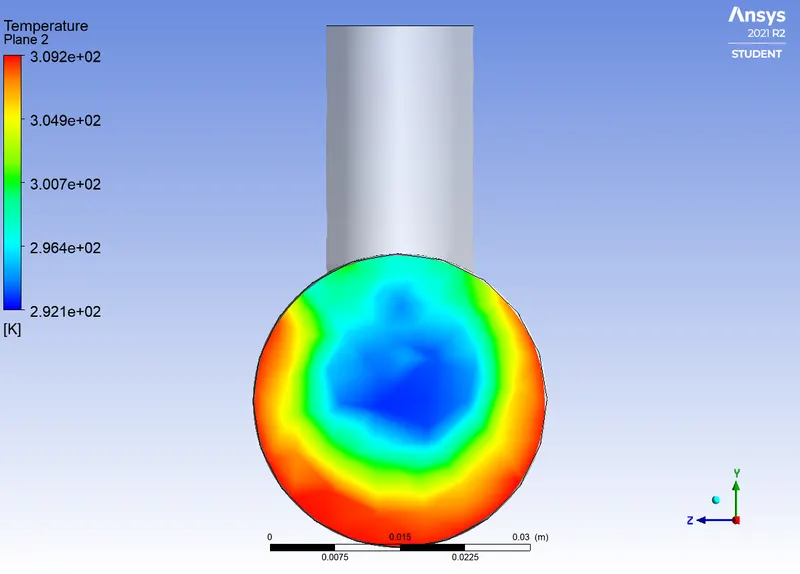
Temperature contour across pipe at T-inlet
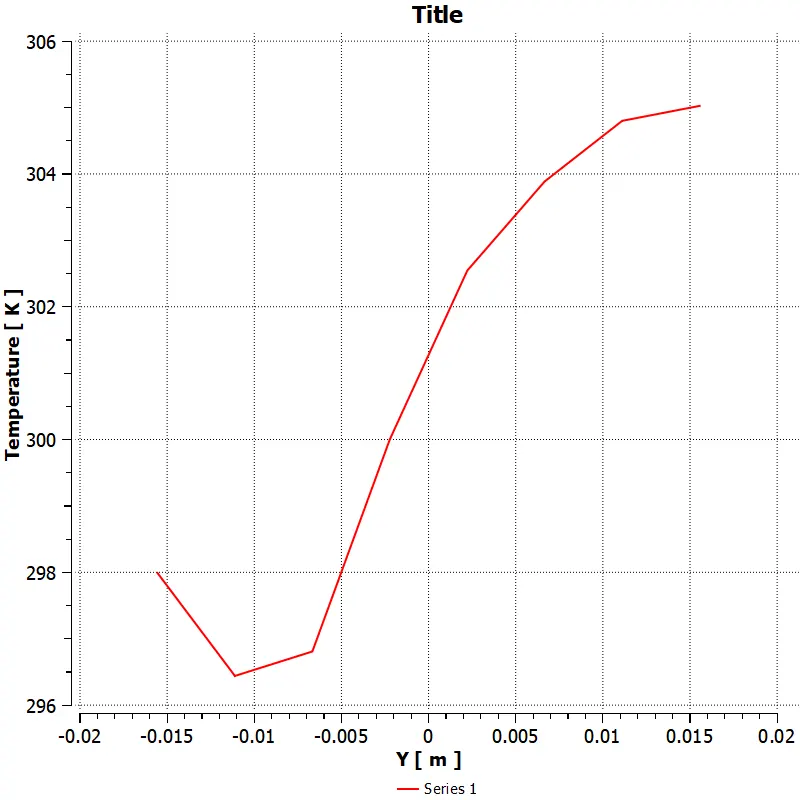
Plot for temperature across pipe at point 1 between T-inlet and pipe exit
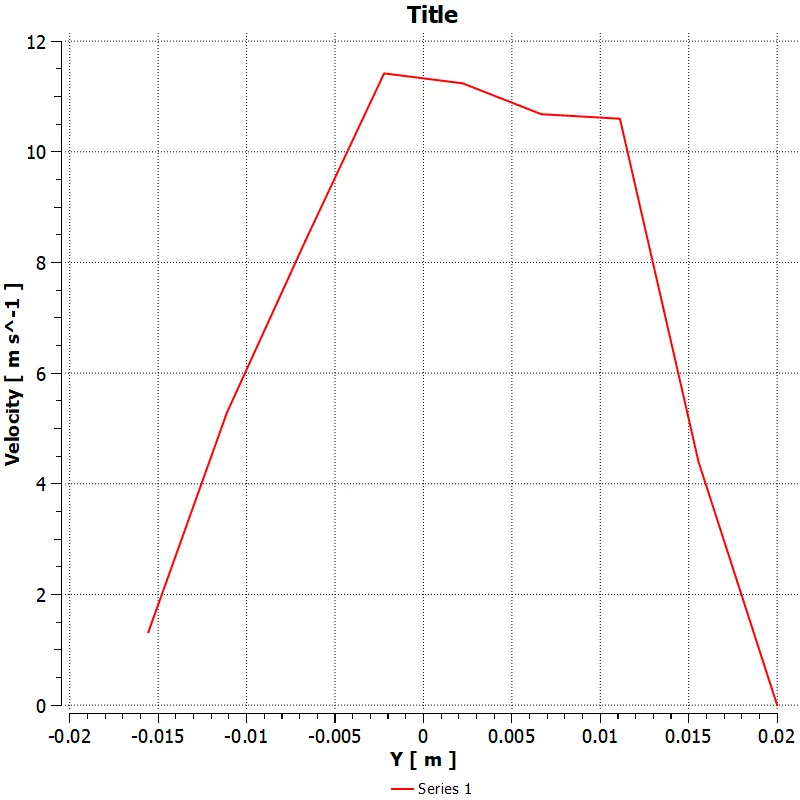
Plot for velocity across pipe at point 1 between T-inlet and pipe exit
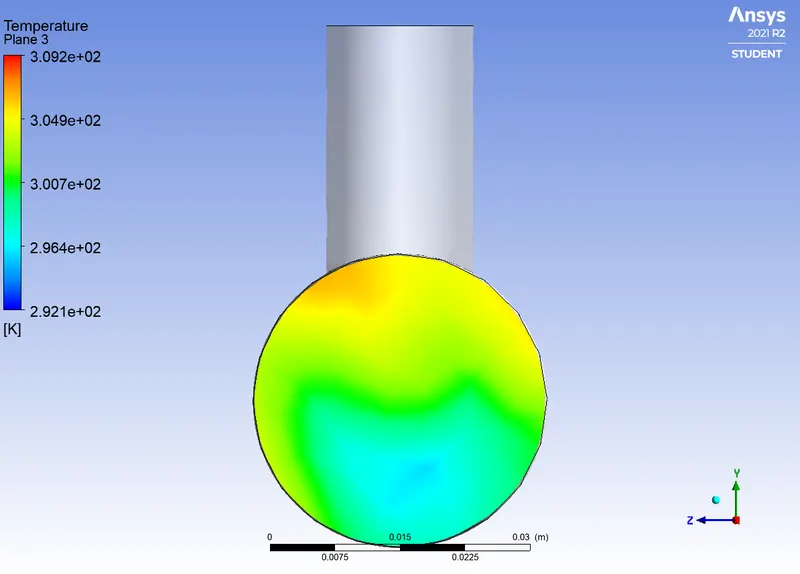
Temperature contour across pipe at point 1 between T-inlet and pipe exit
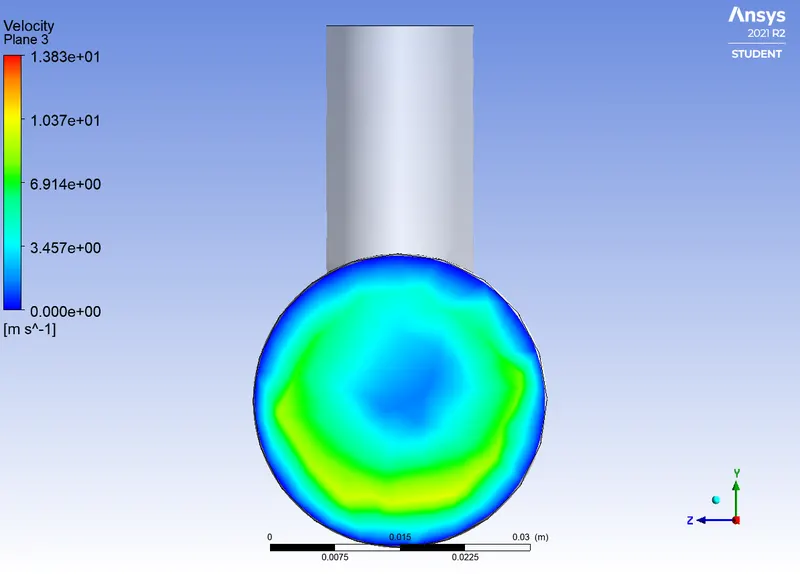
Velocity contour across pipe at point 1 between T-inlet and pipe exit
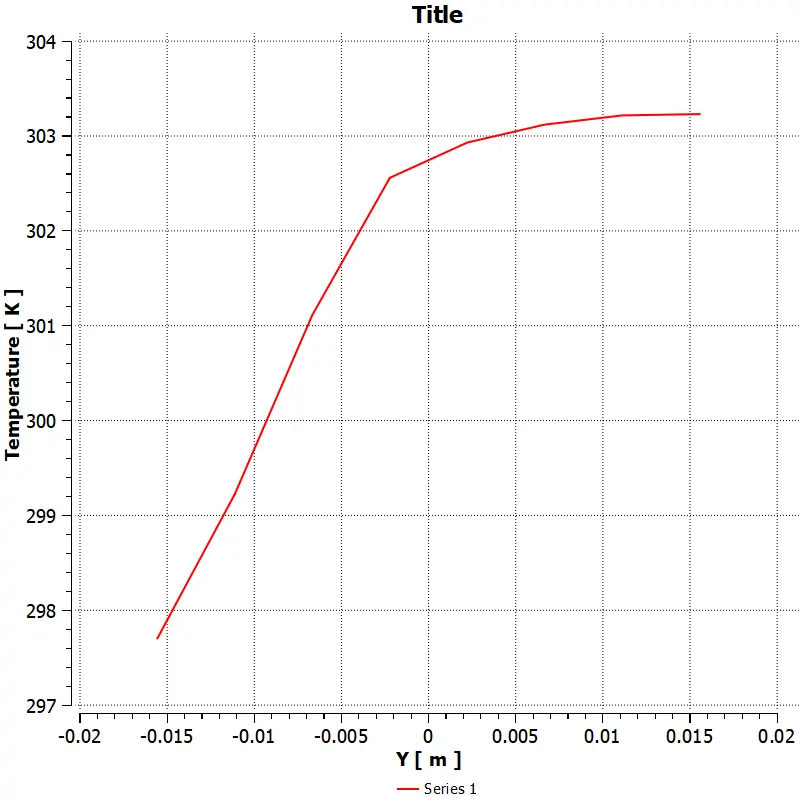
Plot for temperature across pipe at point 2 between T-inlet and pipe exit
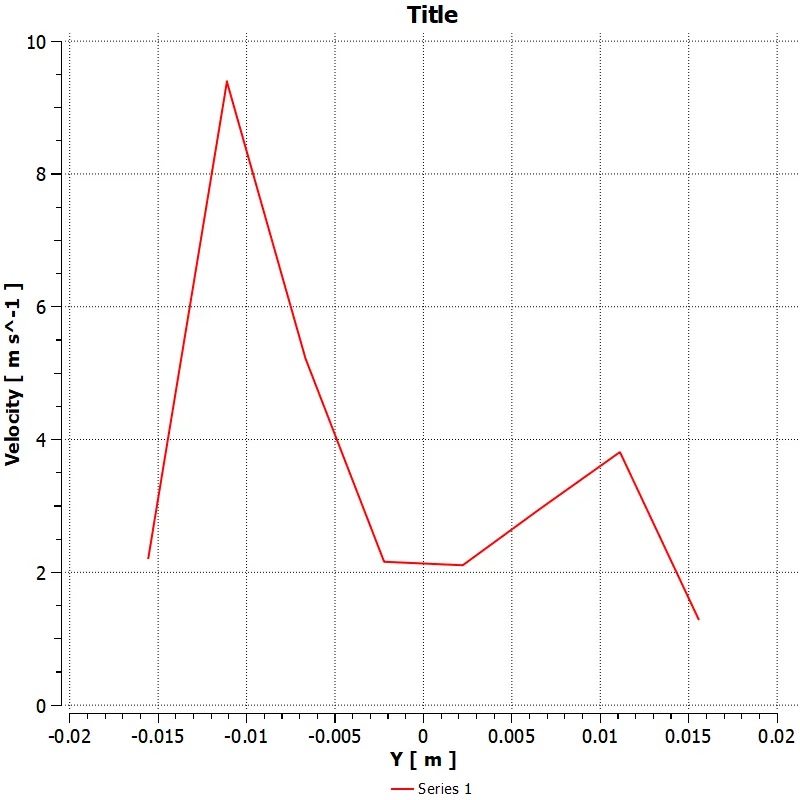
Plot for velocity across pipe at point 2 between T-inlet and pipe exit
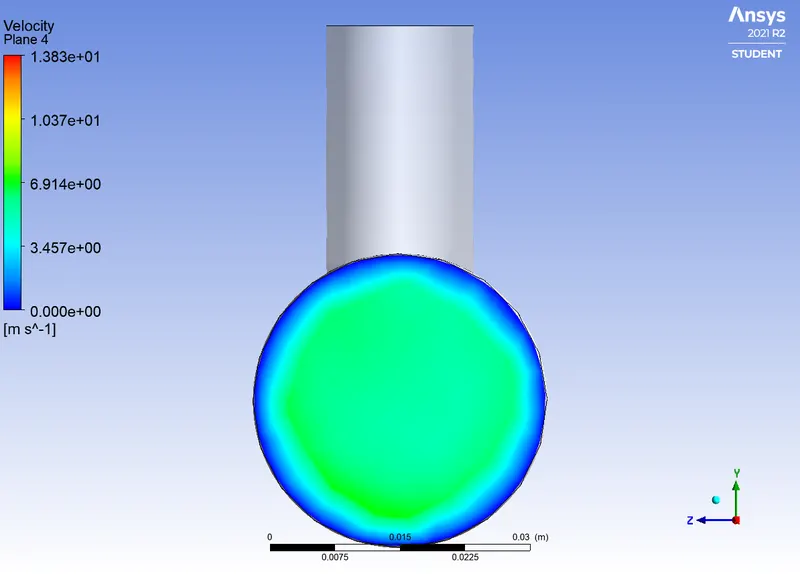
Velocity contour across pipe at point 2 between T-inlet and pipe exit
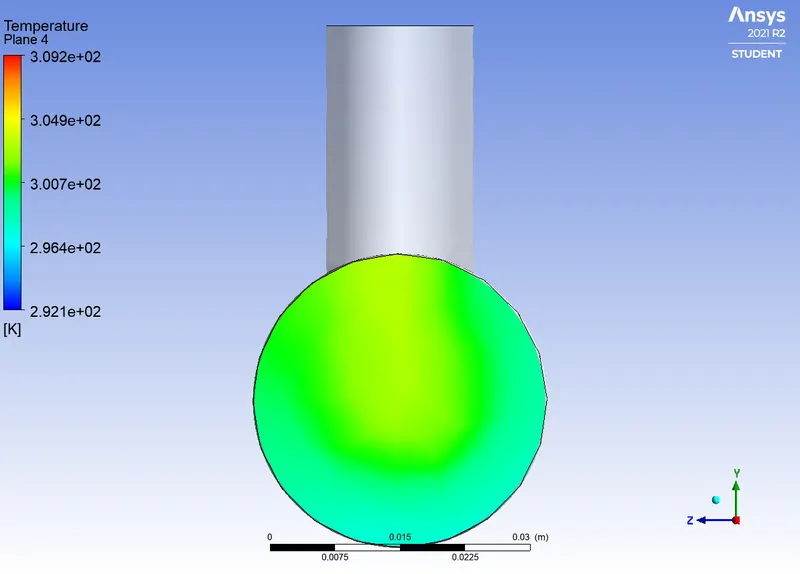
Temperature contour across pipe at point 2 between T-inlet and pipe exit
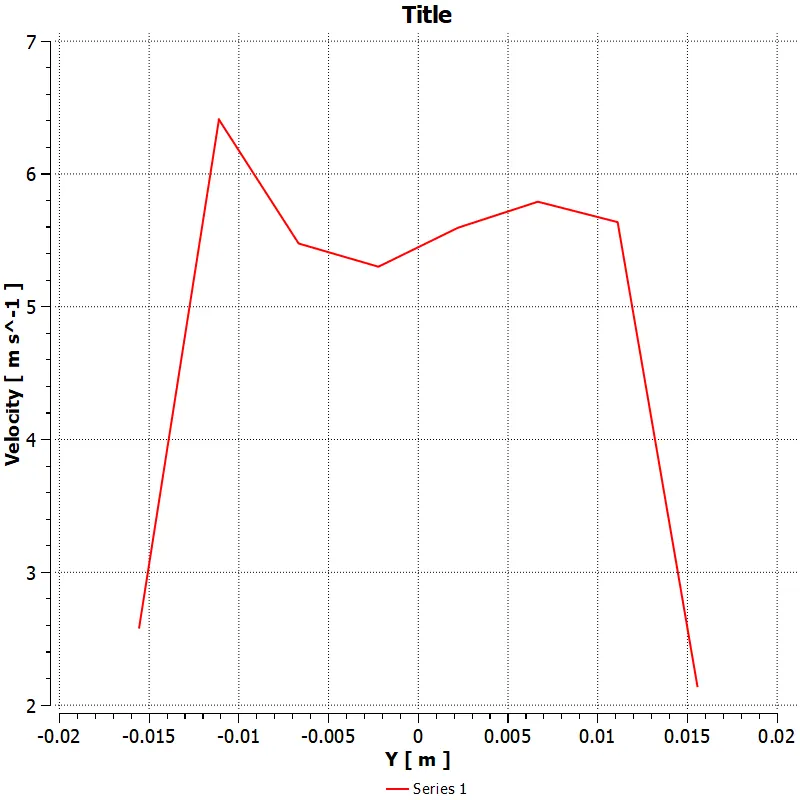
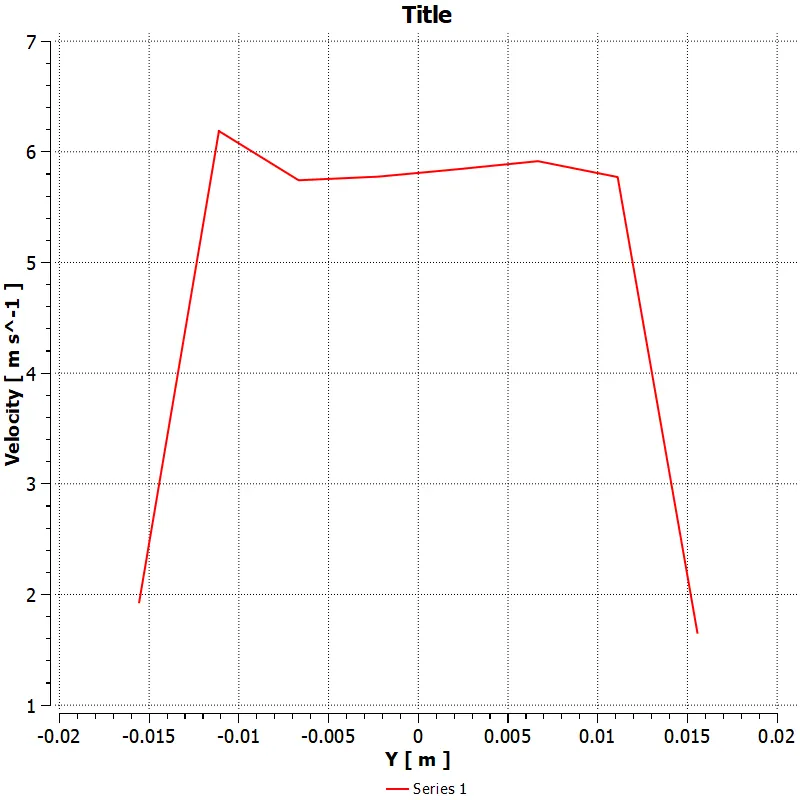
Plot for velocity across pipe at pipe exit
Plot for temperature across pipe at pipe exit
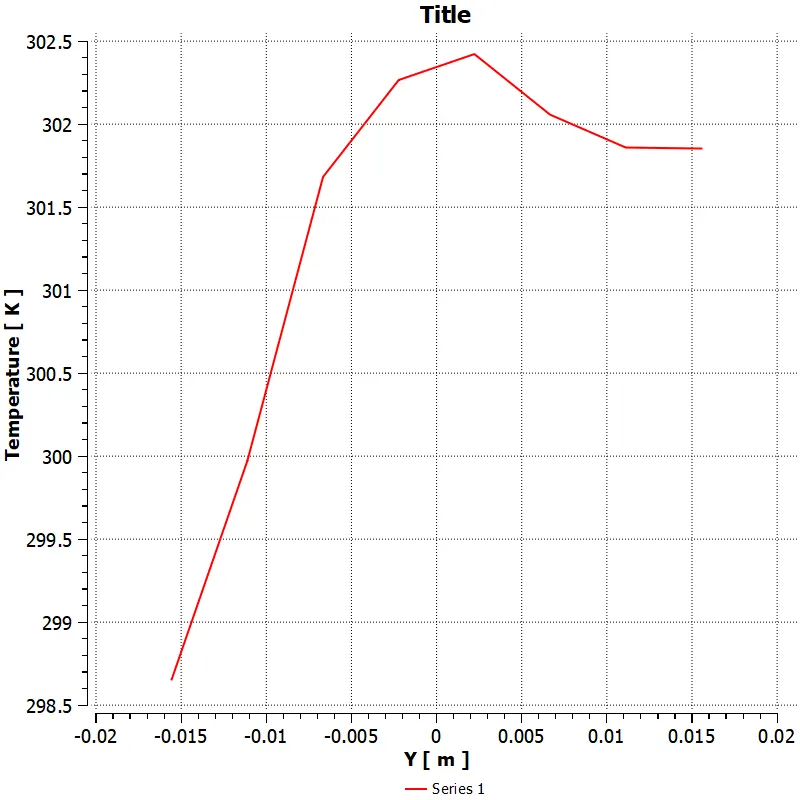
Velocity contour across pipe at exit
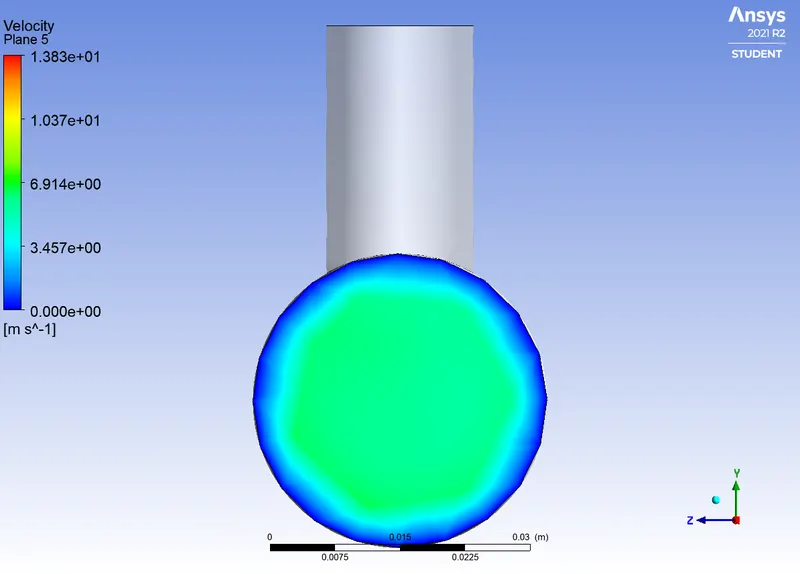
Temperature contour across pipe at exit
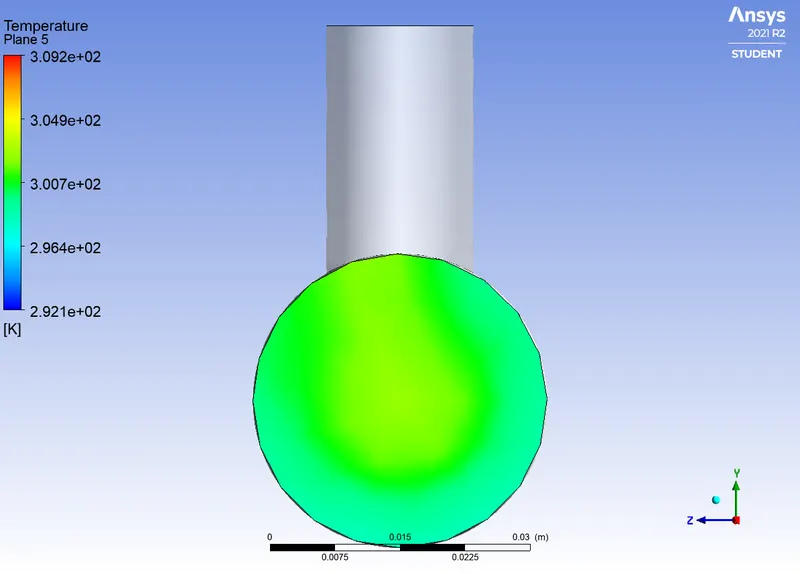
Case 2 (For long pipe)
Momentum Ratio = 2 ,
Plot for temperature along pipe
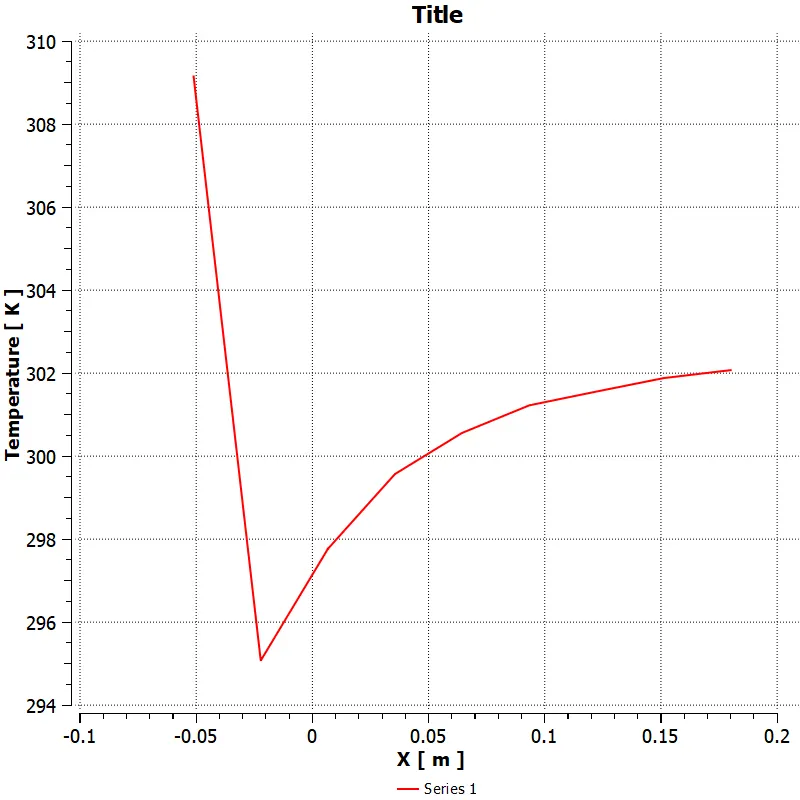
Plot for Velocity along pipe
Temperature Contour along pipe
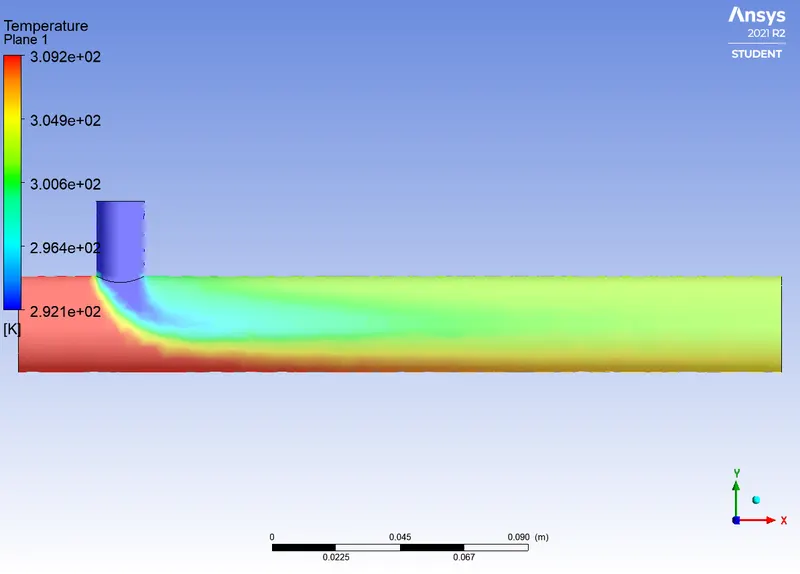
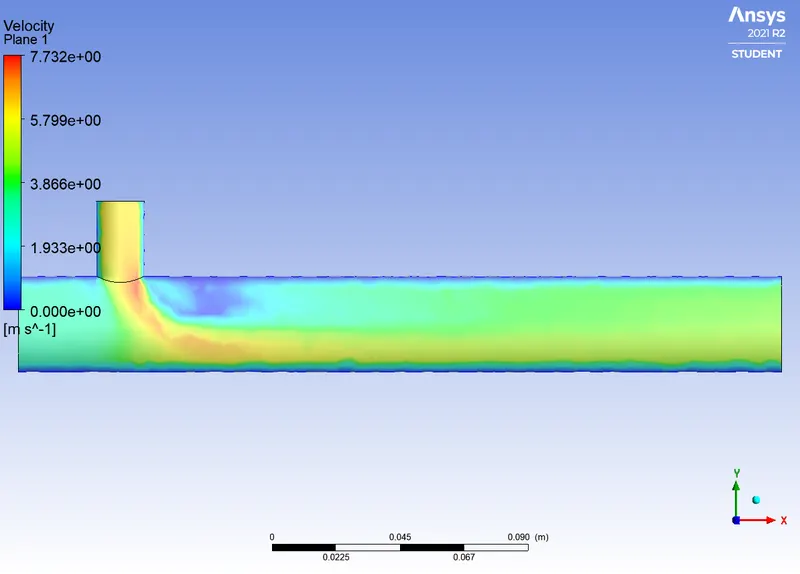
Velocity Contour along pipe
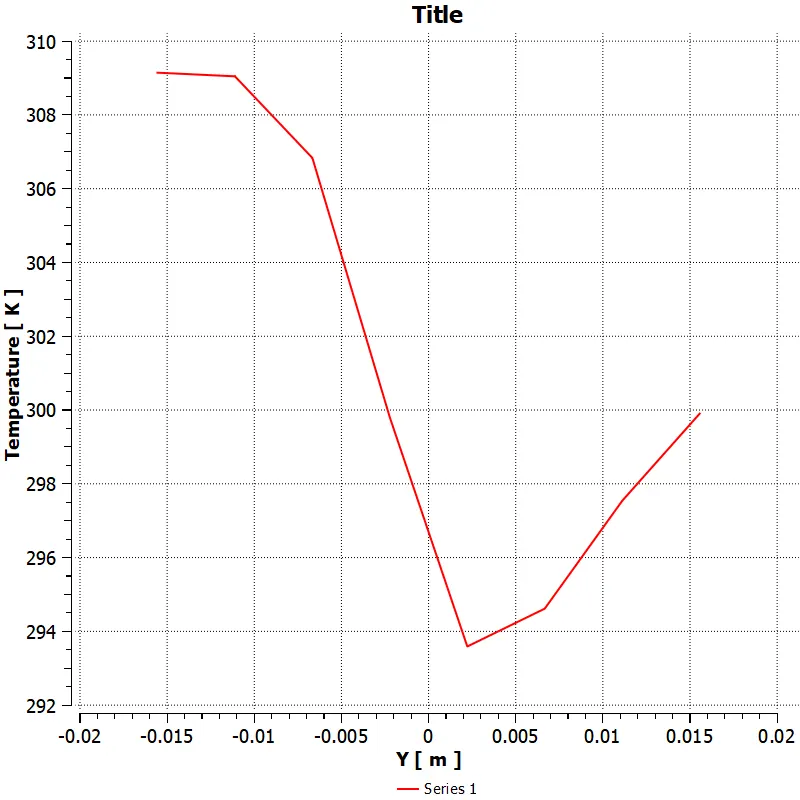
Plot for temperature across pipe at T-inlet
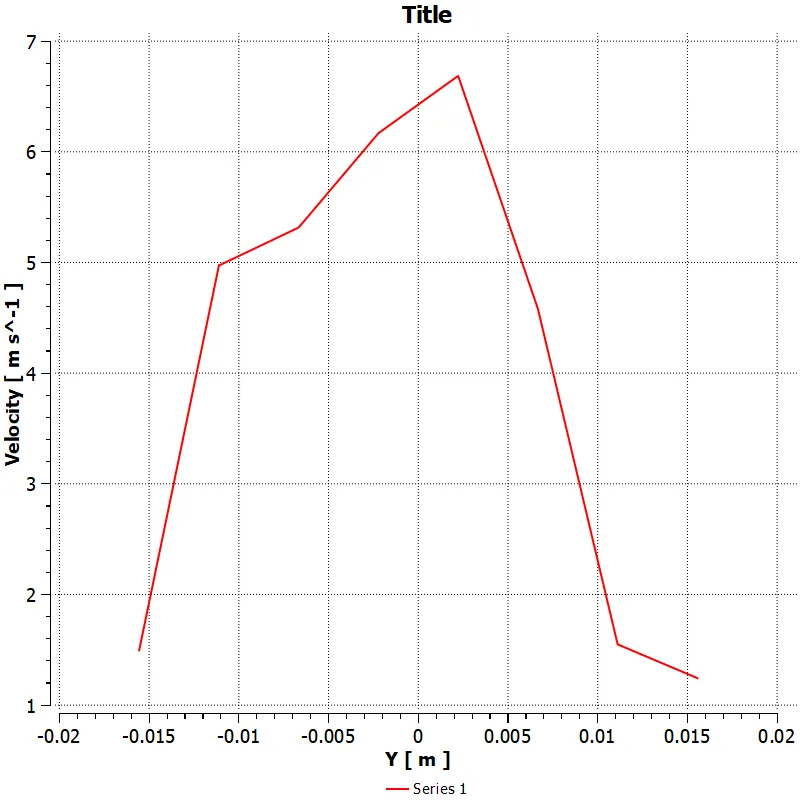
Plot for velocity across pipe at T-inlet
Velocity contour across pipe at T-inlet
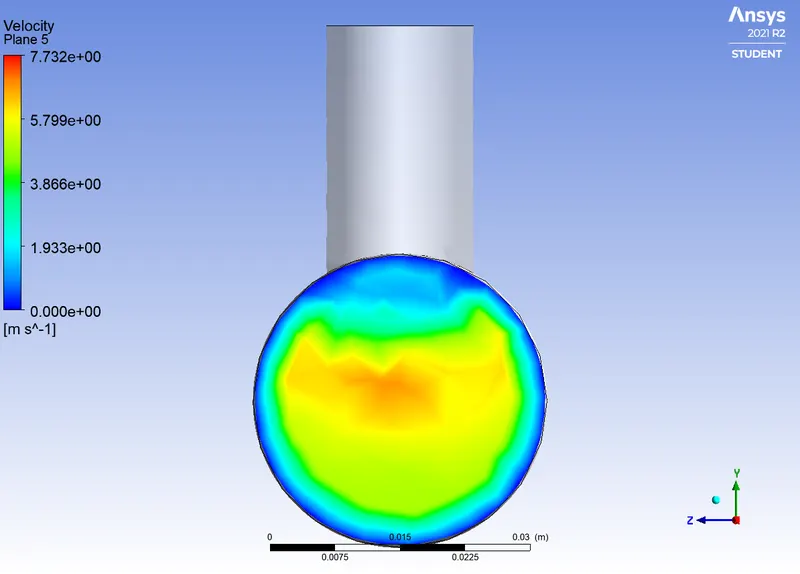
Temperature contour across pipe at T-inlet
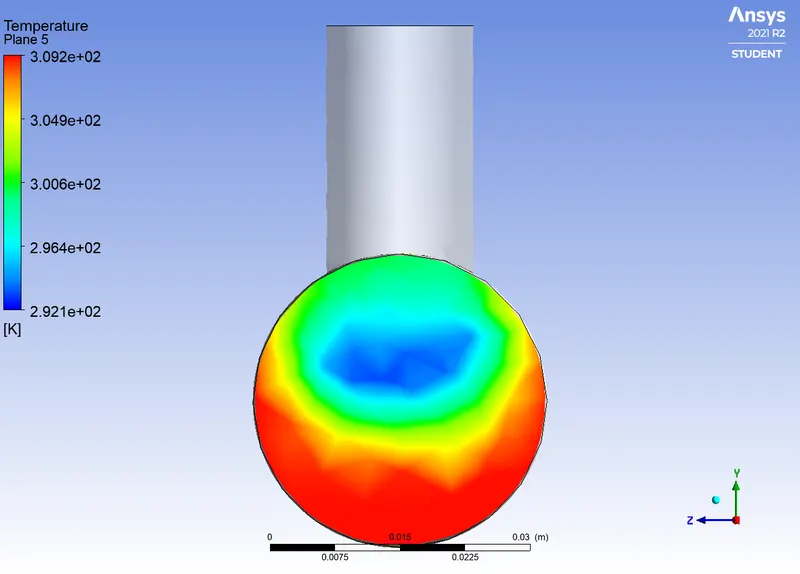
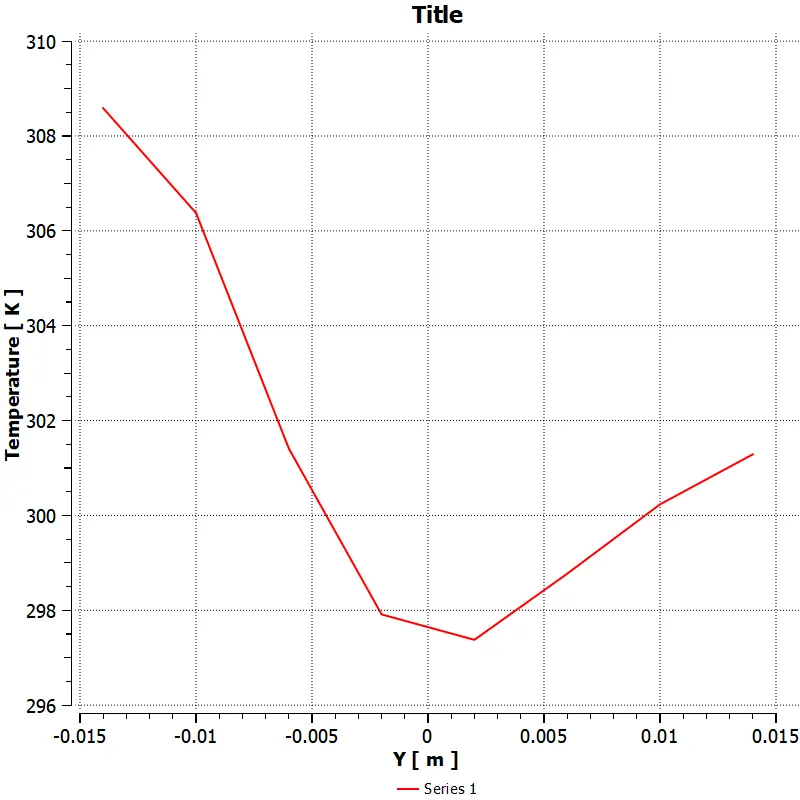
Plot for temperature across pipe at point 1 between T-inlet and pipe exit
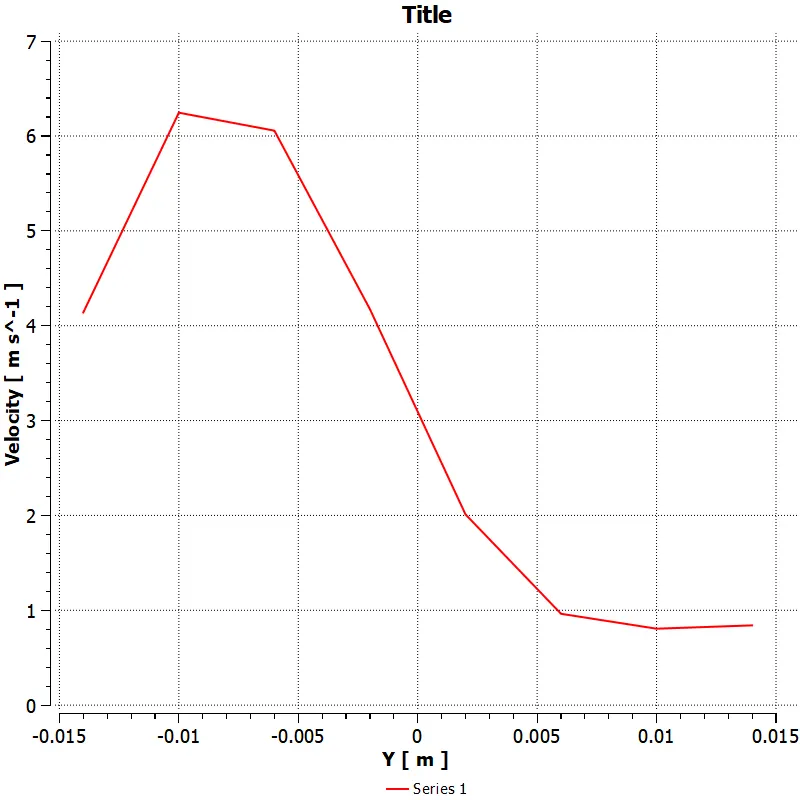
Plot for velocity across pipe at point 1 between T-inlet and pipe exit
Temperature contour across pipe at point 1 between T-inlet and pipe exit
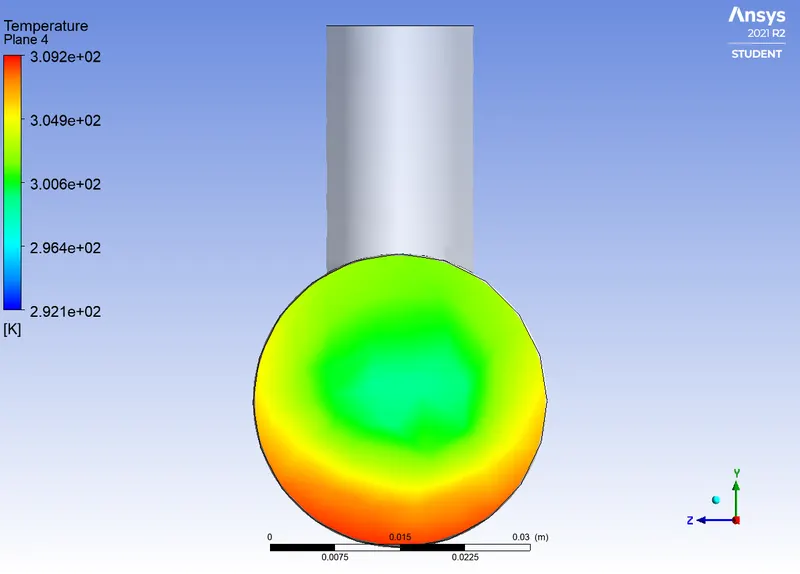
Velocity contour across pipe at point 1 between T-inlet and pipe exit
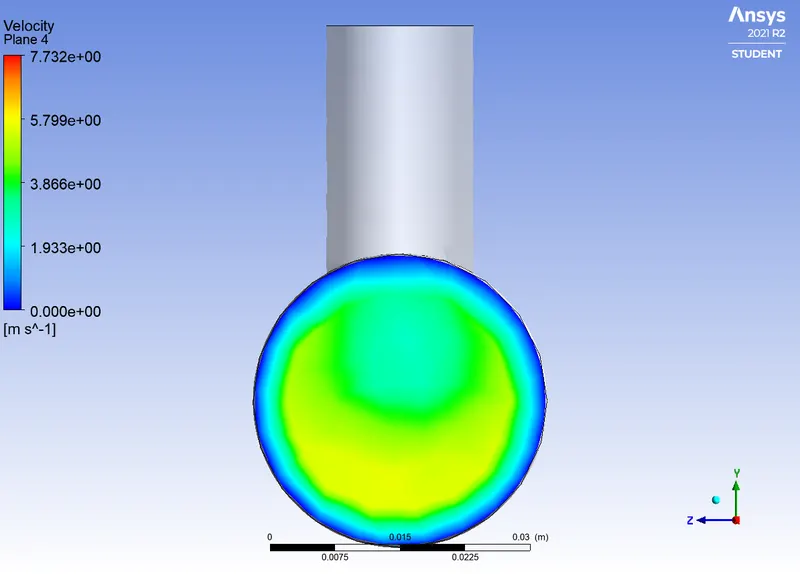
Plot for temperature across pipe at point 2 between T-inlet and pipe exit
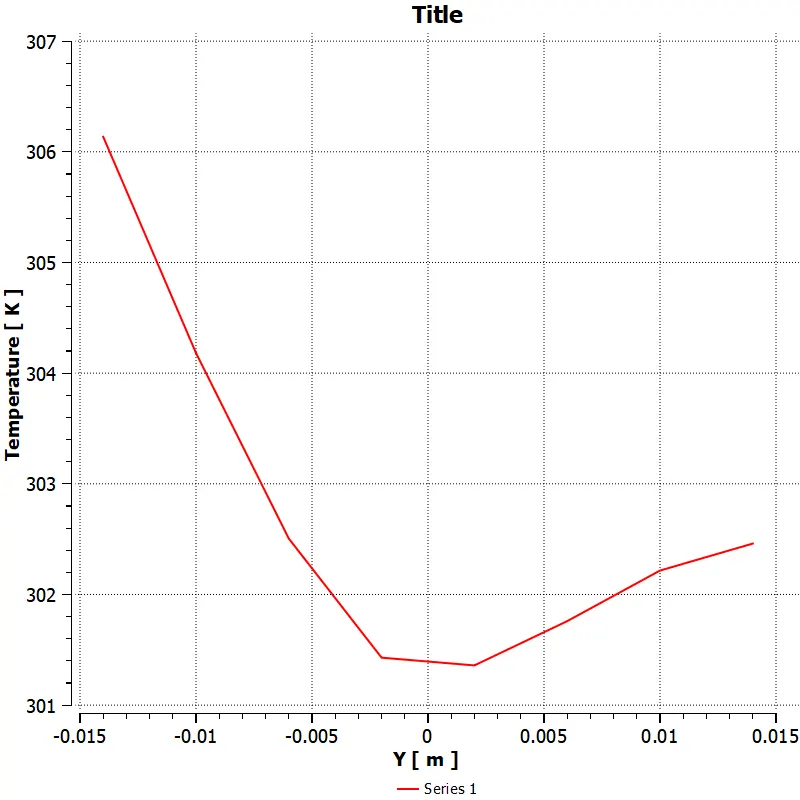
Plot for velocity across pipe at point 2 between T-inlet and pipe exit
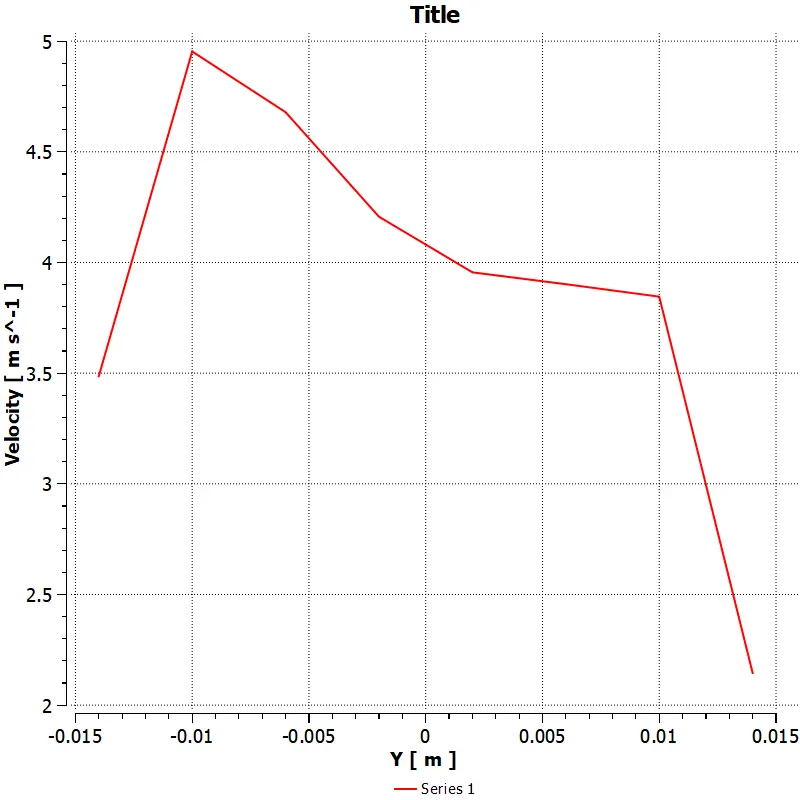
Velocity contour across pipe at point 2 between T-inlet and pipe exit
Temperature contour across pipe at point 2 between T-inlet and pipe exit
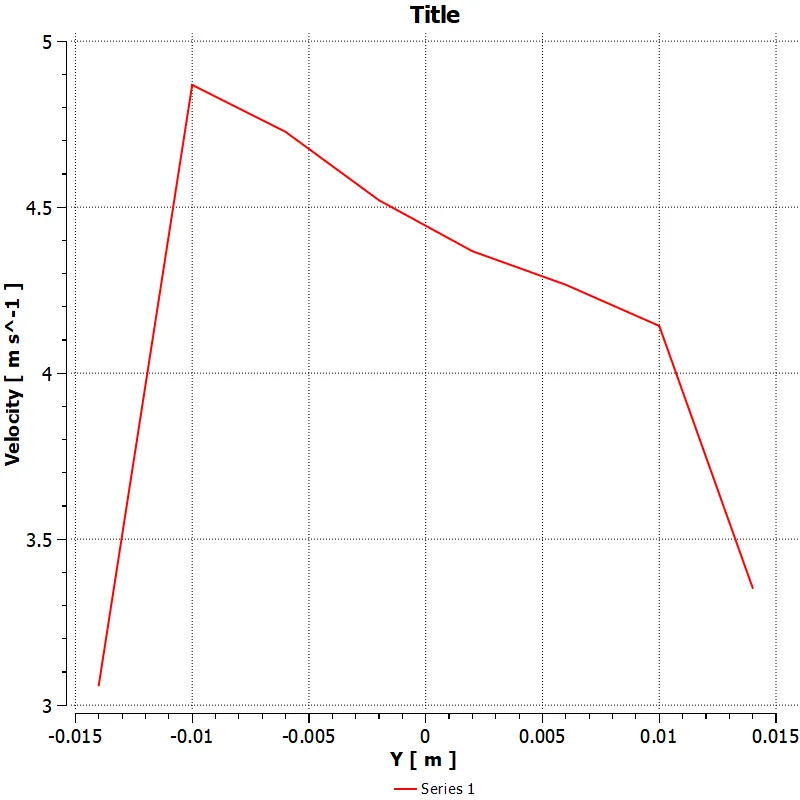
Plot for velocity across pipe at pipe exit
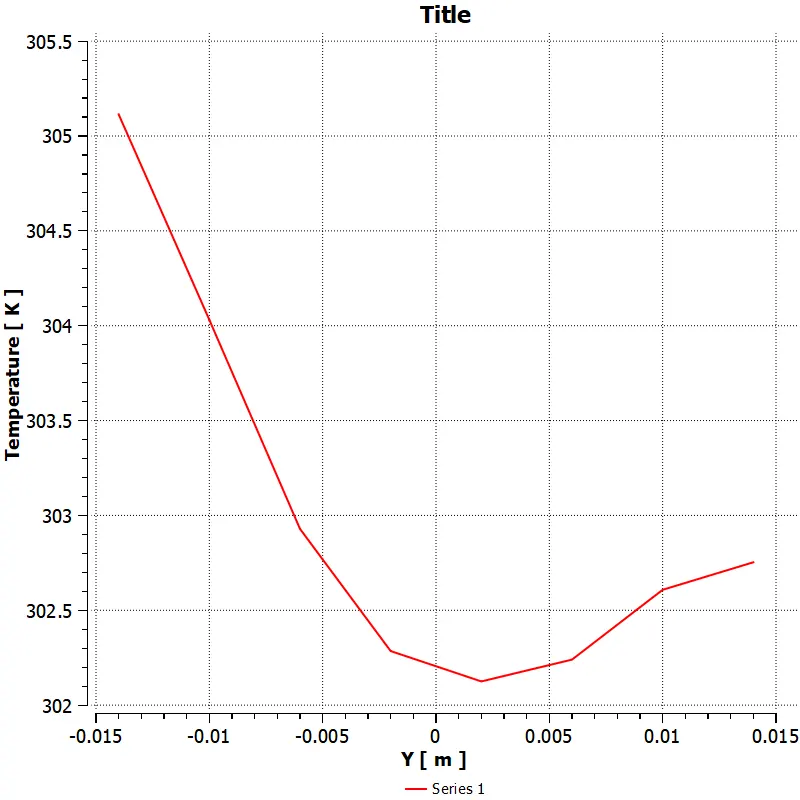
Plot for temperature across pipe at pipe exit
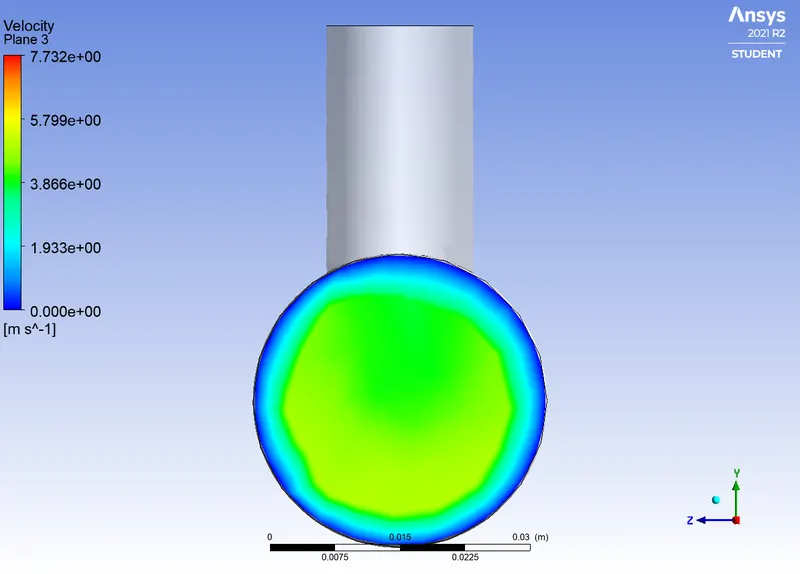
Velocity contour across pipe at exit
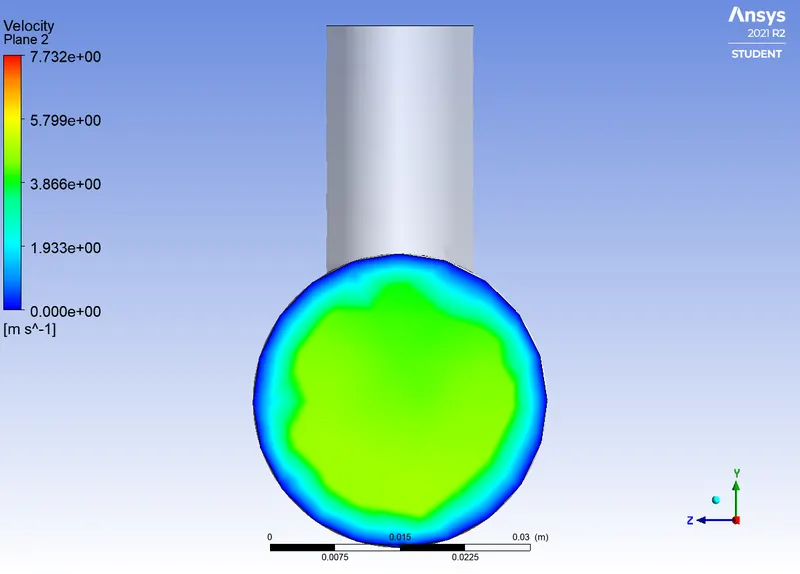
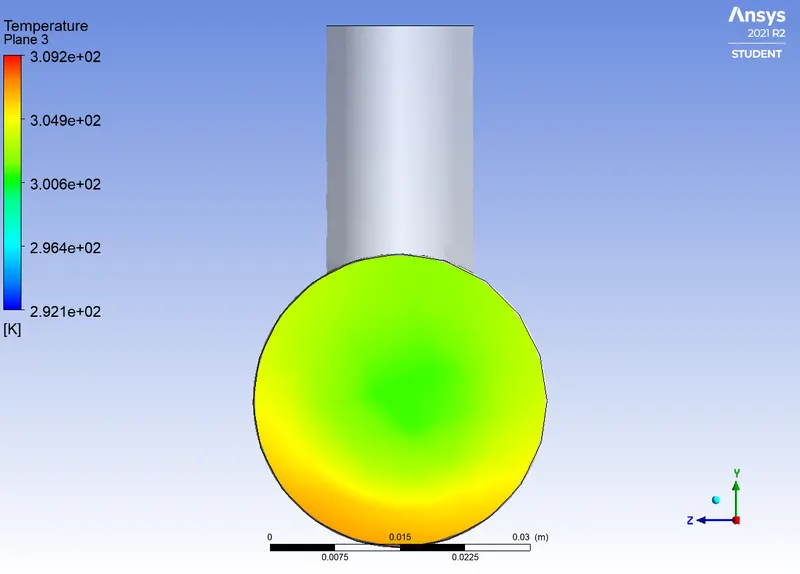
Temperature contour across pipe at exit
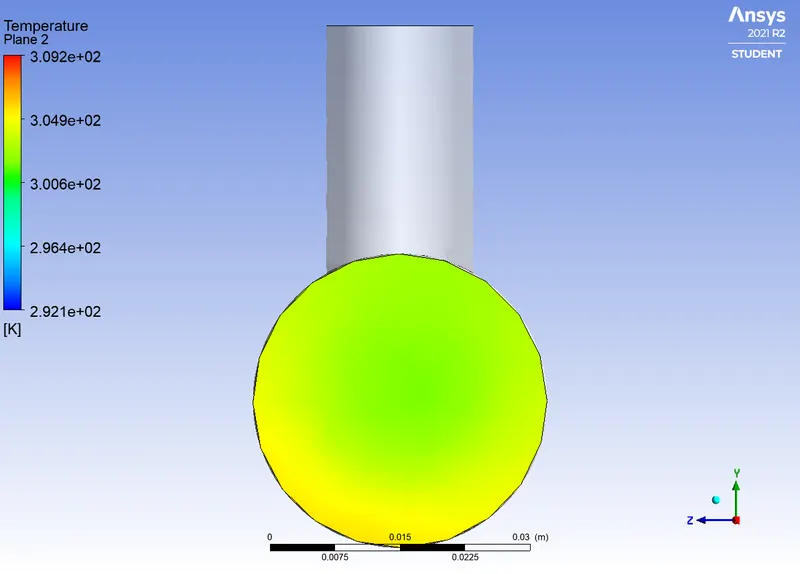
For Momentum Ratio = 4,
Plot for temperature along pipe
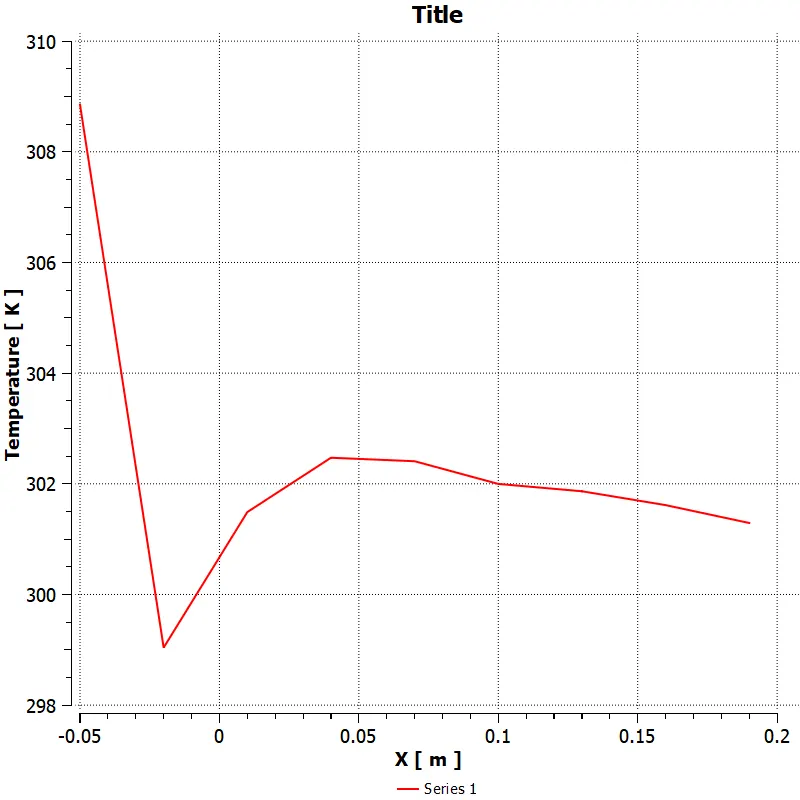
Plot for Velocity along pipe
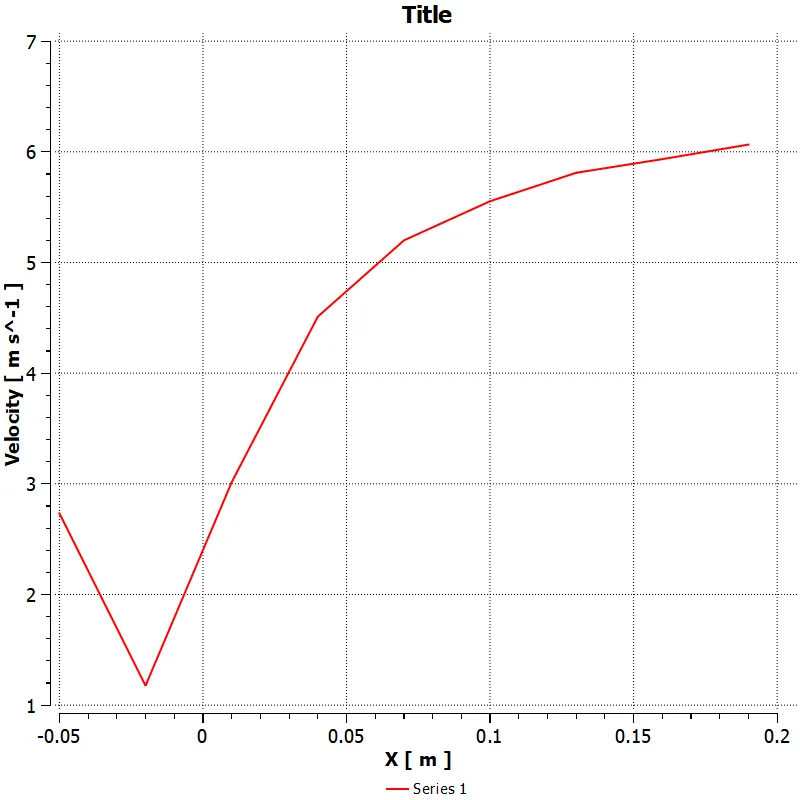
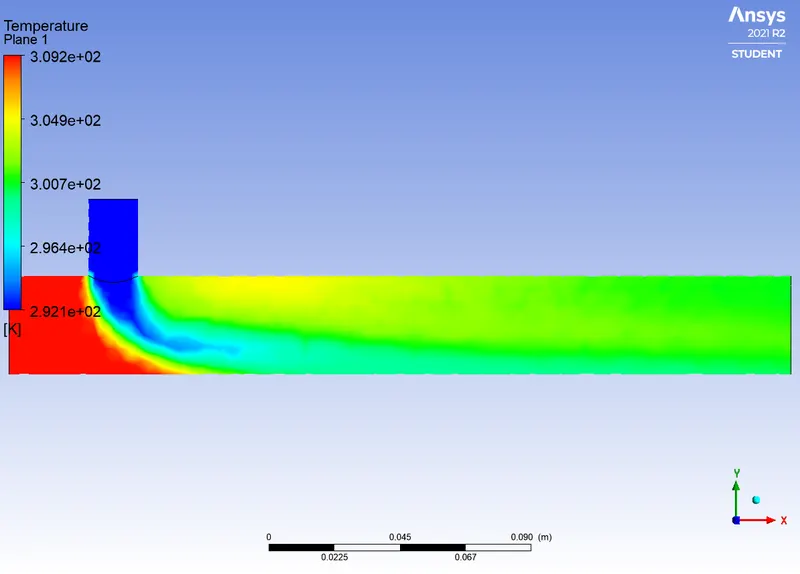
Temperature Contour along pipe
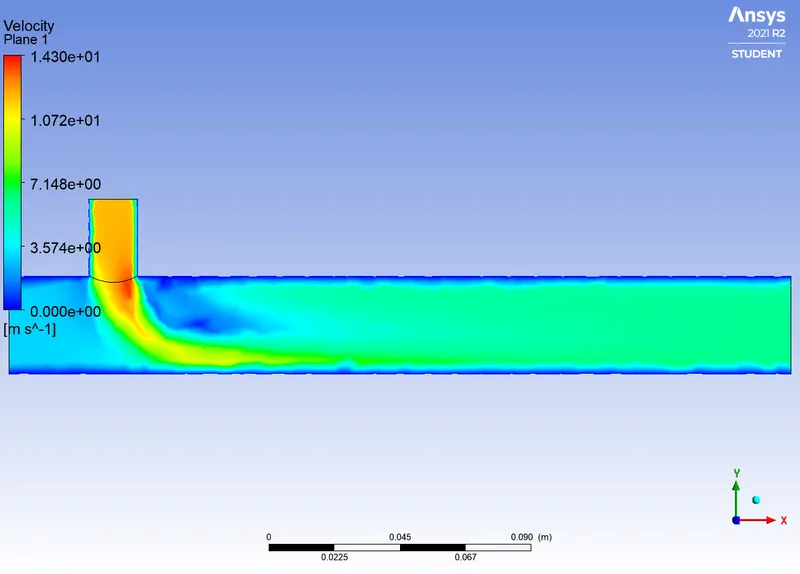
Velocity Contour along pipe
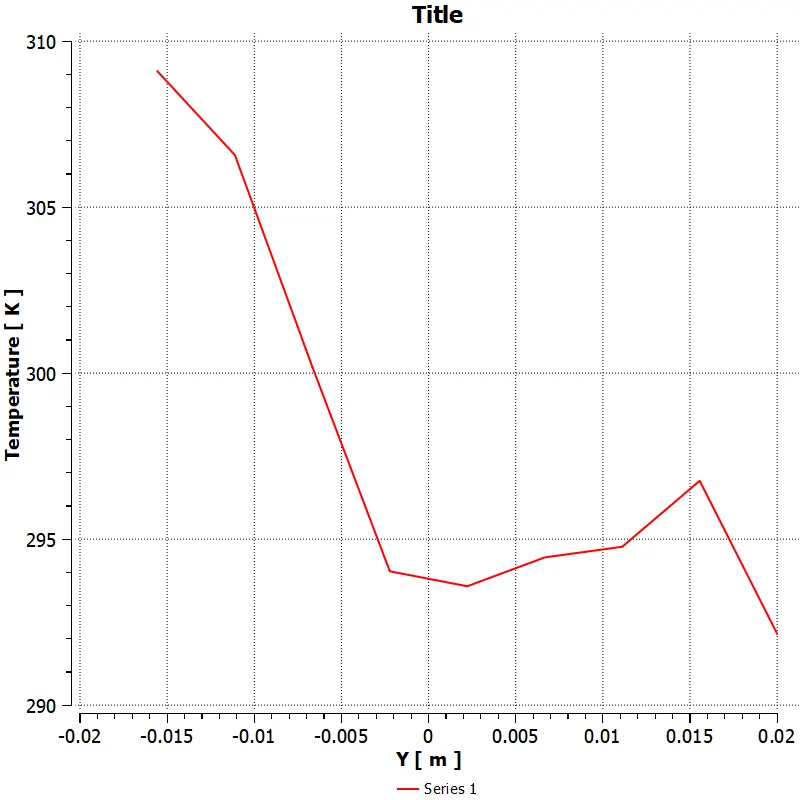
Plot for temperature across pipe at T-inlet
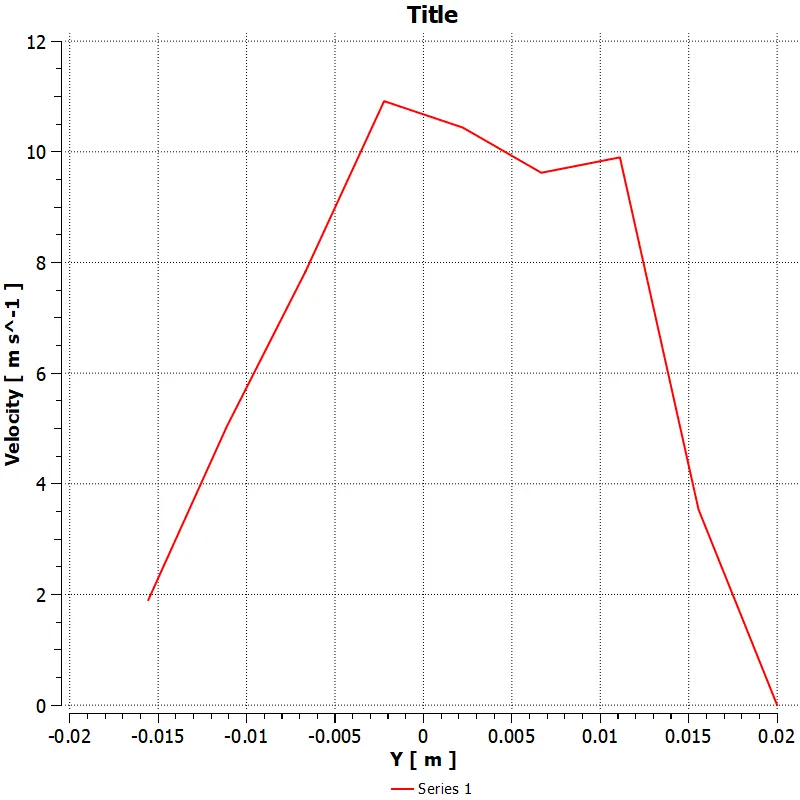
Plot for velocity across pipe at T-inlet
Velocity contour across pipe at T-inlet
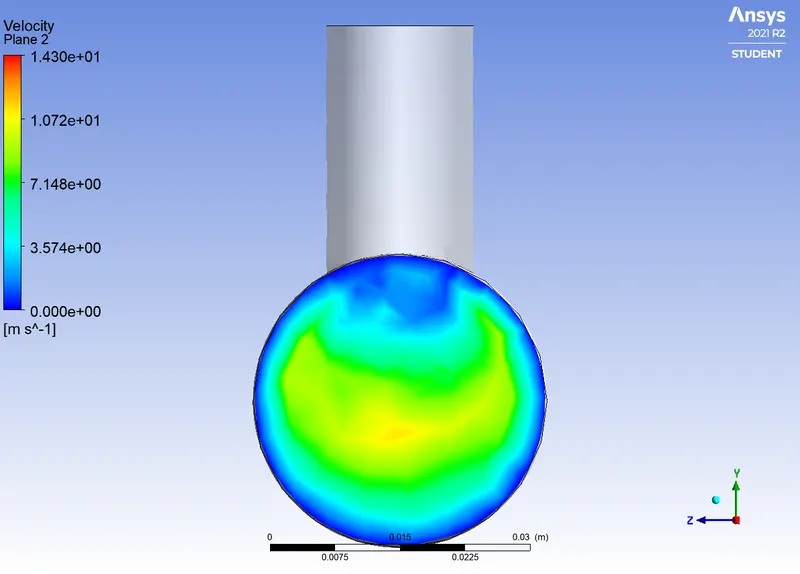
Temperature contour across pipe at T-inlet
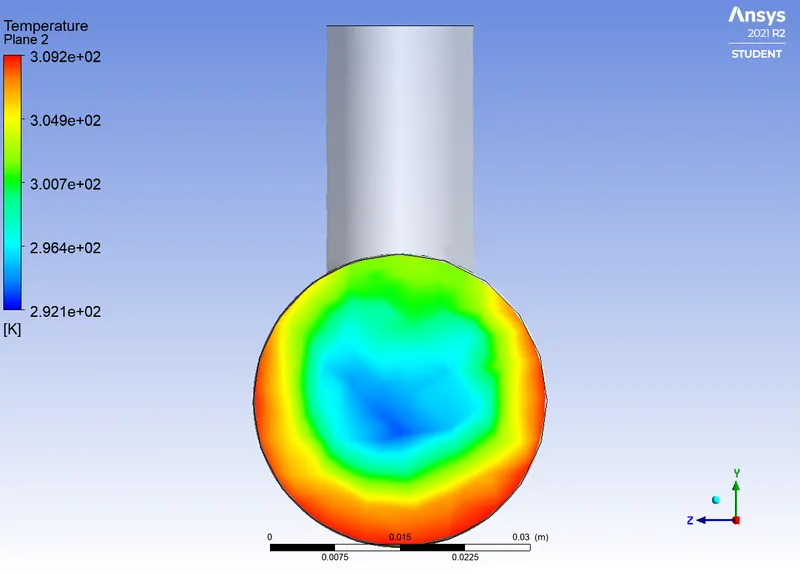
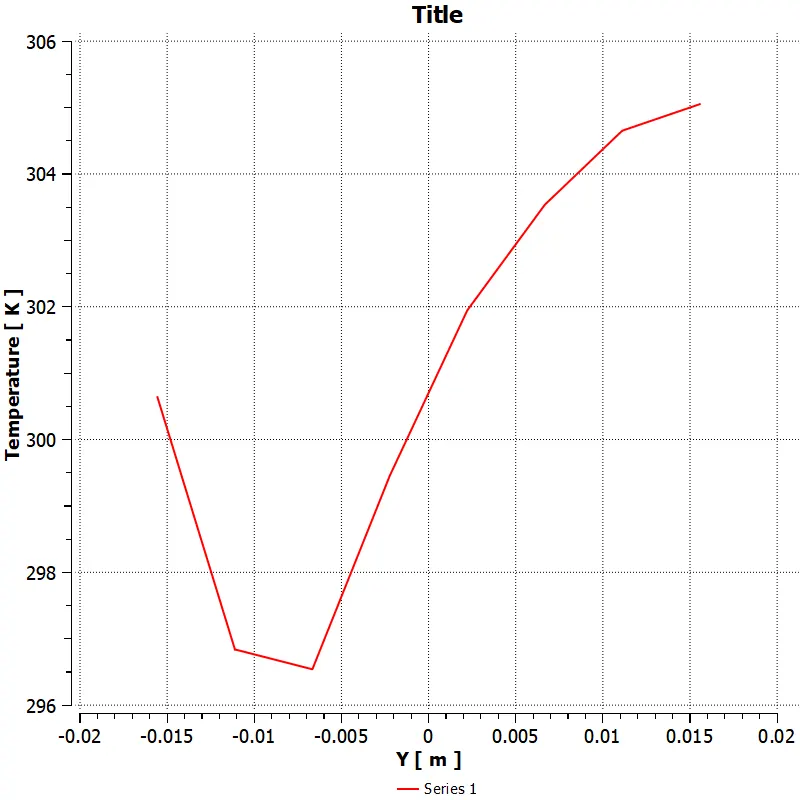
Plot for temperature across pipe at point 1 between T-inlet and pipe exit
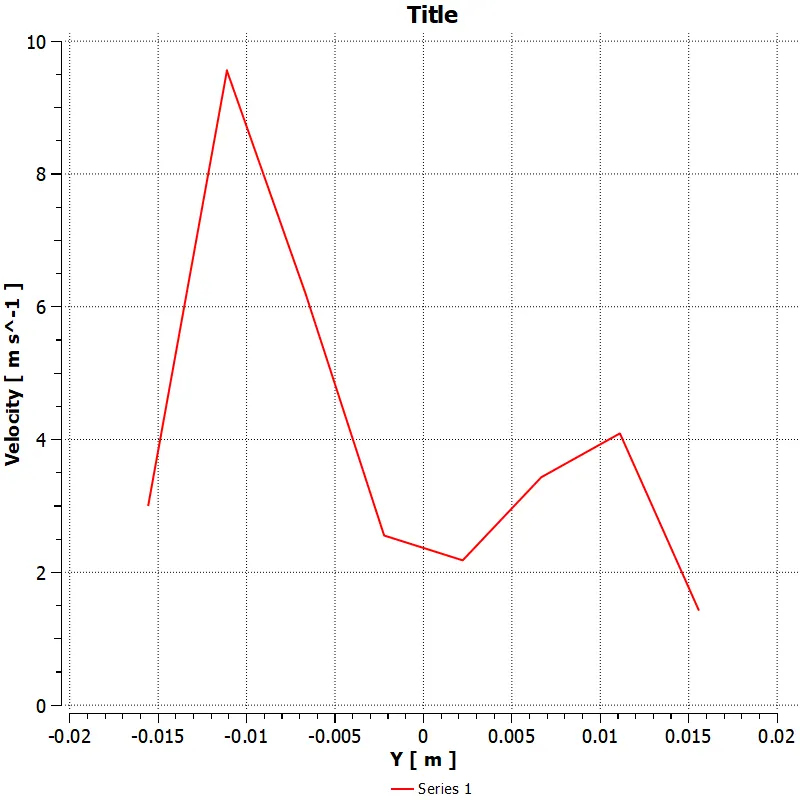
Plot for velocity across pipe at point 1 between T-inlet and pipe exit
Temperature contour across pipe at point 1 between T-inlet and pipe exit
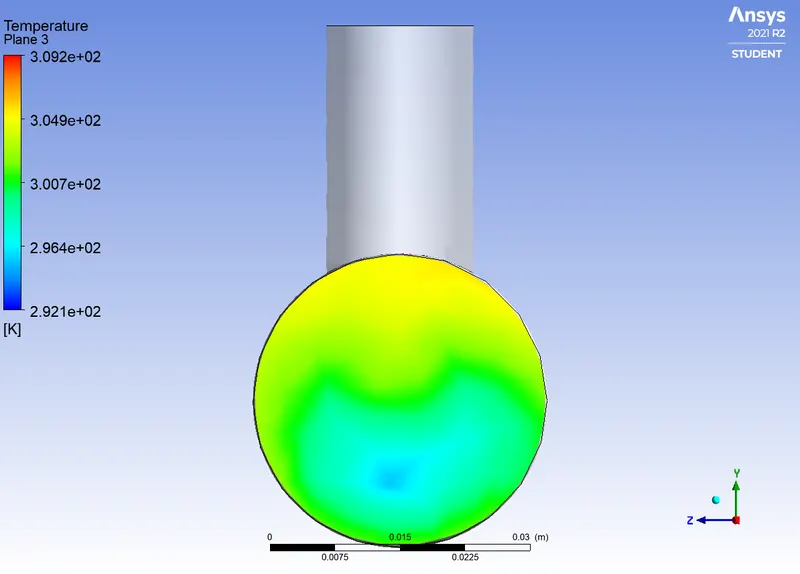
Velocity contour across pipe at point 1 between T-inlet and pipe exit
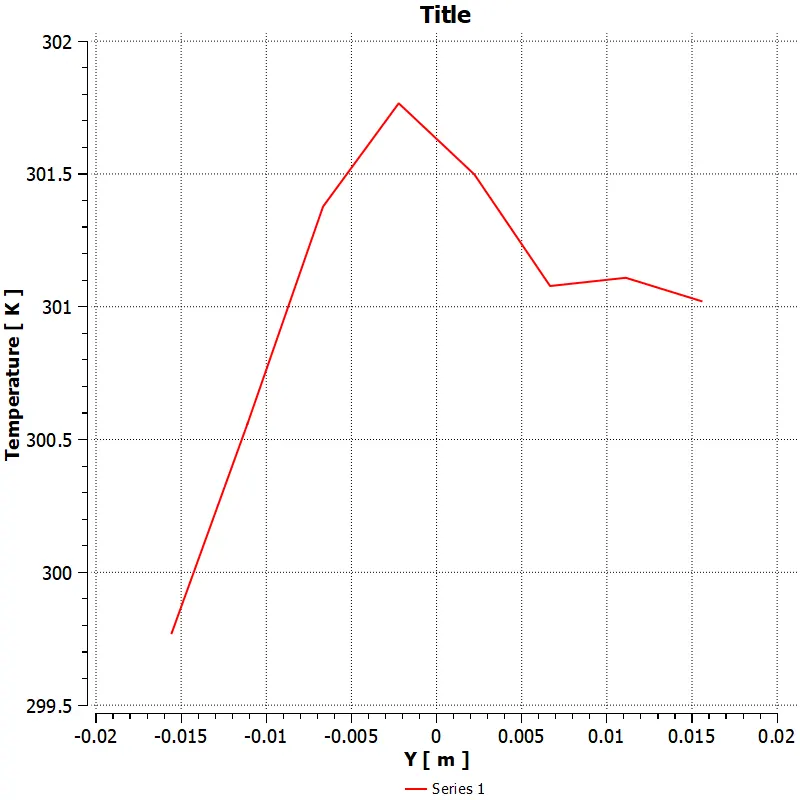
Plot for temperature across pipe at point 2 between T-inlet and pipe exit
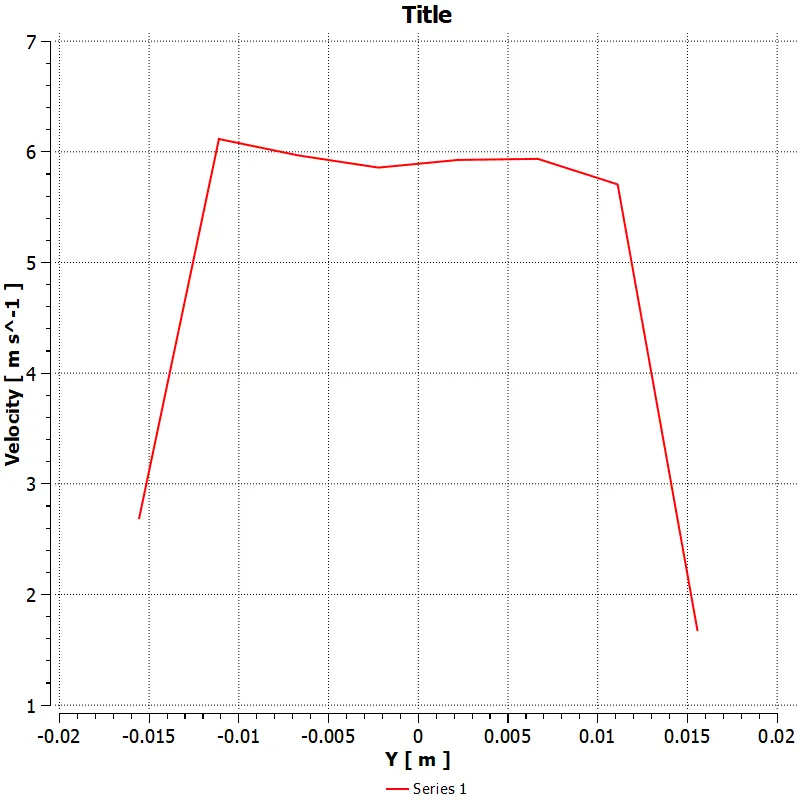
Plot for velocity across pipe at point 2 between T-inlet and pipe exit
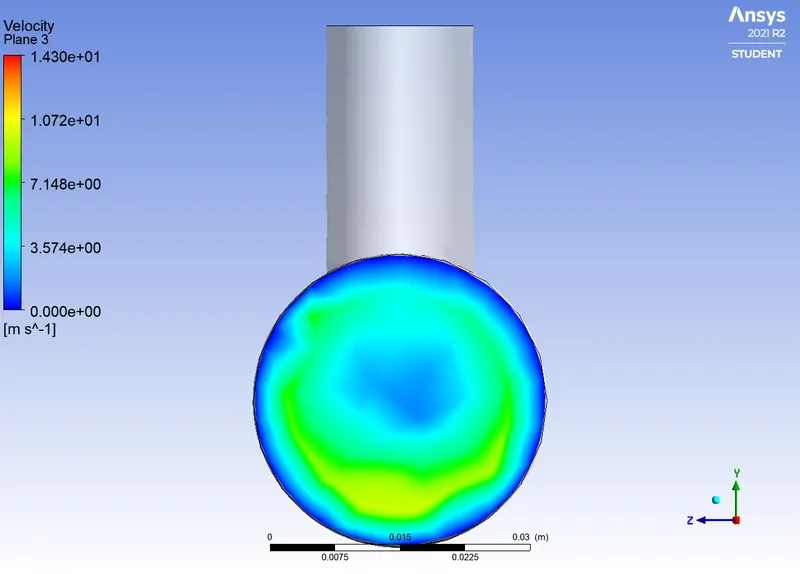
Velocity contour across pipe at point 2 between T-inlet and pipe exit
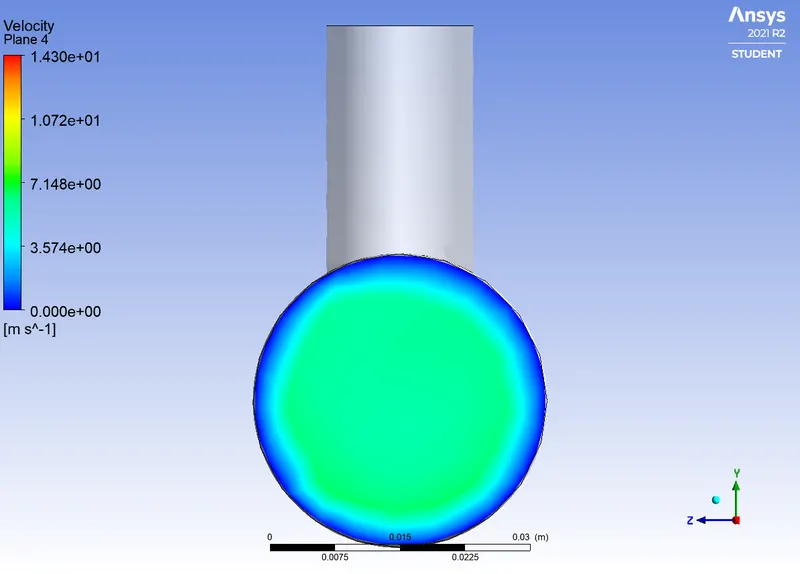
Temperature contour across pipe at point 2 between T-inlet and pipe exit
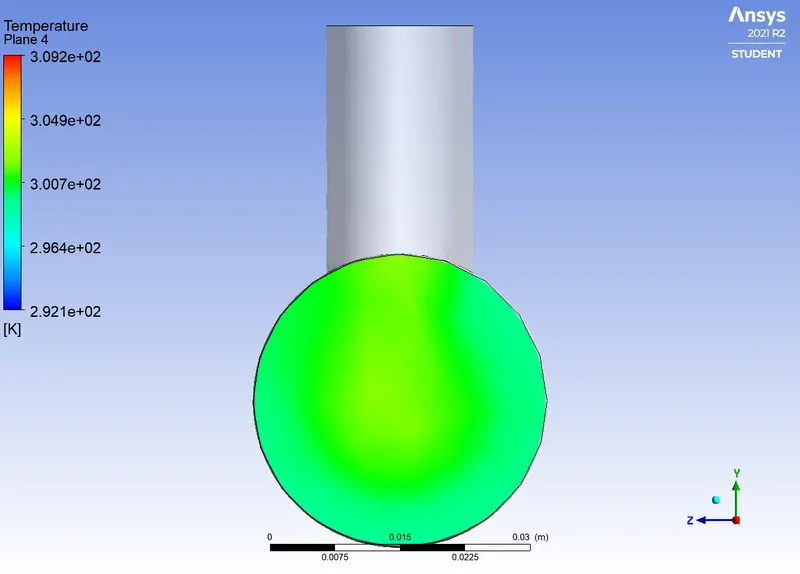
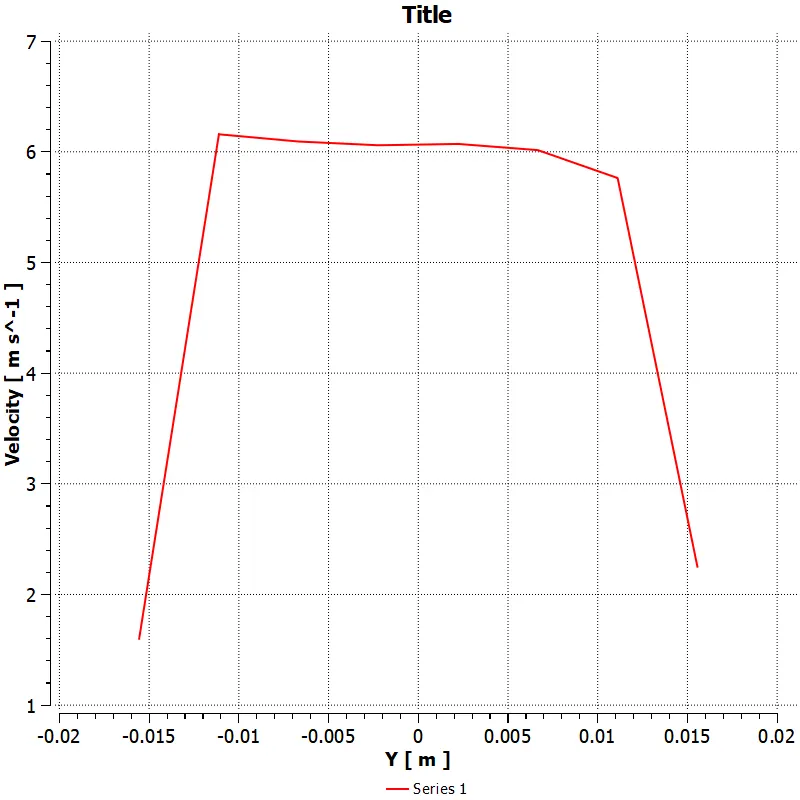
Plot for velocity across pipe at pipe exit
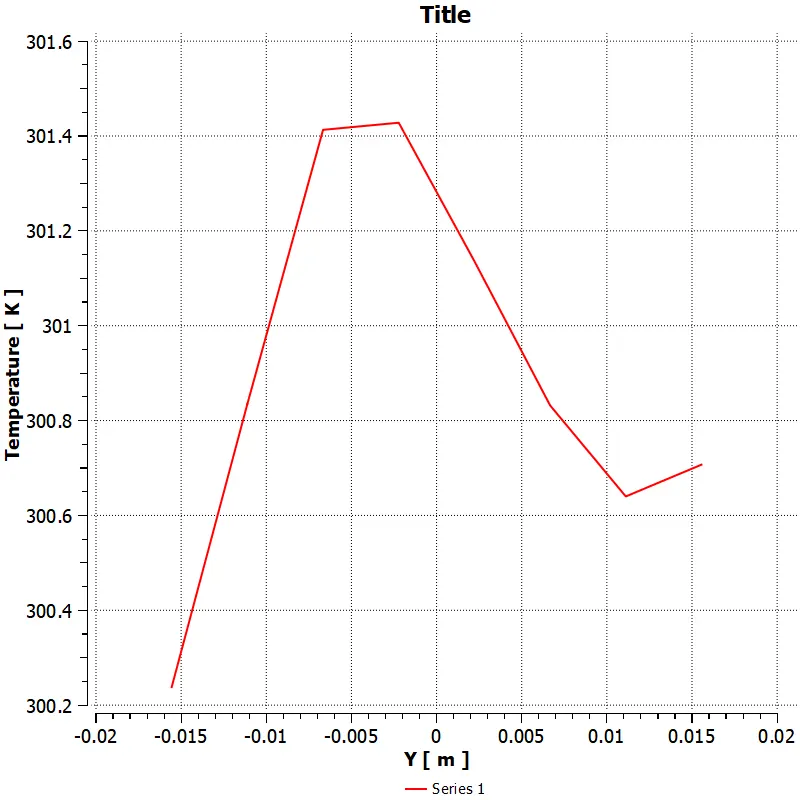
Plot for temperature across pipe at pipe exit
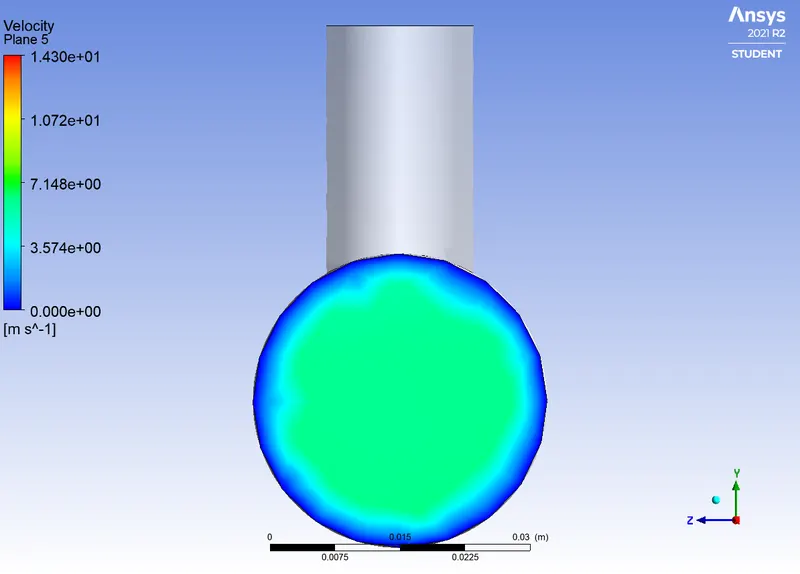
Velocity contour across pipe at exit
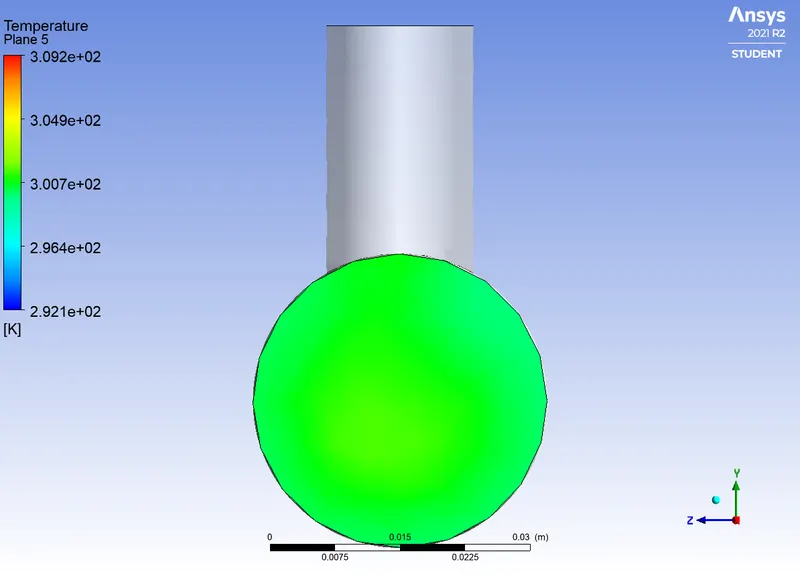
Temperature contour across pipe at exit
Effect of length and Momentum ratio
| Momentum ratio | Pipe length | Outlet temperature |
| 2 | Short | 303.25 k |
| 4 | Short | 300.5 k |
| 2 | Long | 303.25 k |
| 4 | Long | 301.75 k |
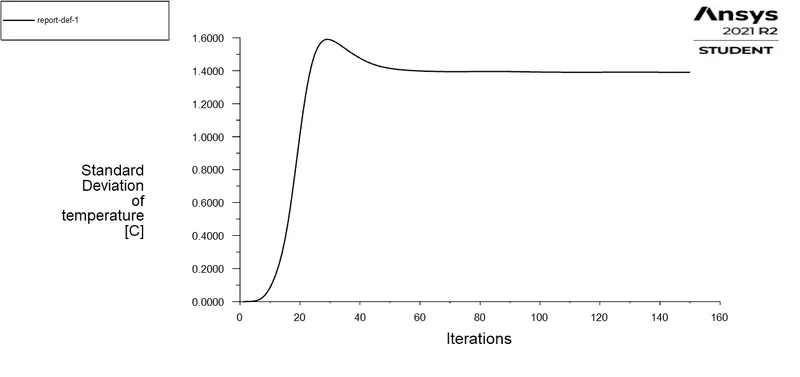
Momentum ratio 4 (short pipe)
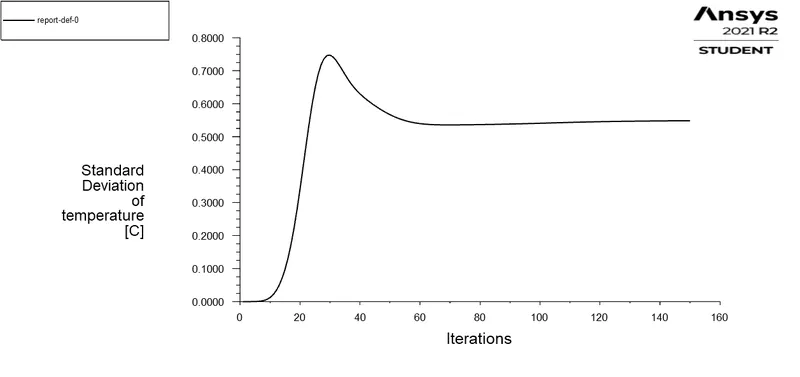
Momentum ratio of 4 (long pipe)
- It can be observed that when the momentum ratio is 4 that is when cold inlet velocity is 12 m/s there is more drop in temperature when compared with momentum ratio of 2 , This is applicable for both the cases. This is due to the fact that when the cold inlet velocity is increased there is more turbulent mixing happening which further reduces the temperature
- So comparing the standard deviation of temperature of short and long pipe of momentum ratio of 4 it was observed that there was less deviation in long pipe. So it is recommended to use long pipe of effective mixing
References
CFD Modeling of a Mixing Tee – Part 2: Predictions of Temperature Fluctuations - Becht