Week 1: Channel flow simulation using CONVERGE CFD
OBJECTIVE:
- Run a channel flow simulation
- show velocity and pressure contour
- check variation velocity ,pressure and mass flow rate at different grid sizes
Channel flow test
channel flow test is a simple simulation to to test velocity and pressure changes inside a hollow pipe in which water is injected at inlet and ejected at outlet. This test is a basic simulation technique used in industries.
Geometry used: A simpe rectangular box shaped geometry is used which resembles to a pipe. geometry setups are done in converge studio.
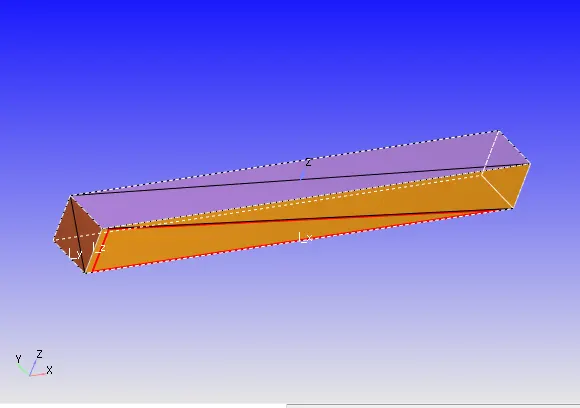
Steps involved in simulation
- geometry is constructed in converge studio
- all the required inputs such as boundary conditions, simulation parameters, and grid sizes are decided in converge studio
- after deciding the inputs, input files are exptracted and simulation runs using cygwin. cygwin is a software which is used to run simulation for converge studio. cygwin gives result in form of binary files
- Binary files we got from cygwin is post converget using converge studio to get final simulation outputs
- velocity contours and pressure contours are seen using paraview. paraview gives us view of how these variables are varying along length and breadth of geometry
Below is screen shot of inputs provided in converge and their explaination why they are used
Run parameters
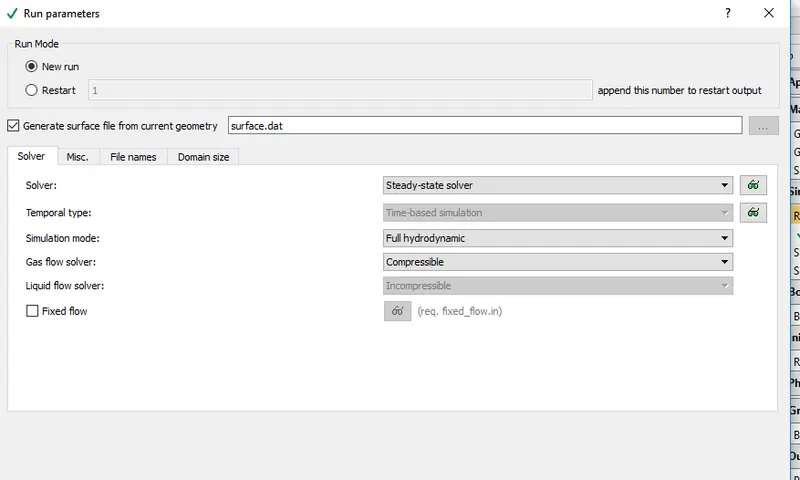
- since our simulation is a simple one we will use here full hydrdynamic, because our geometry is in static condition.
- gas flow should be compressible
- our solver is steady state solver as it does not involves varying time steps
simulation run parameters
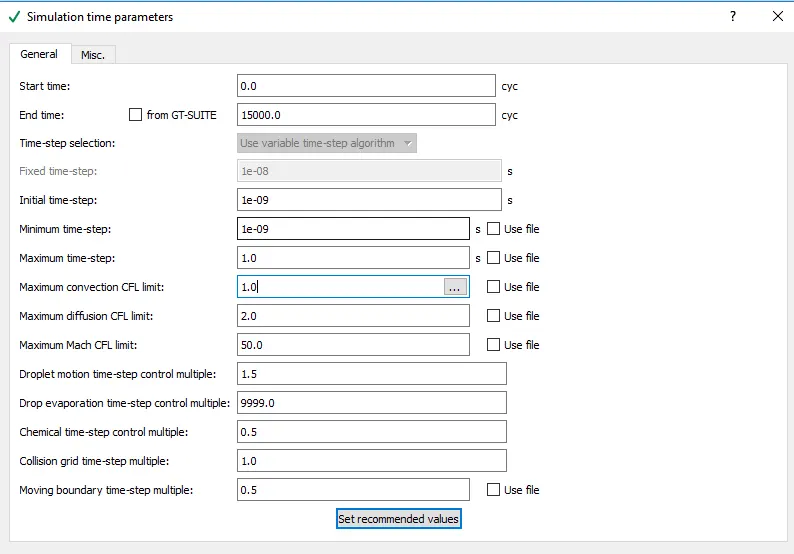
- maximum cfl must be 1 or less than in order to obtain a stable solution
- time steps we have used here is 1e-9, it is better to use small time steps
- start time is 0 and end time is 15000 because we intend to run simulation for 15000 cycles
- all the rest values are default values and need not to be changed
solver parameters
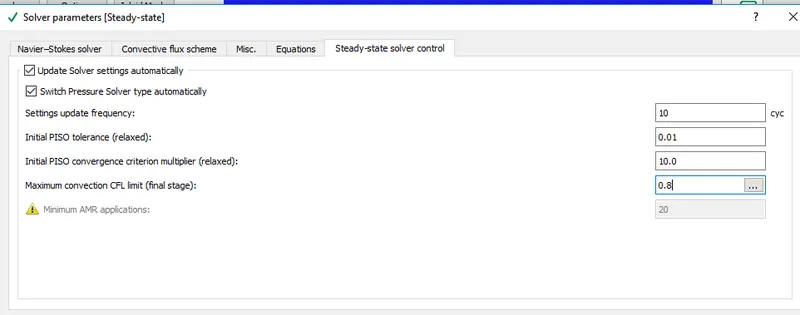
- here also cfl limit value should be less than 1 in order to obtain stable solution
- all the rest values are default values
Boundaries
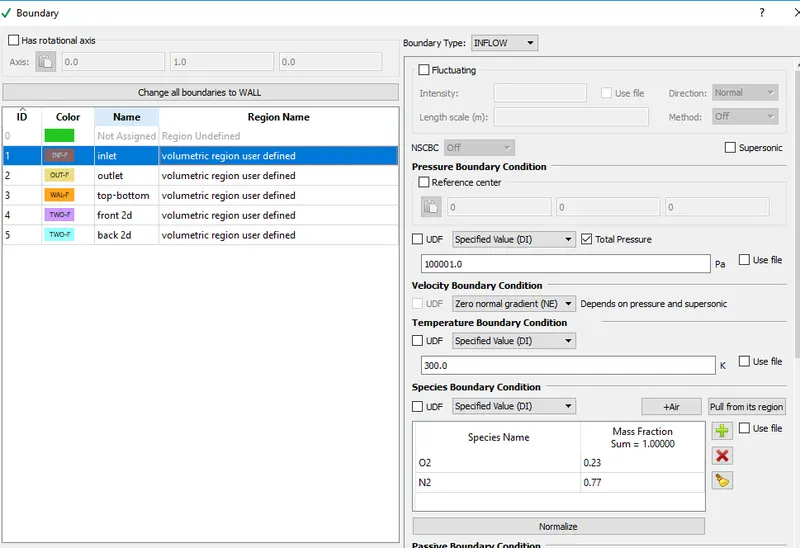
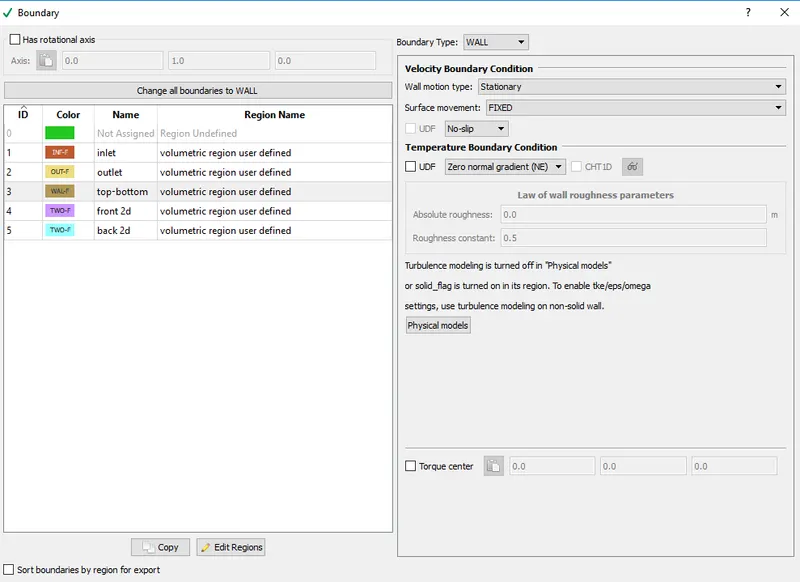
- Inlet - pressure at inlet is 1 pascal more than pressure at outlet so that flow can take place frm inlet to outlet
- Outlet
- Top and bottom are no slip boundaries as there is effect of slip on velocity or pressure
- Front and back boundaries are 2D we have assumed z direction to be very small
regions and initialization
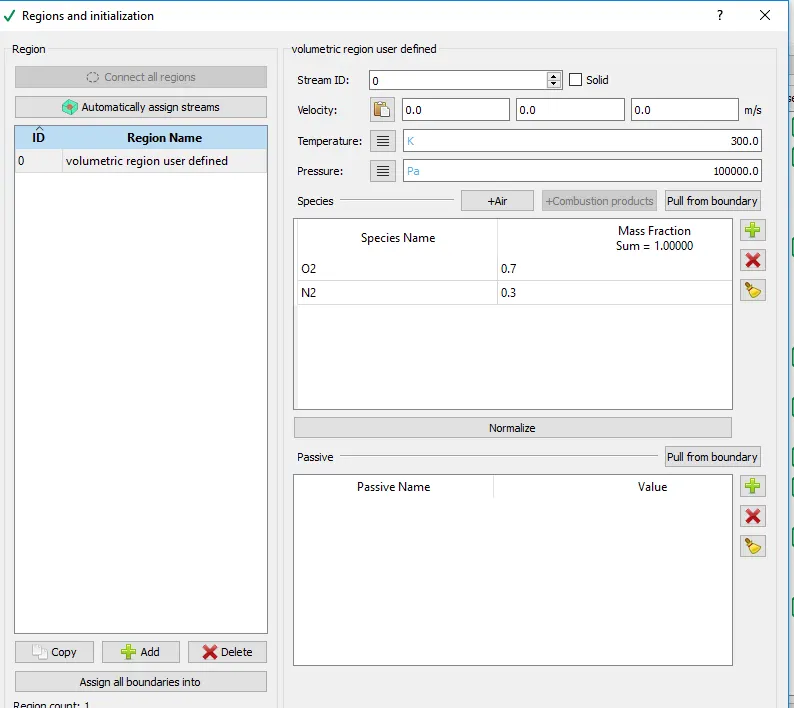
- here gases involved are O2 and N2
- temprature input is 300k
- pressure input is 100000pa
species
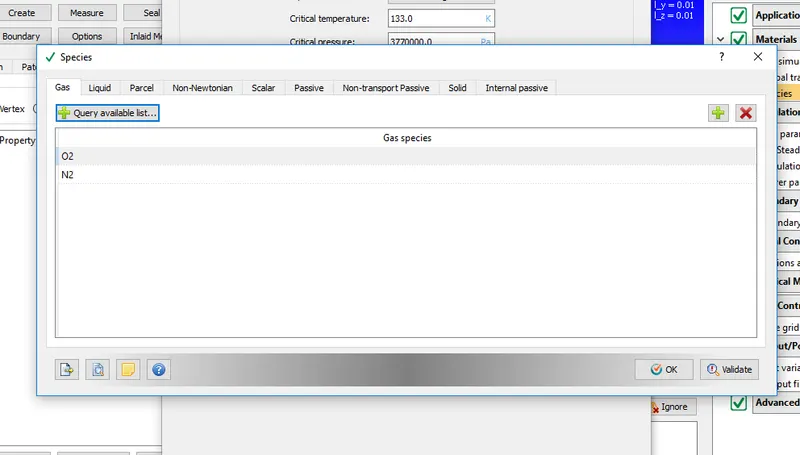
- In species add oxygen and nitrogen
Grid sizes
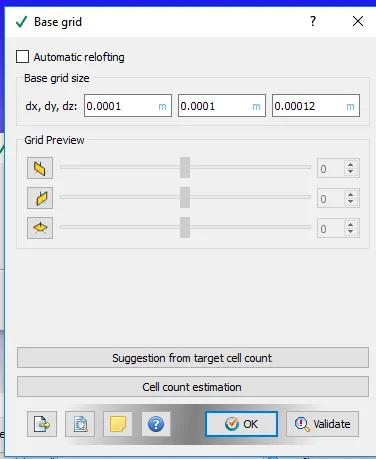
- grid sizes must be changed for every simulation as said in challenge
This is how grids appear in geometry
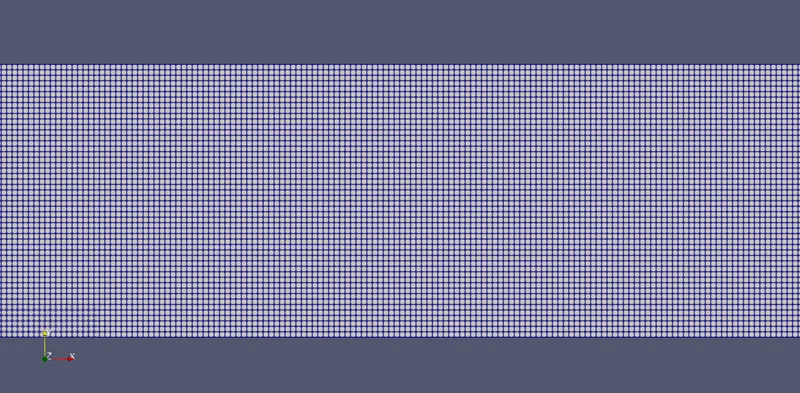
Grid size 2e-4
velocity contour
velocity at inlet
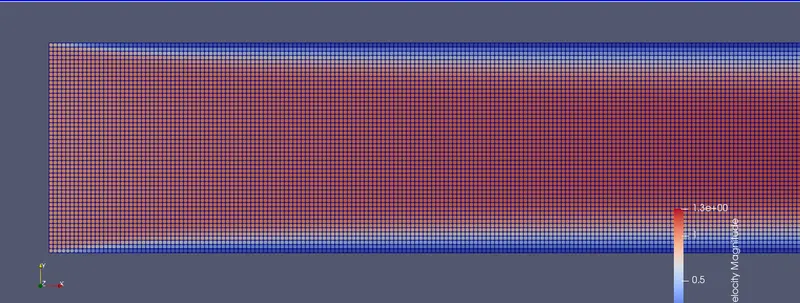
velocity at outlet
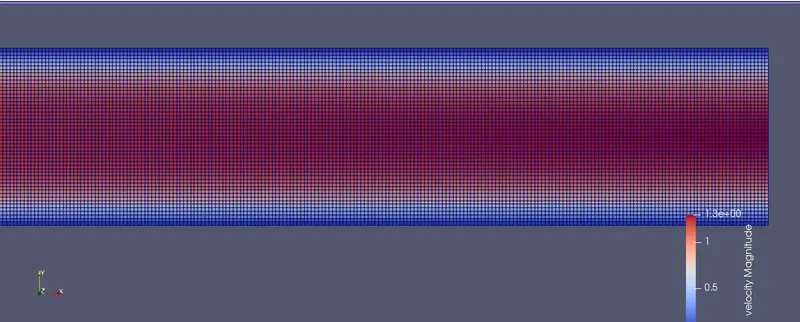
- velocity profile changes from inlet to outlet
- one important phenomenon to be seen here is at boundaries velocity does not changes, this is because boundaries are no slip boundaries
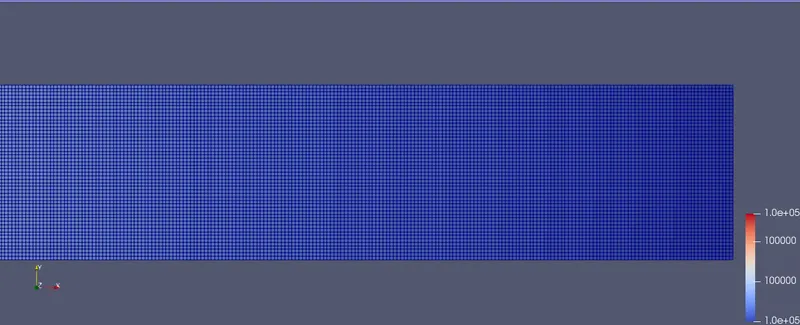
pressure contour
pressure at inlet
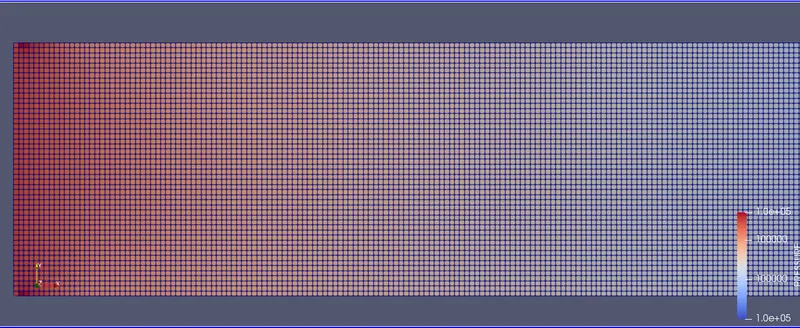
pressure at outlet
PLOTS:
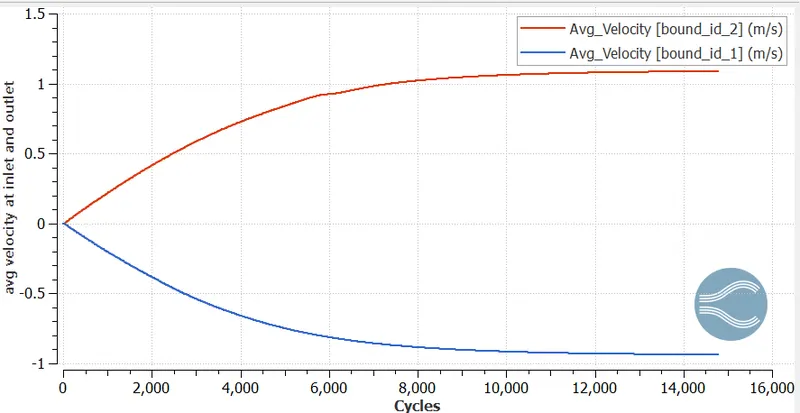
- parabolic graph for velocity at inlet and outlet
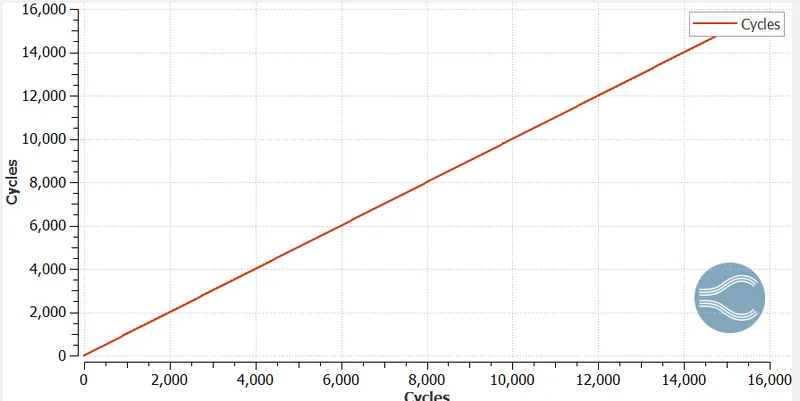
cycles
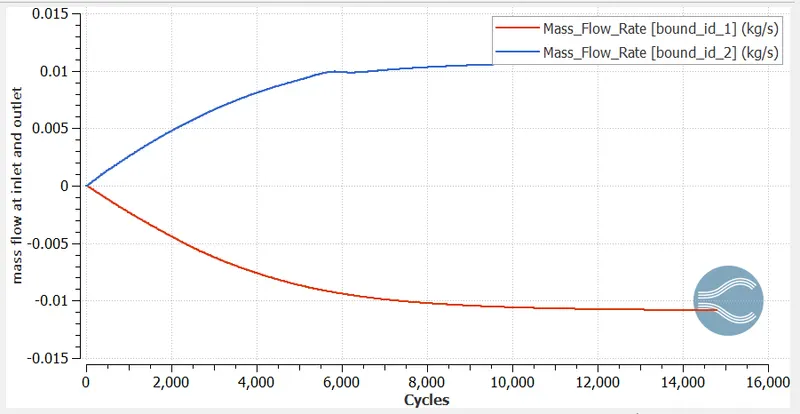
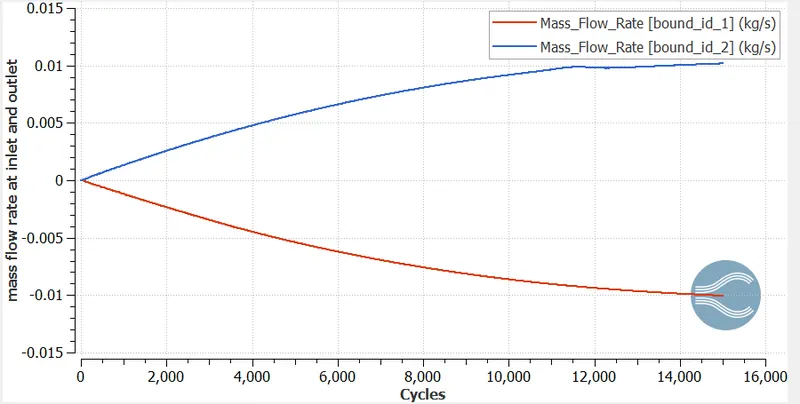
Mass flow rate
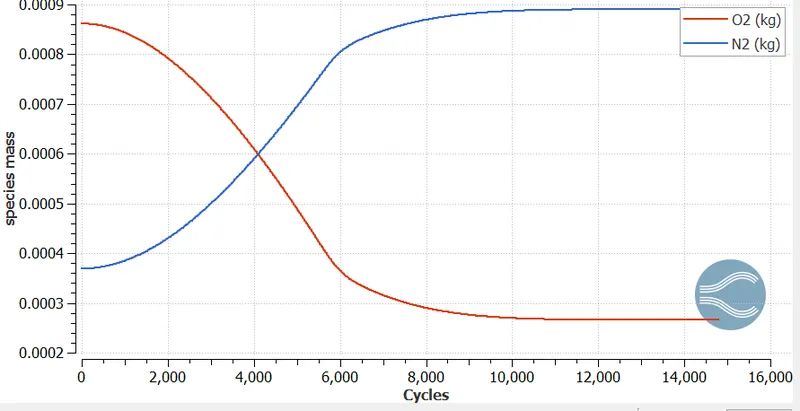
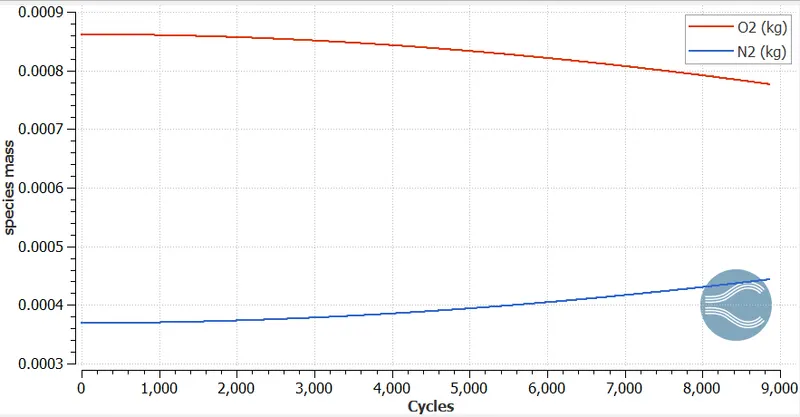
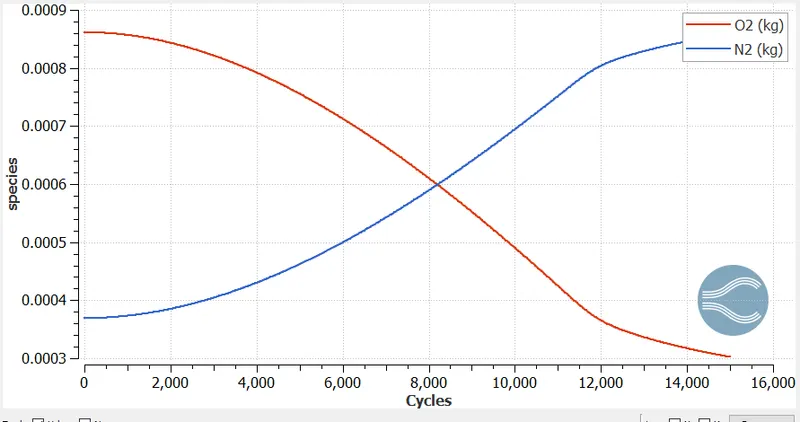
species mass vareiation
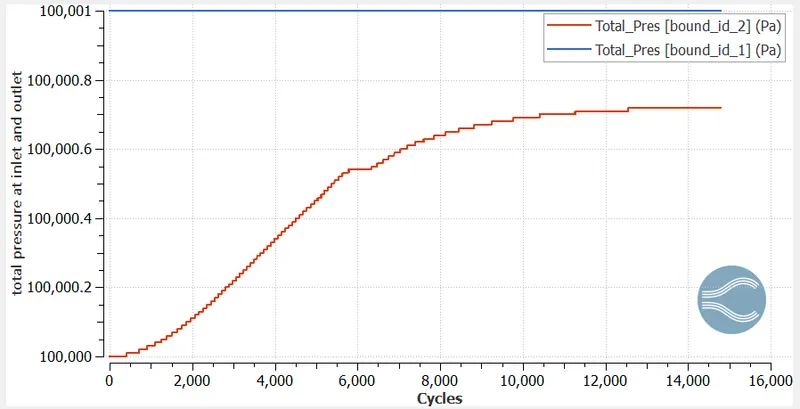
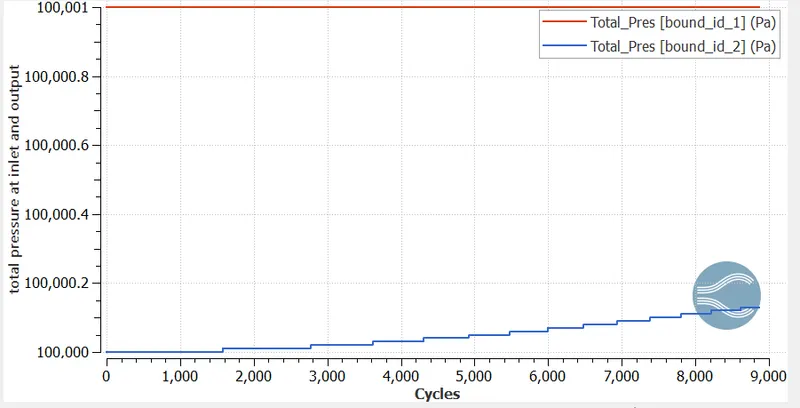
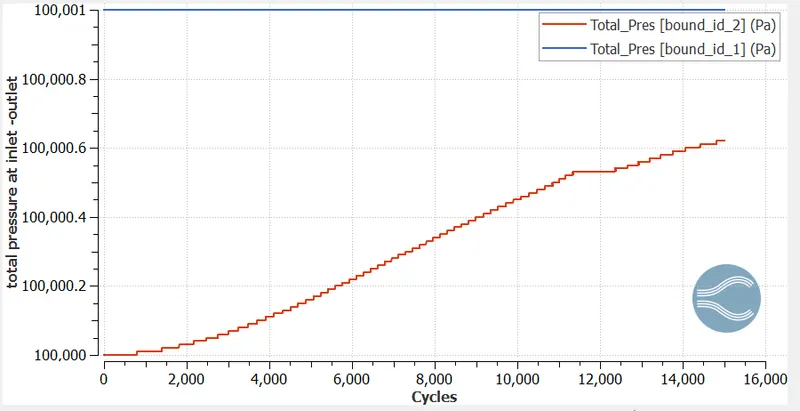
Total pressure at inlet and outlet
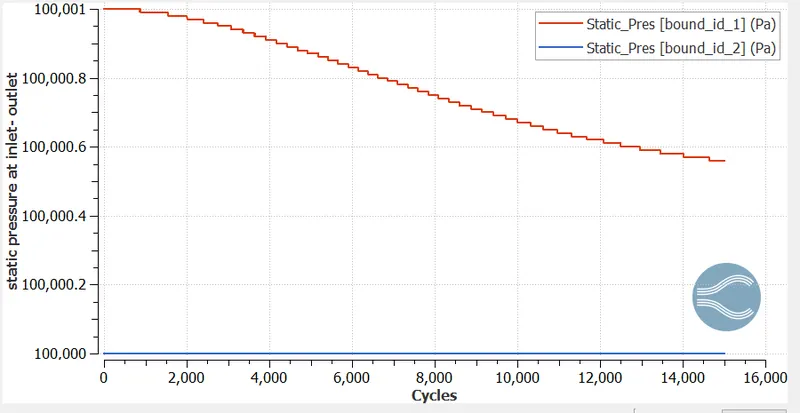
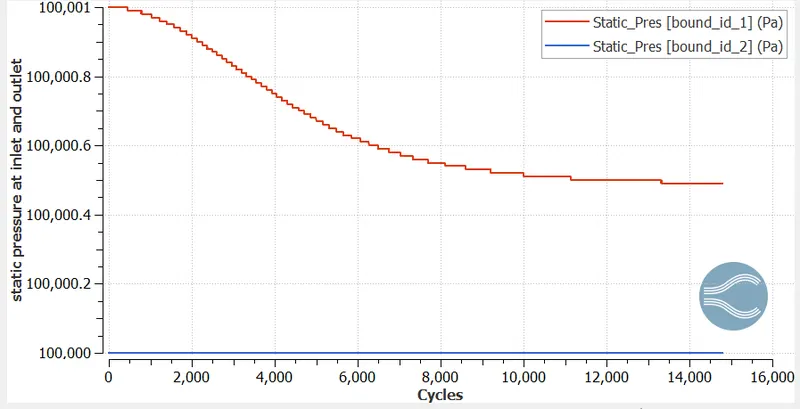
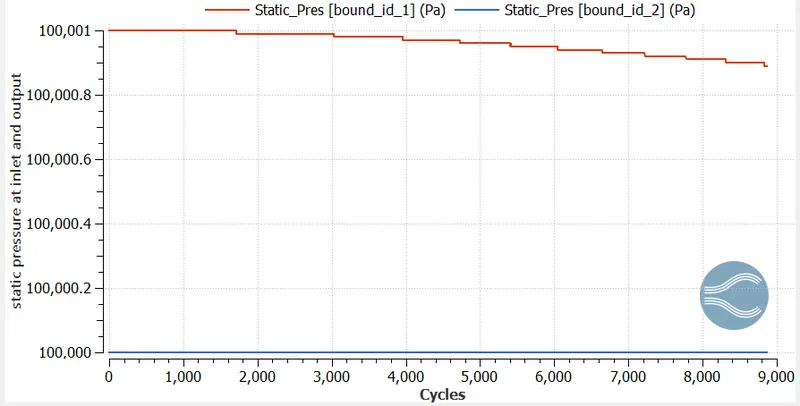
Static pressure at inlet and outlet
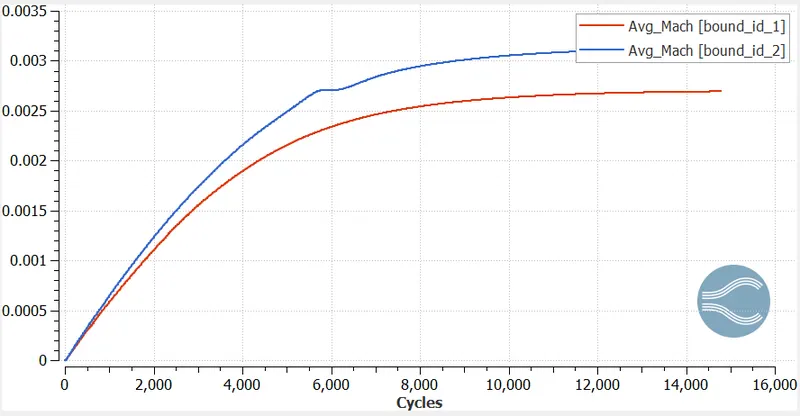
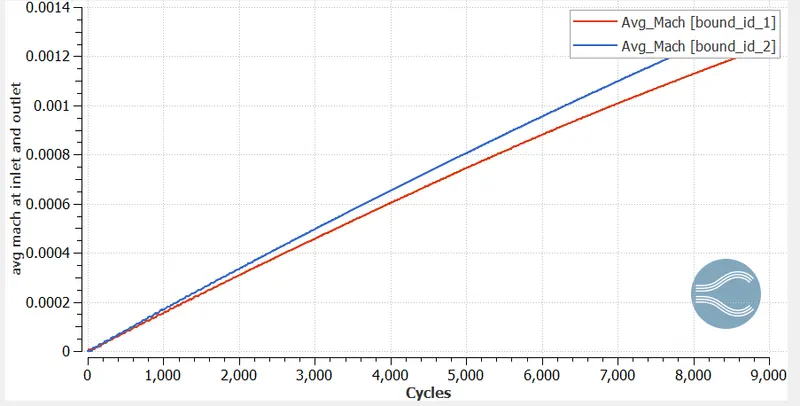
Average mach no
Grid size 1.5e - 4
PLOTS
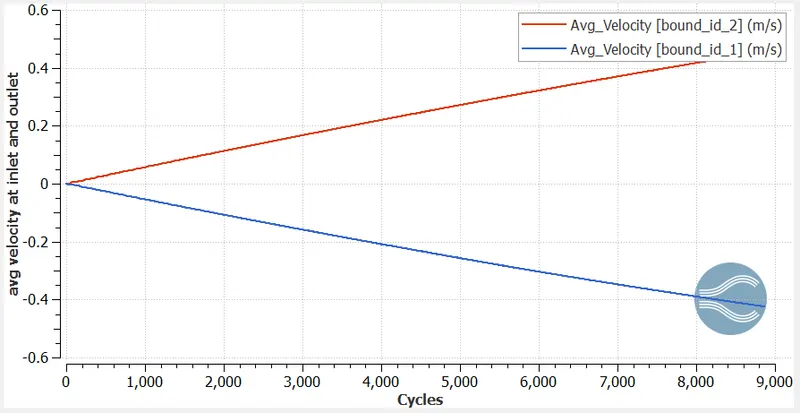
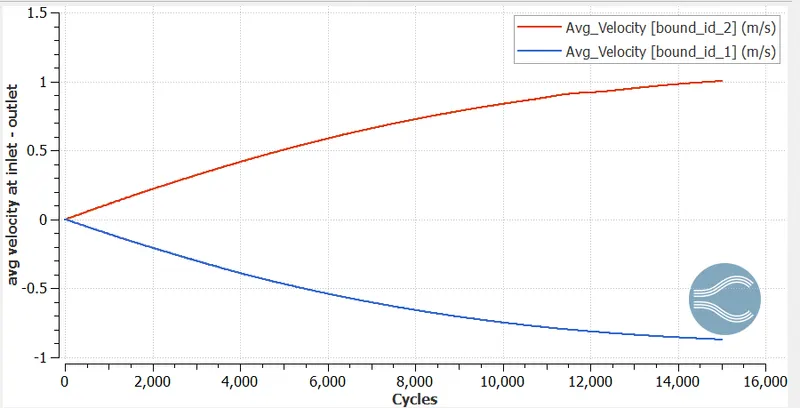
velocity
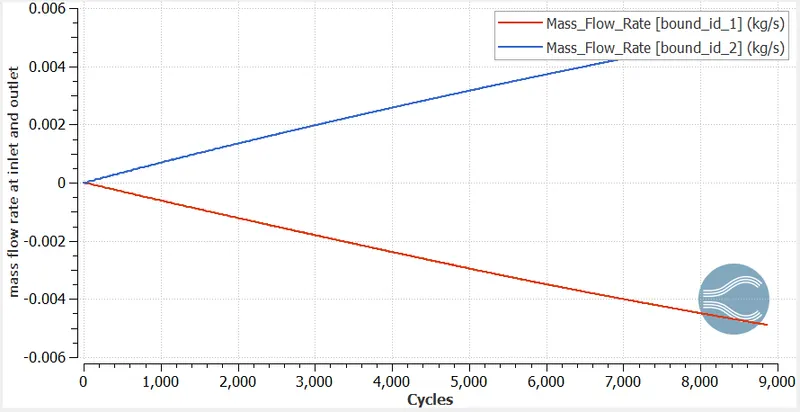
mass flow rate
species
static pressure
total pressure
mach no
Grid size 1e-4
no of cells = 100000
PLOTS
mass flow rate
velocity
species
presssure
static pressure