Vehicle Dynamics - Lateral Brush Tire Model using MATLAB
AIM: To plot the following graphs based on given inputs using MATLAB
i) Lateral Force v/s Slip Angle
ii) Aligning Momennt v/s Slip Angle
OBJECTIVE: To write a error-less MATLAB code for plotting the required graphs
GIVEN:
1. Normal load, `F_z = 5000N`
2. Coefficient of friction, `mu = 0.9`
3. Length of contact patch, `l_t = 0.2m`
4. Cornering stiffness, `C_a = 50000N/(rad)`
GOVERNING EQUATIONS:
1. Critical Slip, `alpha_c = (mu*F_z)/(2*C_a)`
2. Lateral stiffness, `k_y = 2*C_a/l_t^2`
3. Lateral force:
(i) when `alpha < alpha_c`
`=> F_y = C_a*alpha`
(ii) when `alpha >alpha_c`
`=> F_y = mu*F_z - (mu*F_z)^2/(4*C_a*tan(alpha))`
4. Aligning moment:
(i) when `alpha < alpha_c`
`=> M_z = (C_a*l_t*alpha)/6`
(ii) when `alpha >alpha_c`
`=> M_z = (mu*F_z)^2/(12*l_t*k_y*tan(alpha))*(3-2*mu*F_z)/(l_t^2*k_y*tan(alpha))`
MATLAB Code:
clear all
close all
clc

%inputs
Fz = 5000;          %normal load in N
mu = 0.9;           %coeff of friction
lt = 0.2;           %length of contact patch in m
Ca = 50000;         %cornering stiffness in N/rad

ky = 2*Ca/(lt^2);   %lateral stiffness
alphac = mu*Fz/(2*Ca);      %critical slip in radians

for i = 1:151
    alpha(i) = (i-1)*0.1*pi/180;
    if alpha(i) < alphac
        Fy(i) = Ca*alpha(i);
        Mz(i) = Ca*lt*alpha(i)/6;
    else
        Fy(i) = mu*Fz - (mu*Fz)^2/(4*Ca*tan(alpha(i)));
        Mz(i) = (mu*Fz)^2/(12*lt*ky*tan(alpha(i)))*(3-2*mu*Fz/(lt^2*ky*tan(alpha(i))));
    end
end

%plotting the graphs
figure(1)
subplot(1,2,1)
plot(alpha*180/pi,Fy)
xlabel('Slip Angle (deg)')
ylabel('Lateral Force (N)')
title('Lateral Force v/s Slip Angle')
grid on

subplot(1,2,2)
plot(alpha*180/pi,Mz)
xlabel('Slip Angle (deg)')
ylabel('Aligning Moment (N)')
title('Aligning Moment v/s Slip Angle')
grid on

saveas(1,'brushtiremodel1','jpeg')
Coding Logic:
The tire behaves differently along the contact patch depending upon the slip angle. Until the critical angle it sticks to the ground due to the adhesiveness between the tire molecules and the aggregrates on the ground. After the critical angle, the wheel starts to slide.
The slip angle determines the lateral force and aligning moment. I.e., they both have different formulas at different conditions.
To inheret this in our matlab code, we make use of 'if-else' conditional statement. We define a range of slip angle and determine values of 'Fy' and 'Mz' for all values of slip angle using a for loop.
OUTPUT:
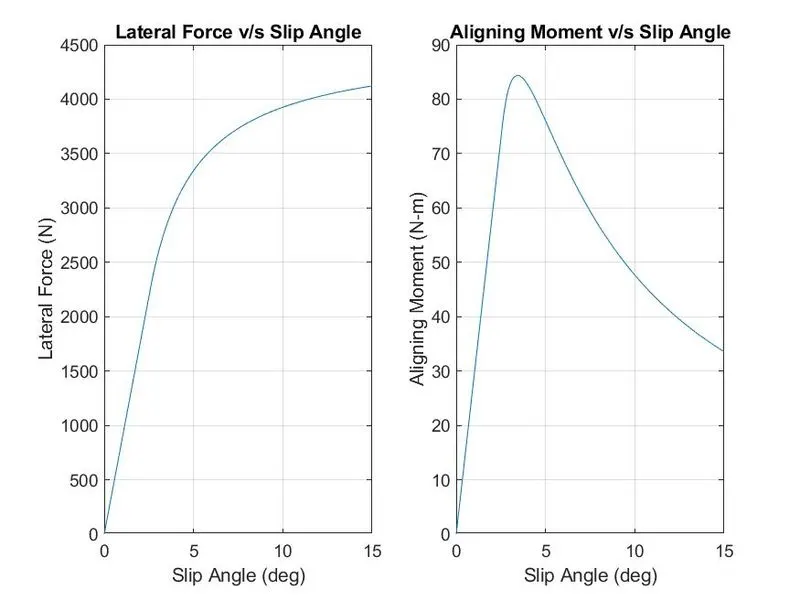
Inference from the plot:
1. From plot 1, we can see that the Lateral force increases with slip angle. It is a straight line until the critical slip and then behaves hyperbolic until the maximum value of slip angle.
2. From plot 2, the aligning moment also increases in straight line until the critical slip angle and after the critical slip angle it decreases.
CONCLUSION: Both the plots have plotted successfully using an errorless MATLAB code.