Parsing NASA thermodynamic data using MATLAB
AIM: To write a MATLAB code that reads the data from a given text data file and perform the given objectives.
OBJECTIVES:
- Write a function that extracts the 14 co-efficients and calculates the enthalpy, entropy and specific heats for all the species in the data file.
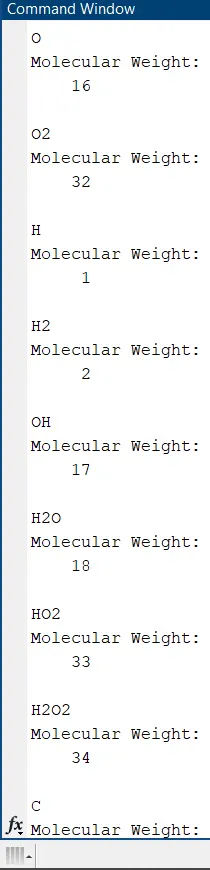
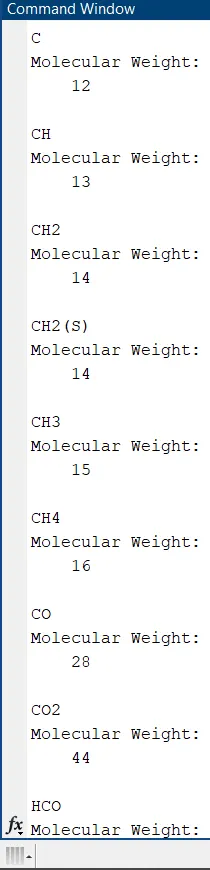
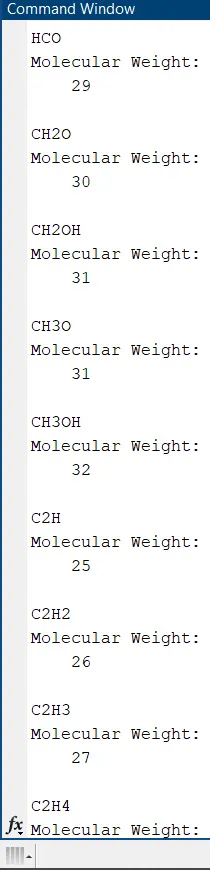
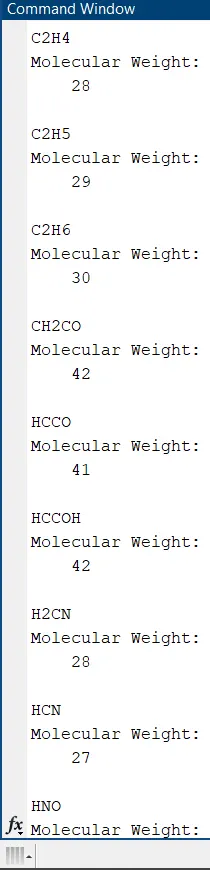
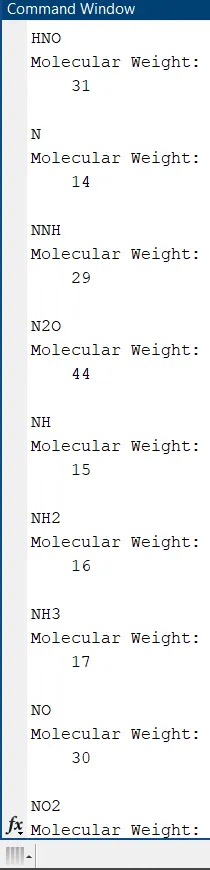
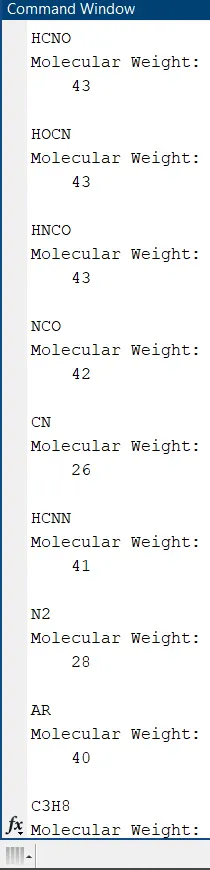
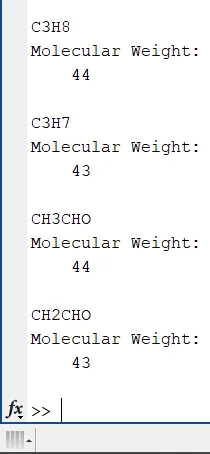
- Calculate the molecular weight of each species and display it in the command window.
- Plot the Cp, Enthalpy and Entropy for the local temperature range (low temperature : high temperature) specific for each species.
- Save the plots as images with appropriate names and dump them in separate folders for each species with suitable name. All these should be generated automatically.
INTRODUCTION:
NASA came up with polynomials that can be used to evaluate thermodynamic properties such as Cp, H and S. They have also documented the co-efficients that are required to evaluate these polynomials for 1000+ species.
The document of these coefficients for respective species has been given to us in text format file. We will be reading the data from this file and complete the given objectives.
File Parsing: File parsing refers to the process of reading the information or data given in a particular file. With file parsing we can read, write, and sometimes modify the data of a given file with the use of our programming language. The data from a given file can be used in our programs to perform operations or determining new data.
Here, we are given the ‘THERMO.dat’ file. Which is a text file and contains the thermodynamic data of various species. The main data is nothing but the coefficients that are required to evaluate the polynomials which are then used to determine the thermodynamic properties like Cp, H and S.
The polynomials that NASA uses to calculate these properties are given below:

PROCEDURE:
1. For the main program which determines data for all the species:
- First open the given data file using the command ‘fopen()’ which takes the name of the file as the main argument. Assign this command to a variable. Note that this variable’s value does not show any information from the file. This variable is a pointer to the file.
- We read the information from the file line by line. This is done by writing the command ‘fgetl()’ which reads the current line of the file and returns a character array containing all the characters of the current line. This command returns the next line every time it is written in the program.
- In the given data file, the first two lines tell the information about the global temperature. We record this data with the process which is discussed further points. The next three lines are just comments and we don’t want this data so, we skip these lines by just writing ‘fgetl()’ command which will store the value in default ‘ans’ variable. We also write ‘clear ans’ which remove the ‘ans’ from our workspace (this is totally optional).
- As mentioned in the previous point, first two lines are global temperature information. In fact, only the second line shows values of the temperature. The highest, lowest and middle values being the high, low and mid temperatures respectively.
Before skipping the three unwanted lines we have stored the information of first two lines in separate variables. We store the temperature values in a new variable using ‘strsplit()’ command which splits the total string in sub-strings from the whitespaces in between them. Note that these temperature values are still string and not integers. To get integers use ‘str2num()’ command which converts the numeric strings into inger numbers. Store these integers in appropriate variables.
- Now from the next line we have the main data which is the species and its 14 coefficients. All this data for a species is written in four lines, and this pattern continues for all the 53 species given in the file. So we use for loop to determine the data of all the species.
The first line has information like the molecular formula of the species along with some more data and the local temperatures. The first sub-string of the total string of the current line is the species name, i.e., its molecular formula. Store this formula in a variable with the help of ‘strsplit()’ command.
- Store the local temperatures using the same process and commands used to store the global temperature.
- The next three lines contain the 14 coefficients for the current species. Store the integer values of these coefficients in specific variables with the logic that all the coefficient strings have a ‘E’ in them (E is the exponent here. The values are written in scientific format.).
- After determining the coefficients we calculate the Cp, H and S values for all the temperature values that are define in the temperature range array which is created using the ‘linspace()’ command. To determine the values of these thermodynamic properties, we have built a function. We call that function in our main program and the values are determined.
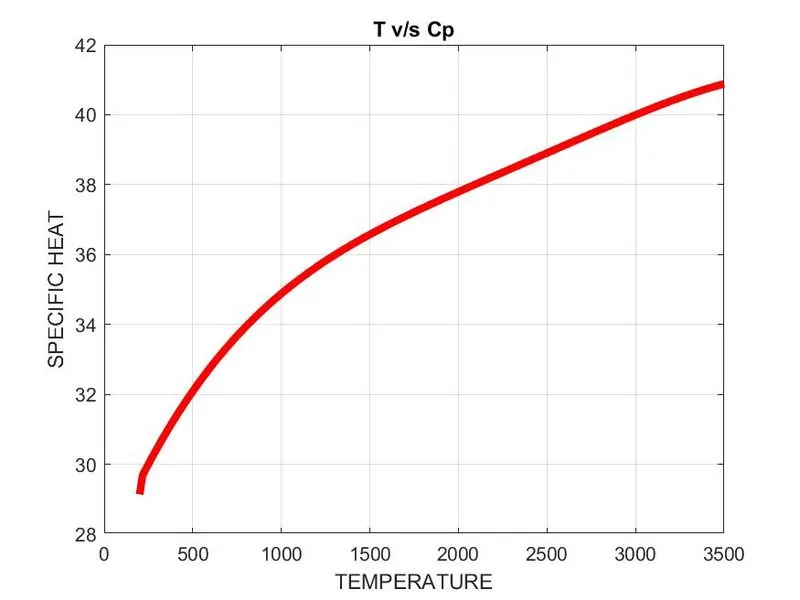
- Open a figure window and plot the graph for ‘Temperature v/s Specific heat’. Similarly, open separate figure windows to plot the ‘Temperature v/s Enthalpy’ and ‘Temperature v/s Entropy’ graphs.
- We have created another function to calculate the molecular weight of the species which automatically displays the molecular weight of the species in the command window. We call this function in our main program and the weight is displayed when the program is executed.
- Now use the ‘mkdir()’ command which creates a new folder in the directory whose address is the first argument of the ‘mkdir’ command and the name of folder is specified in the second argument of the command. We give the name of the species to this folder.
- We want to save the plots we have plotted as image files in this new folder. For this we change the current folder to the new folder that we’ve created. And use ‘saveas()’ command which saves the specified figure as image file in the current folder.
Use this command to save all the three plots as image files.
- Before writing any other statements, make sure to change the current folder back to the location of our program. If this is not done the program will not be further executed as we’ve saved the program in the specific location.
- Remember that all these commands and statements have been written in the for loop which runs from the first species to the last.
CODE:
main program:
clear all
close all
clc

data_file = fopen('THERMO.dat','r');

%getting first five lines from the text data file
line1_title = fgetl(data_file);
line2_global_temp_range = fgetl(data_file);
fgetl(data_file);
fgetl(data_file);
fgetl(data_file);
clear ans

%global temperature range
gtemp_range = strsplit(line2_global_temp_range,' ');
gtemp_low = str2num(gtemp_range{2});
gtemp_mid = str2num(gtemp_range{3});
gtemp_hig = str2num(gtemp_range{4});

%from line 6 we have species data

for i =1:53

species = fgetl(data_file);

%getting the species molecular formula
molec = strsplit(species);
molecule = molec{1};

%local temperature range for the species
t = strfind(species,'G ');
temps = species(t+1:end);
temp = strsplit(temps);
ltemp_low = str2num(temp{2});
ltemp_mid = str2num(temp{4});
ltemp_hig = str2num(temp{3});

%determining the coefficients
%upper case coefficients are high temperature values
%lowercase Coefficients are low temperature values

coeff_line1 = fgetl(data_file);
e_pos1 = strfind(coeff_line1,'E');
A1 = str2num(coeff_line1(1:e_pos1(1)+3));
A2 = str2num(coeff_line1(e_pos1(1)+4:e_pos1(2)+3));
A3 = str2num(coeff_line1(e_pos1(2)+4:e_pos1(3)+3));
A4 = str2num(coeff_line1(e_pos1(3)+4:e_pos1(4)+3));
A5 = str2num(coeff_line1(e_pos1(4)+4:e_pos1(5)+3));

coeff_line2 = fgetl(data_file);
e_pos2 = strfind(coeff_line2,'E');
A6 = str2num(coeff_line2(1:e_pos1(1)+3));
A7 = str2num(coeff_line2(e_pos1(1)+4:e_pos1(2)+3));
a1 = str2num(coeff_line2(e_pos1(2)+4:e_pos1(3)+3));
a2 = str2num(coeff_line2(e_pos1(3)+4:e_pos1(4)+3));
a3 = str2num(coeff_line2(e_pos1(4)+4:e_pos1(5)+3));

coeff_line3 = fgetl(data_file);
e_pos3 = strfind(coeff_line3,'E');
a4 = str2num(coeff_line3(1:e_pos3(1)+3));
a5 = str2num(coeff_line3(e_pos3(1)+4:e_pos3(2)+3));
a6 = str2num(coeff_line3(e_pos3(2)+4:e_pos3(3)+3));
a7 = str2num(coeff_line3(e_pos3(3)+4:e_pos3(4)+3));

%declarng the temperature range
T_range = linspace(ltemp_low,ltemp_hig,200);

%universal gas constant, R = 8.314 KJ/mol.K
R = 8.314;

% calling the function to determine Cp, H and S
[Cp,  H, S] = thermo_dat(A1,A2,A3,A4,A5,A6,A7,a1,a2,a3,a4,a5,a6,a7,R,ltemp_mid,T_range);

figure(1)
plot(T_range,Cp, 'linewidth',4,'color','r')
title('T v/s Cp')
xlabel('TEMPERATURE')
ylabel('SPECIFIC HEAT')
grid on

figure(2)
plot(T_range,H, 'linewidth', 4,'color','g')
title('T v/s H')
xlabel('TEMPERATURE')
ylabel('ENTHALPY')
grid on

figure(3)
plot(T_range,S,'linewidth',4,'color','b')
title('T v/s S')
xlabel('TEMPERATURE')
ylabel('ENTROPY')
grid on

%calling the function to determine the molecular weight
mweight = molecular_weight(molecule);

%making directory for storing the plots for each species
mkdir("D:SoftwaresMATLABProject FIlesMATLAB for MEProject 1 - Parsing NASA's Thermodynamic DataSpecies Data", molecule);
folder = (["D:SoftwaresMATLABProject FIlesMATLAB for MEProject 1 - Parsing NASA's Thermodynamic DataSpecies Data", molecule]);
f = folder(1) + folder(2); %making a single string for directory address
cd(f)

%saving the plots as images

saveas(1, 'T_vs_Cp','jpg')
saveas(2, 'T_vs_H','jpg')
saveas(3, 'T_vs_S', 'jpg')

program_folder = (["D:SoftwaresMATLABProject FIlesMATLAB for MEProject 1 - Parsing NASA's Thermodynamic Data"]);
cd(program_folder)


end
Screenshot of the directory where all the folders are created:

Screenshots of Command window where molecular weights are printed:
2. For the function to determine Cp, H and S:
1. This function will take all the values of the coefficients, value of R, local mid temperature and the local temperature range as inputs. And will return the values of Cp, H and S.
- Define R = 8.314. Create null vectors for Cp, H and S of equivalent to the size of temperature range array. This is done because we will find all the values of these properties elementwise for all the temperature values defined in the temperature array.
- For this, use a for loop and run it for the length of the temperature range. Inside the for-loop use ‘if else’ condition to use proper values of the coefficients for calculating the properties.
The logic here is that if the temperature is greater than the middle temperature, that means it lies in the range of high temperature and hence high-temperature coefficients are used. And if the temperature is less than or equal to the middle temperature, then the low-temperature coefficients are used.
- Make sure to close the ‘if else’ condition by using the keyword ‘end’. Similarly close the for-loop and the main function.
- Save the function with the same file name as the function name.
CODE:
function to calculate Cp, H and S:
function [Cp, H, S] = thermo_dat(A1,A2,A3,A4,A5,A6,A7,a1,a2,a3,a4,a5,a6,a7,R,T2,T)
R = 8.314;
Cp = zeros(size(T));
H = zeros(size(T));
S = zeros(size(T));

for i = 1:length(T)
    if T(i) > T2
        Cp(i) = R*(A1 + A2*T(i) + A3*T(i).^2 + A4*T(i).^3 + A5*T(i).^4);
        H(i) = R*T(i)*(A1 + A2*T(i)/2 + A3*(T(i).^2)/3 + A4*(T(i).^3)/4 + A5*(T(i).^4)/5 + A6/T(i));
        S(i) = R*(A1*log(T(i)) + A2*T(i) + A3*(T(i).^2)/2 + A4*(T(i).^3)/3 + A5*(T(i).^4)/4 + A7);

    else
        Cp(i) = R*(a1 + a2*T(i) + a3*T(i).^2 + a4*T(i).^3 + a5*T(i).^4);
        H(i) = R*T(i)*(a1 + a2*T(i)/2 + a3*(T(i).^2)/3 + a4*(T(i).^3)/4 + a5*(T(i).^4)/5 + a6/T(i));
        S(i) = R*(a1*log(T(i)) + a2*T(i) + a3*(T(i).^2)/2 + a4*(T(i).^3)/3 + a5*(T(i).^4)/4 + a7);
    end
end
end
3. For the function to determine molecular weights:
- This function will take the name of the species as input and will return its molecular weight as integer.
- Initialize the weight as zero kg.
Now the logic to calculate the molecular weight is as follows:
We know molecular weight of a compound is the sum of weights of all the atoms the compound is comprised of. In our given data file, all the compounds are comprised of one or more than of the following atoms: H, C, N, O. and there is one species which is Argon.
So, we will calculate the weight by counting the no. of atoms and adding the corresponding atomic masses.
- We create two arrays, one containing the symbols of the required atoms and one containing their respective atomic masses.
- We search the separate string of species name in the atoms array and if the atom is found in the array, we add the corresponding atomic mass to the weight variable.
- Now the molecule might be comprised of multiple atoms of same element. For this we use ‘str2num()’ command to convert the ith atom of the species name into numerical value. If there is any number greater than 1 written next to an atom, we add the corresponding atomic mass to our molecular weight variable.
If n is the number written next to an atom then we add the mass as follows:
wt = wt + atomic_mass*(n-1)
we subtract 1 from n because the atomic mass for the atom has been already added once in the previous iteration.
- Finally, display the molecular weight of the species in the command window using the ‘disp’ command. You can also display the species name to be more specific and organized.
- Make sure to close all the loops, conditional statements and the main function with the keyword ‘end’.
- Save the function with the same file name as the function name.
CODE:
function to determine molecular weight:
function [wt] = molecular_weight(species)
wt = 0;
atoms = ['H','C','N','O','A'];
atom_m = [1,12,14,16,40];
    for i = 1:length(species)
        for j = 1:length(atoms)
            c = strcmp(species(i),atoms(j));
            if c == 1
                wt = wt + atom_m(j);
                n = j;
            end

        end

        index = str2num(species(i));
        if index > 1
            wt = wt + atom_m(n)*(index - 1);
        end

    end

    disp(species);
    disp('Molecular Weight: ');
    disp(wt);
end
PROGRAM TO TAKE SPECIES NAME FROM USER AND OUTPUT THE DATA FOR THAT SPECIES:
clear all
close all
clc

w = 1;
    while w == 1

file_pointer = fopen('THERMO.dat','r');

%global temperature range
line1 = fgetl(file_pointer);
line2 = fgetl(file_pointer);

gtemp_range = strsplit(line2,' ');
gtemp_low = str2num(gtemp_range{2});
gtemp_mid = str2num(gtemp_range{3});
gtemp_hig = str2num(gtemp_range{4});

%taking species name from the user
name = input('Enter the species you want the data of: ','s');
name = upper(name);

%excluding the unwanted comment lines
    for i = 1:3
        fgetl(file_pointer);
        clear ans
    end

%finding the species in the data text file
for i = 1:218
    current_line = fgetl(file_pointer);
    finder = strfind(current_line,name);
    if finder > 0
        break
    end
end

if i == 218
    disp('species not found. Please enter a valid species name.');
    break
end

%determinig local temperatures
t = strfind(current_line,'G ');
temps = current_line(t+1:end);
temp = strsplit(temps);
temp_low = str2num(temp{2});
temp_mid = str2num(temp{4});
temp_hig = str2num(temp{3});

%defining the temperature range
T_range = linspace(temp_low,temp_hig,200);
R = 8.314;  %KJ/molK
%upper case coefficients are high temperature values
%lowercase Coefficients are low temperature values

coeff_line1 = fgetl(file_pointer);
e_pos1 = strfind(coeff_line1,'E');
A1 = str2num(coeff_line1(1:e_pos1(1)+3));
A2 = str2num(coeff_line1(e_pos1(1)+4:e_pos1(2)+3));
A3 = str2num(coeff_line1(e_pos1(2)+4:e_pos1(3)+3));
A4 = str2num(coeff_line1(e_pos1(3)+4:e_pos1(4)+3));
A5 = str2num(coeff_line1(e_pos1(4)+4:e_pos1(5)+3));

coeff_line2 = fgetl(file_pointer);
e_pos2 = strfind(coeff_line2,'E');
A6 = str2num(coeff_line2(1:e_pos1(1)+3));
A7 = str2num(coeff_line2(e_pos1(1)+4:e_pos1(2)+3));
a1 = str2num(coeff_line2(e_pos1(2)+4:e_pos1(3)+3));
a2 = str2num(coeff_line2(e_pos1(3)+4:e_pos1(4)+3));
a3 = str2num(coeff_line2(e_pos1(4)+4:e_pos1(5)+3));

coeff_line3 = fgetl(file_pointer);
e_pos3 = strfind(coeff_line3,'E');
a4 = str2num(coeff_line3(1:e_pos3(1)+3));
a5 = str2num(coeff_line3(e_pos3(1)+4:e_pos3(2)+3));
a6 = str2num(coeff_line3(e_pos3(2)+4:e_pos3(3)+3));
a7 = str2num(coeff_line3(e_pos3(3)+4:e_pos3(4)+3));

%calling function to calculate Cp, H and S
[Cp, H, S] = thermo_dat(A1,A2,A3,A4,A5,A6,A7,a1,a2,a3,a4,a5,a6,a7,R,temp_low,T_range);

%determining the molecular weight
weight = molecular_weight(name);

%plotting the graphs
figure(1)
plot(T_range,Cp, 'linewidth',4,'color','r')
title('T v/s Cp')
xlabel('TEMPERATURE')
ylabel('SPECIFIC HEAT')
grid on

figure(2)
plot(T_range,H, 'linewidth', 4,'color','g')
title('T v/s H')
xlabel('TEMPERATURE')
ylabel('ENTHALPY')
grid on

figure(3)
plot(T_range,S,'linewidth',4,'color','b')
title('T v/s S')
xlabel('TEMPERATURE')
ylabel('ENTROPY')
grid on

folder = mkdir("D:SoftwaresMATLABProject FIlesMATLAB for MEProject 1 - Parsing NASA's Thermodynamic Data",name);
folder = (["D:SoftwaresMATLABProject FIlesMATLAB for MEProject 1 - Parsing NASA's Thermodynamic Data",name]);
f = folder(1) + folder(2);
cd(f)

saveas(1, 'T_vs_Cp','jpg')
saveas(2, 'T_vs_H','jpg')
saveas(3, 'T_vs_S', 'jpg')

program_f = (["D:SoftwaresMATLABProject FIlesMATLAB for MEProject 1 - Parsing NASA's Thermodynamic Data"]);
cd(program_f)
w =0;
    end
Here, we do all the procedure similar to the main program, only we dont use for loop for the whole program because we only want to get the data of one species which is specified by the user.
We take the name of the species from the user and search for this species in the whole text data file using the for loop. In the for loop, when the species is found we break the loop.
We convert all the characters of the species name string to uppercase characters. This will make the program case insensitive, i.e., even if the user types in the name is lowercase it will be coverted to uppercase. We do this because the species name in the data file are all in upper case.
We have also written the whole program in a while loop in order to terminate the execution of program after certain process is executed. When the species name specified by the user is not found in the data file, we want to prompt a message to the user to write valid species name. If this is not done, and the user types in an invalid species name, we will get certain errors in the command box.
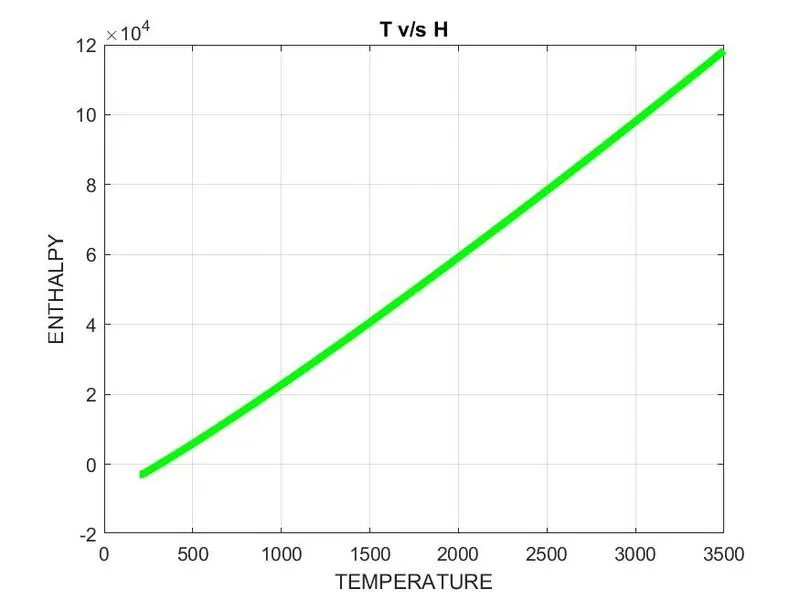
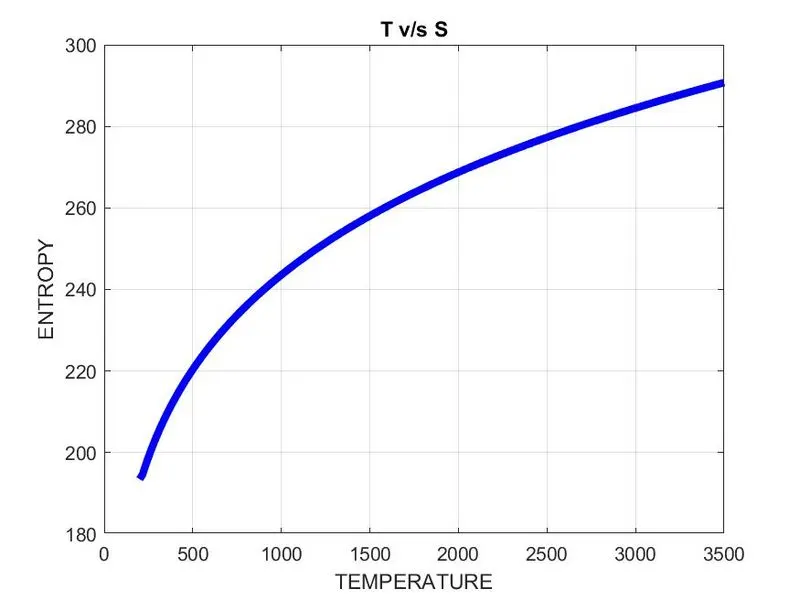
PLOTS for O2:
1. Specific Heat
2. Enthalpy:
3. Entropy:
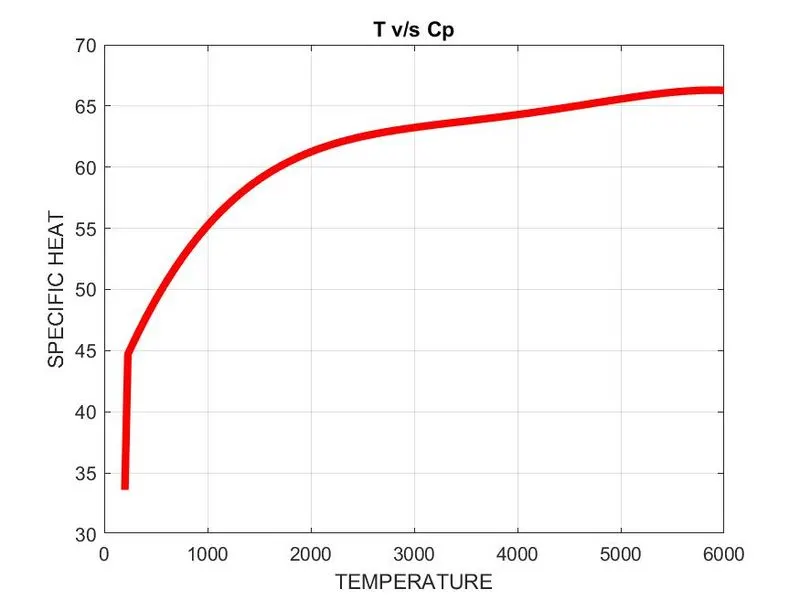
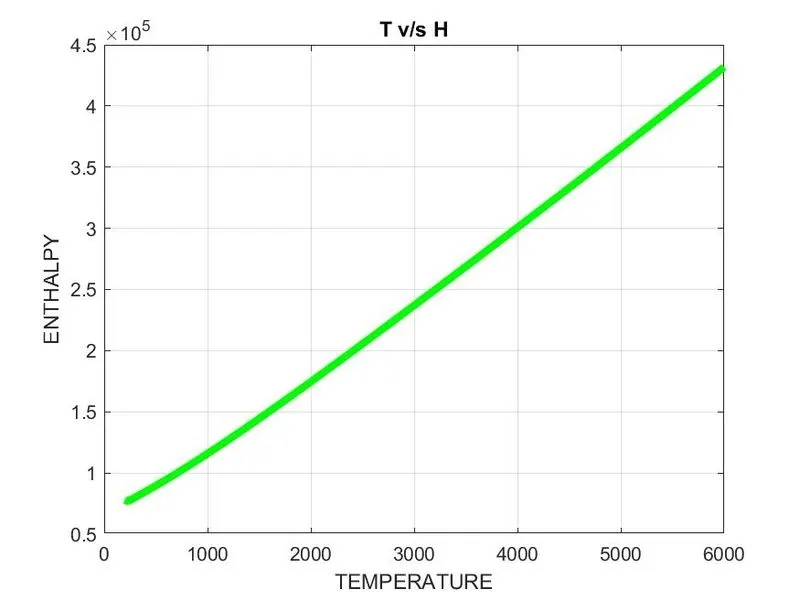
PLOTS for N2:
1. Specific Heat:
2. Enthalpy:
3. Entropy:
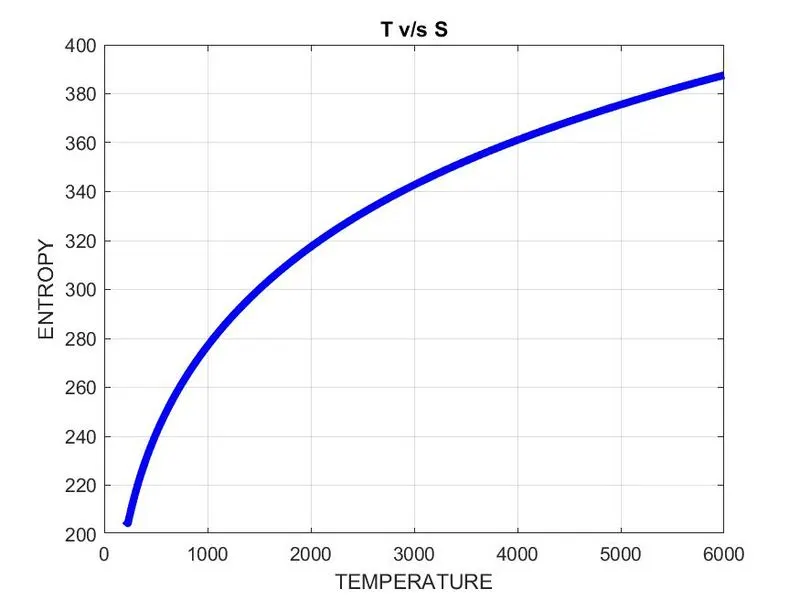
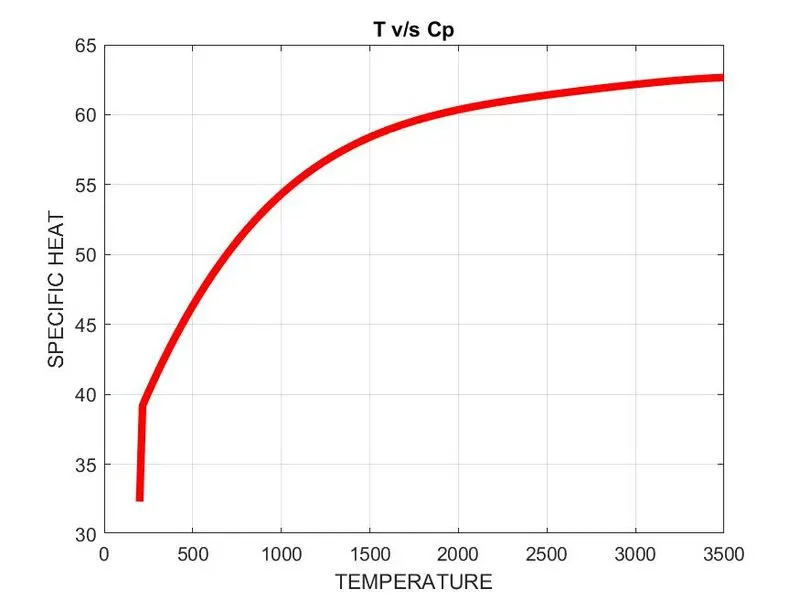
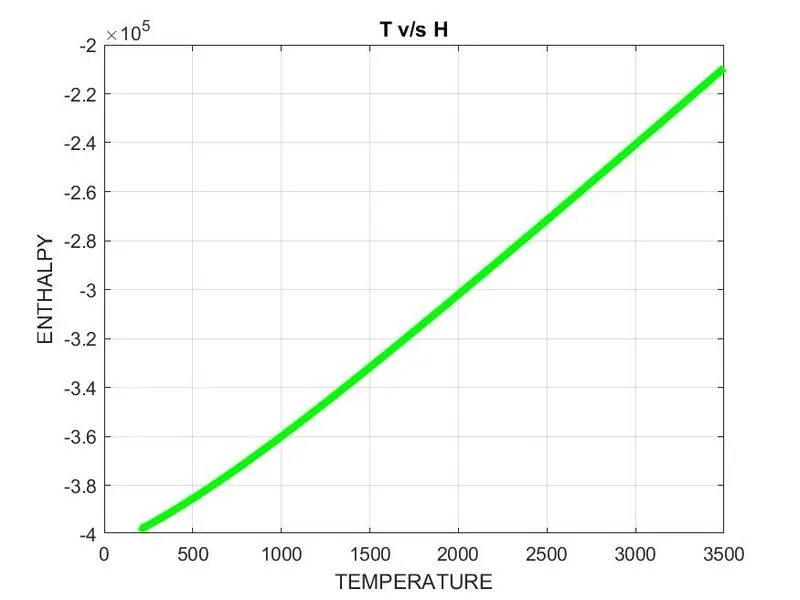
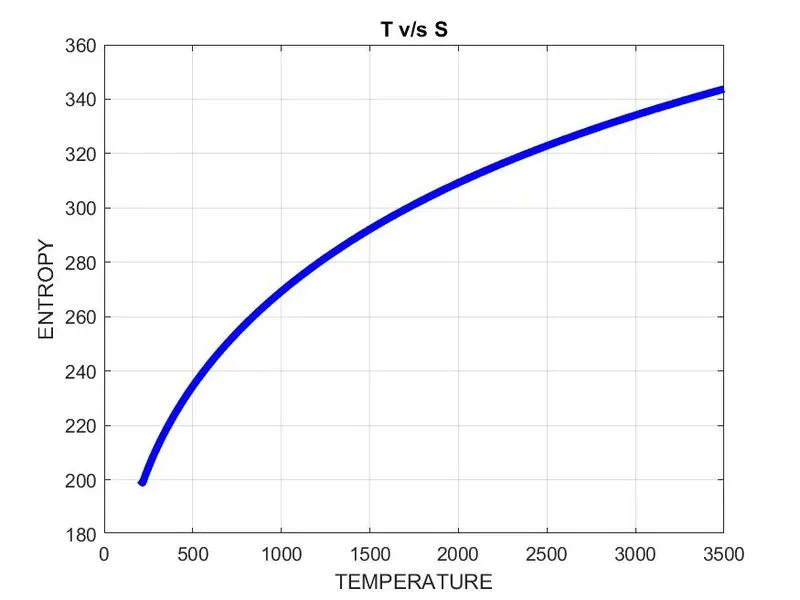
PLOTS for CO2:
1. Specific Heat:
2. Enthalpy:
3. Entropy:
CONCLUSION:
1. The seperate folders for each species have been created automatically when the main program is executed. The graphs that have been plotted for all the species are saved as images in the corresponding folders of eacch species.
2. The progam which takes user input is case insensitive and determines the data of any species given by the user which is present in the given data file.
3. The plots for variation in Cp, H and S with respect to temperature T have been plotted and attached above.
We have studies file parsing and how to read data from a given text file using MATLAB programming. We have learned how to use the information from a given data file into our MATLAB program to determine various other data and save them in our computer directories.