TO WRITE A MATLAB PROGRAM TO CLACULATE THE DRAG FORCE AGAINST CYCLIST .
AIM :
To write a programm to calculate the drag force against cyclist.
OBJETCTIVE :
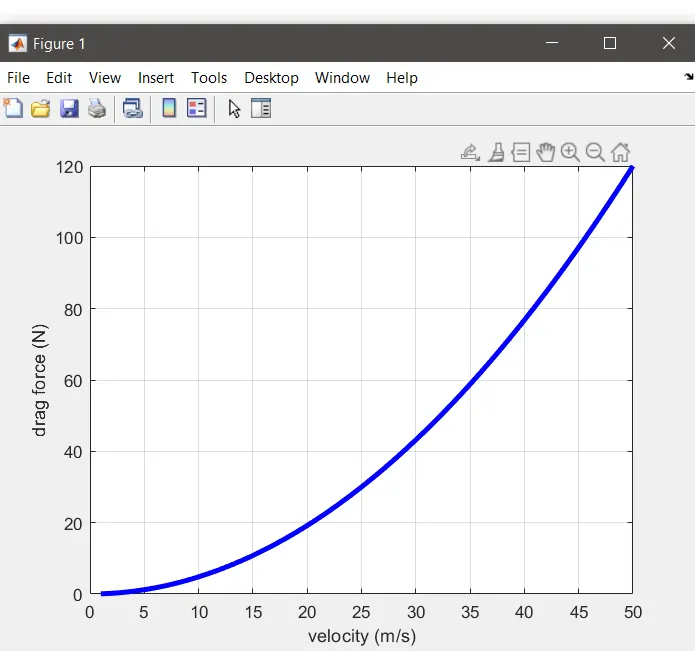
To write a programm to plot velocity vs drag force .
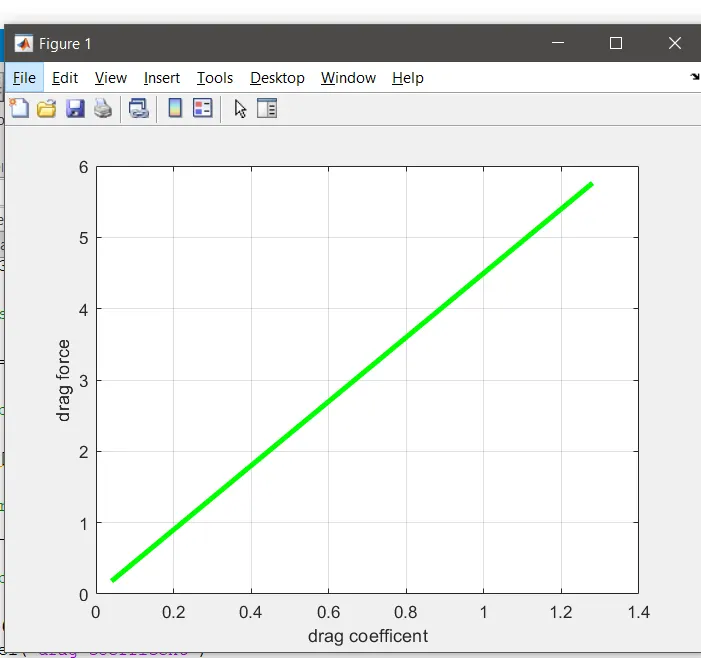
To write a program to plot drag co-effiecient vs drag force .
The factor involved are Velocity, drag coefficient, frontal area, Density of area.
THEORY:
DRAG FORCE -Drag force is the resistance force of a fluid . This force applies acting opposite toward the motion of the object which is moving submerge in a certain fluid . Thus drag force is defined as the force which resist the motion of a body with fluid.
Drag coefficient - In the fluid dynamics ,the drag coefficient is a dimensionless quantity that is used to quantify the drag or resistance of a object in a fluid environment ,such as air or water.
EQUATION USED TO CALCULATE THE DRAG FORCE - Fd= 0.5*cd*A*p*V^2
Fd = drag force (N)
cd=drag coefficient(unitless)
A= frontal area(m^2)
p=density of air (kg/m^3)
v= velocity of a cyclist (m/s)
ALGORITHM:
Inpuut all the required quantities i.e Velocity,drag coefficient , frontal area, density of air,velocity of a cyclist .
Use the drag formula to calculate the required result.
Use the pot command to plot the graph .
MATLAB PROGRAM :
Program to calculate the drag force on a bicycle and plot a graph between the velocity vs drag force :
% To plot velocity vs drag force

clear all
close all
clc

% inputs

%drag coefficient
cd=0.8

% velocity of a cyclist m/s
v=[1:50]

%density kg/m^3

rho = 1.2

%area m/s^2
A  =0.1
%drag force
drag_force = 0.5*A*rho*v.^2*cd
plot(v,drag_force,'linewidth',3,'color','b')
xlabel('velocity (m/s)')
ylabel ('drag force (N)')
grid on
OBSERVATION - graph between the velocity and a drag force .
Program to calculate the drag force and plot a grao between drag coefficicent vs drag force
% To plot drag coefficient vs drag force

clear all
close all
clc

% inputs
% for different shapes ,the drag coefficient i.e for flat plate,prism,bullet,airfoil,cyclinder:
cd = [0.04,0.09,0.82,0.47,1.14,1.28];

%frontal area  m/s^2

A=0.3;

%density  kg/m^3

rho = 1.2 ;

%velocity  m/s

v = [5]

% formula for drag force
drag_force = 0.5*rho*A*v.^2*cd

% plotting

plot( cd ,drag_force,'linewidth',3,'color','g')
xlabel('drag coefficent')
ylabel('drag force')
grid on
OBSERVATION - graph betweem the drag coefficient and drag force
RESULT - the calculation of drag force ,plot between velocity vs drag force and drag coefficient vs drag force has been done amd observation is made.