Structural Modelling using Etabs 2018
Aim:
- To conceptualize a framing plan layout and then to model the given G+7 building situated in zone 5 in Etabs software.
- To develop the structural model that comply with provisions of both IS 1893 and IS 13920.
- To run the modal response spectrum analysis and to check analysis results of the ETABS model for inter-storey drift requirements, vertical & planar irregularities, minimum shear wall requirements,maximum axial load ratio for column and shear walls, effective moment of inertia for beams and columns etc.
Procedure:
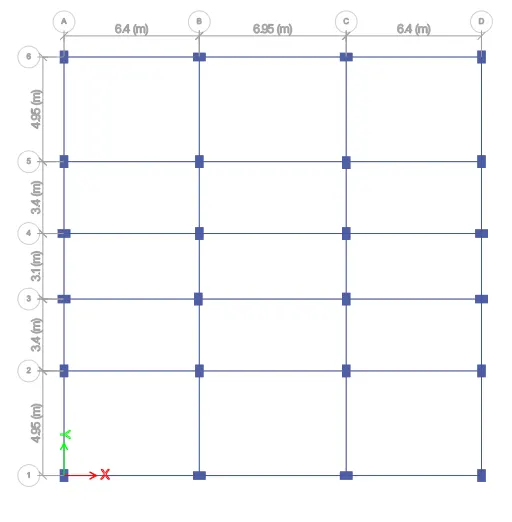
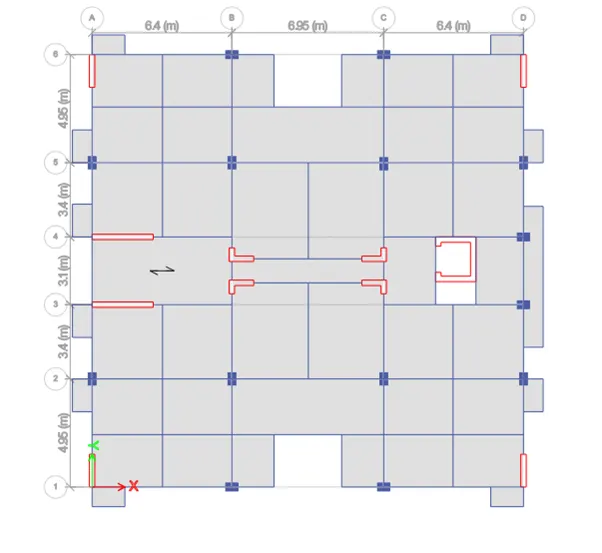
- Open the given AutoCAD file and locate the positions of columns, beams and also of shear walls.
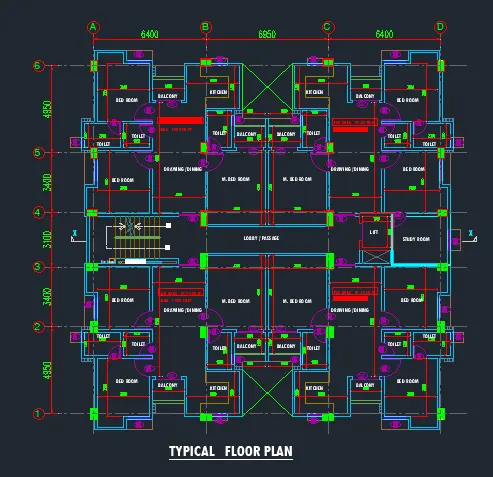
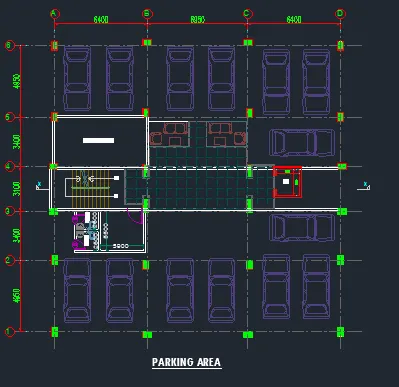
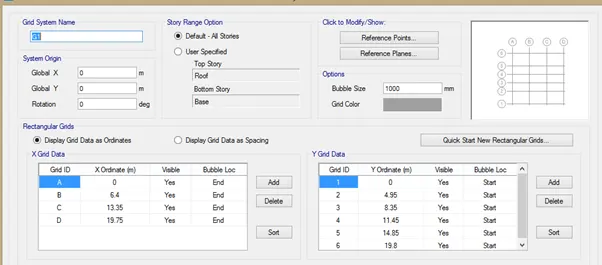
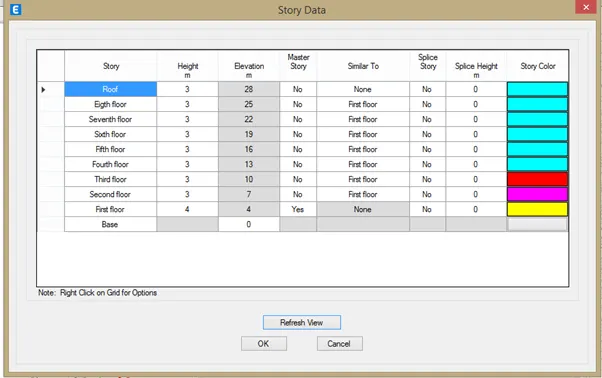
- Open the ETABS file and provide the grids and storey information as given in the model provided.
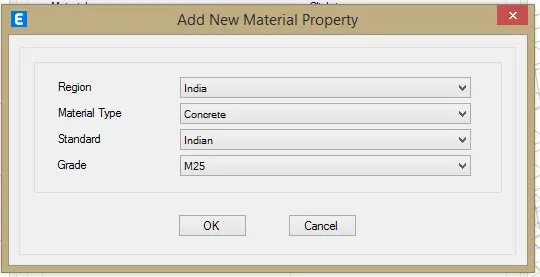
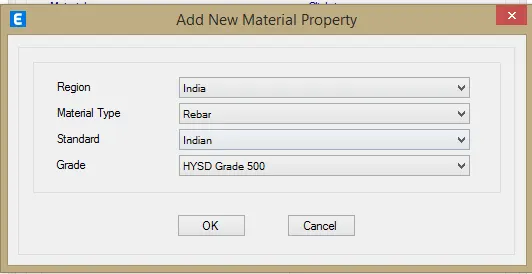
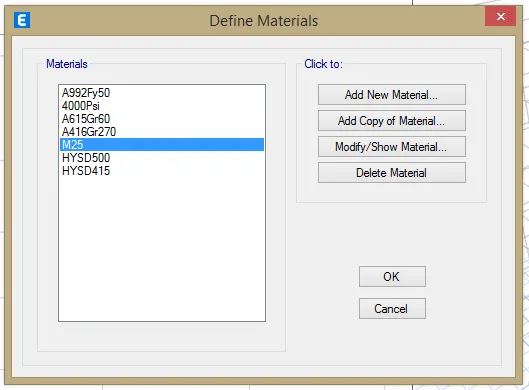
- Next define the material property for concrete and reinforcement.
- Define the section property for column, beam and wall:
- Go to define tab and then section property and then select frame section and choose Beam 300X450mm and column 400X600mm.
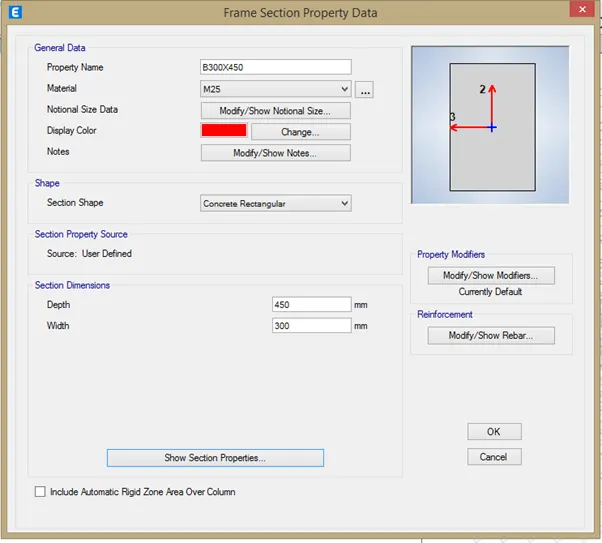
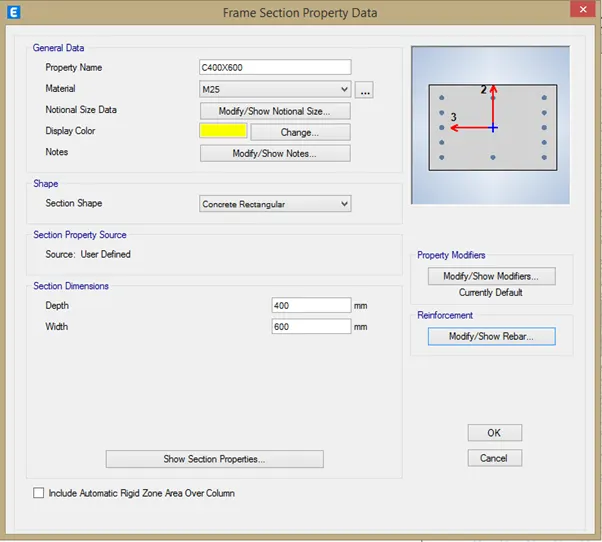
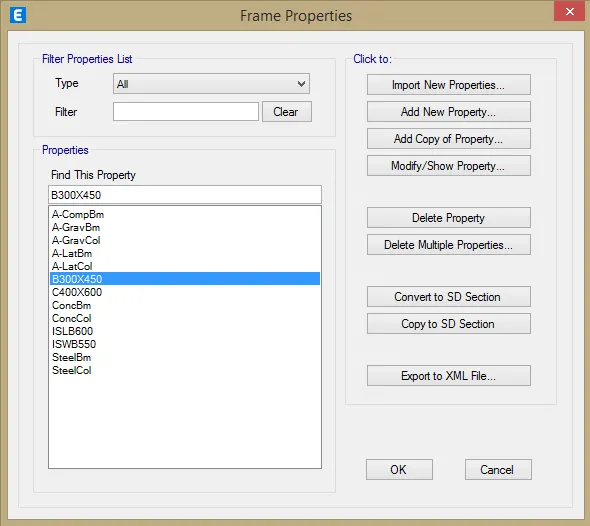
- Define the slab properties.
- Go to Define and choose section properties then slab sections and select Slab150 and slab 125.
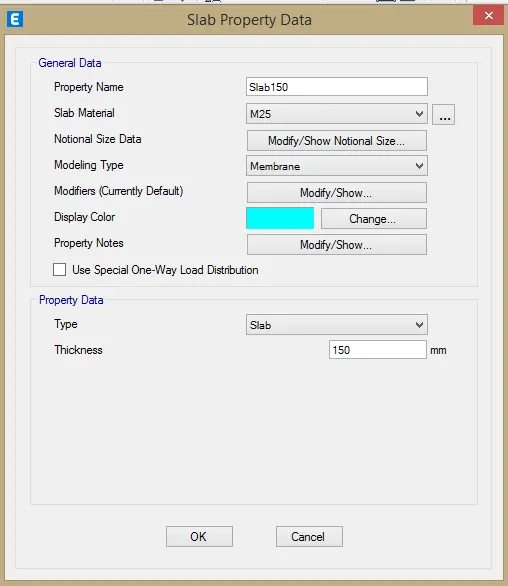
- Define the wall properties.
- Go to Define and then choose section properties and then wall sections and then select wall250.
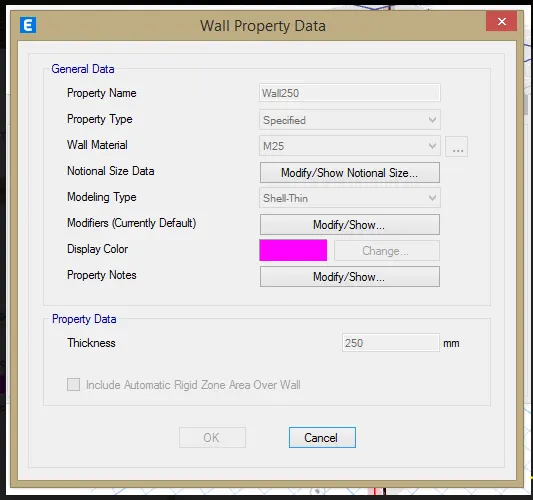
- We have now defined the material as well as section properties
- Now we need to place the components in their respective positions.
- Go to quick draw columns and place the columns at suitable positions(C400x600).
- Similarly place the beams(B300x450) and shear walls at theur respective locations.
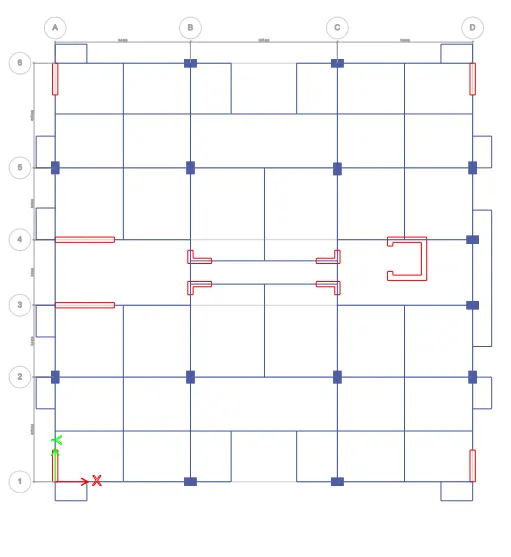
- Now, we need to place the slabs , for staircase slab we use slab150 and for remaining places we use slab125.
- Now make the staircase slab as one way slab.
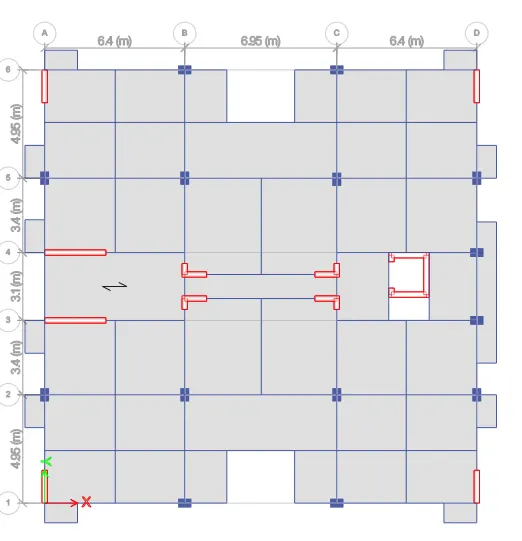
- Next, we need to apply loads.
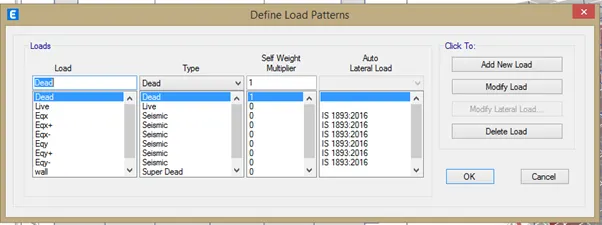
- Select define and then choose load patterns.(NOTE: Include wall load and floor finishes as super dead loads)
- After defining loads, assign the load cases:
- Brickwall load is asssigned as 3.5kN/m.
- Floor finishes - 1.5 kN/m2">kN/m2
- Live load - 2 kN/m2">kN/m2 and 5 kN/m2">kN/m2 for terrace as it contains mumty and lift unit.
- Also provide the liveload reduction factor as per IS875 part II.
- Go to Design and then choose Live load reduction factor accordingly.
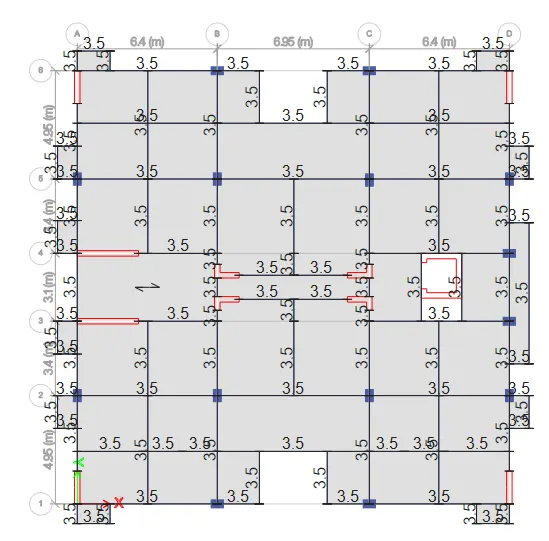
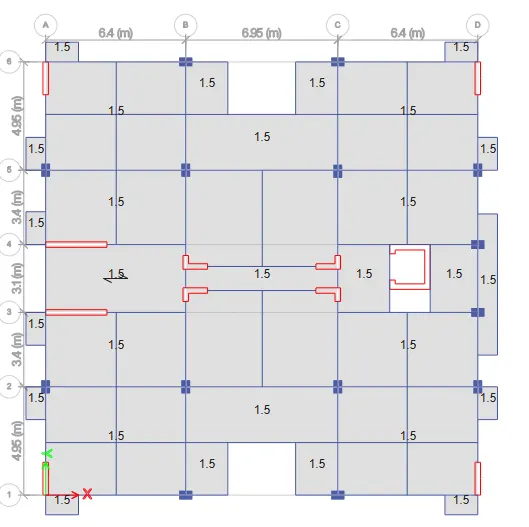
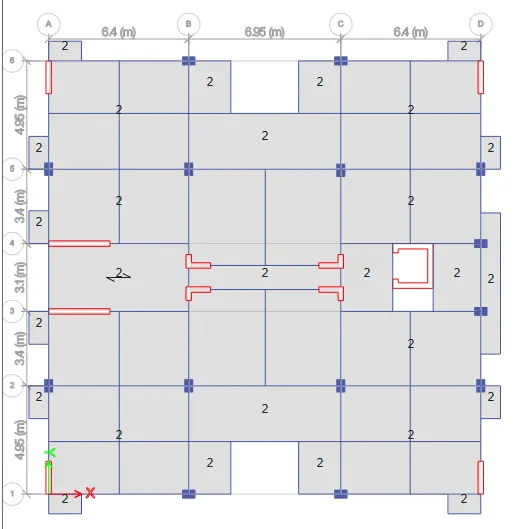
- Next, define the mass source.
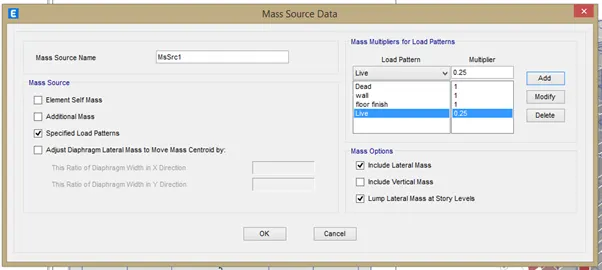
- After defining the mass source, we have to define the modal case.
- Next define the response spectrum function. Go to Define and choose Response spectrum and then select Function name as RS function and click ok
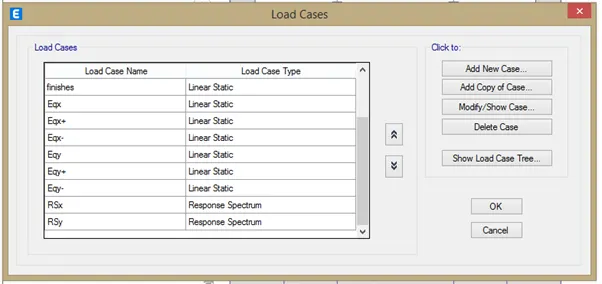
- Then go to load case and add new case, choose RSx (U1) then choose load case type - Response spectrum. Then fill the load details. Similarly add another load case as RSy (U2).
- Now, Assign and click on shell then choose diaphragms and select D1 and then Apply.
- Also assign pier labels.
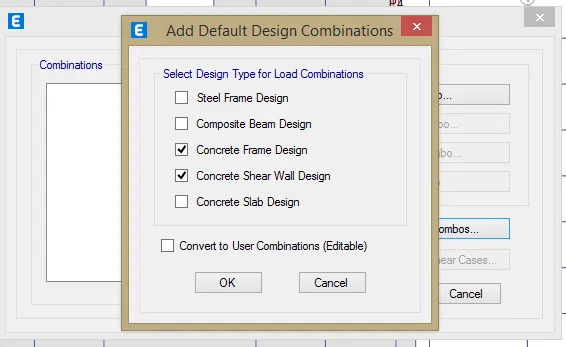
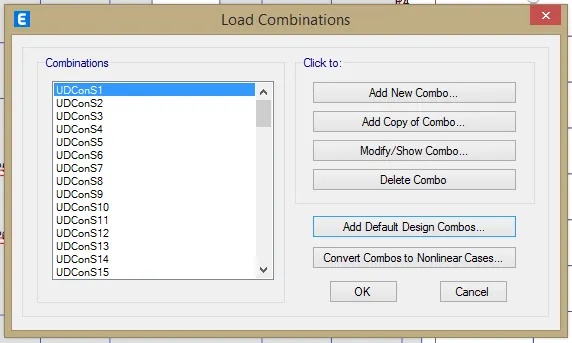
- Now, go to define and select load combinations and add default load combinations then choose concrete frame design and concrete shear wall design and then click on convert to user combination.
- As all the inputs have been provided, now we can check the model.
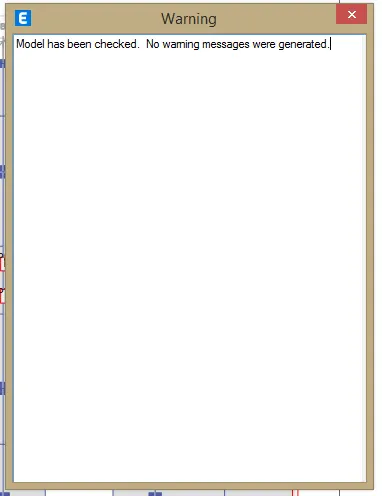
- Click on Analyze and then check then model.
- Now, run the analysis.
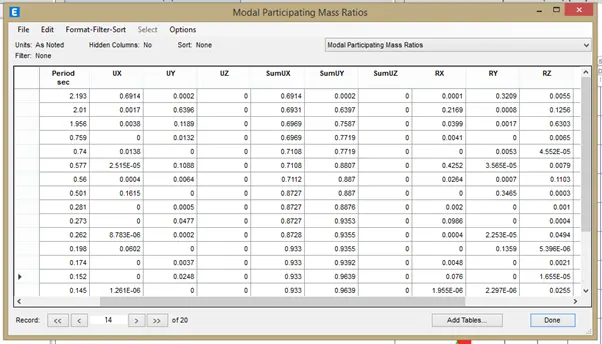
- Once the analysis is over, go to display and click on show tables and then on analysis result and click on structure output and select modal information and then modal mass participating ratio.
- Mode 1 - 69.14% ; Mode 2 - 63.96% ; Mode 3 - 63.03%
- Hence, the mass participation of translational mode is greater than the torsional mode.
- Now, in display, choose base reactions.
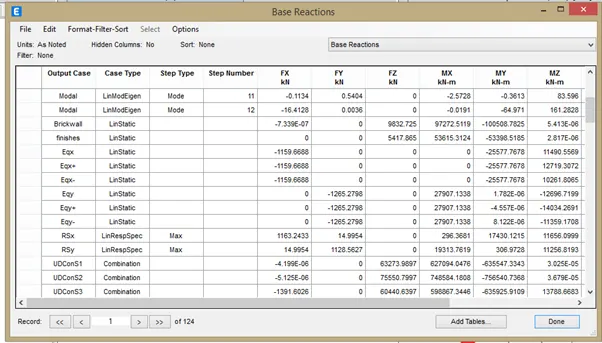
- Go to display and click on show tables then analysis result and then structure output and select base reactions.
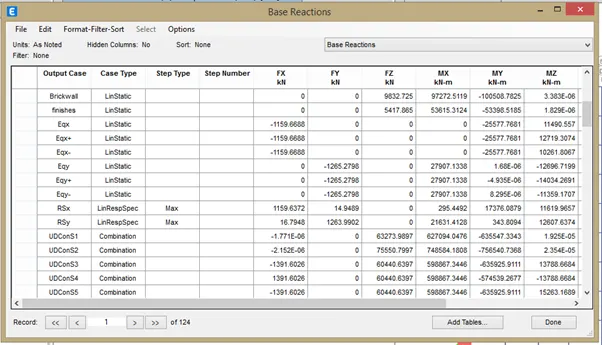
- Eqx obtained is 1159.66kN and RSx = 1163.24kN. Hence, the scale factor = 1159.66/1163.24=0.9969.
- Similarly, Eqy = 1265.27kN anf RSy = 1128.56kN. Scale factor = 1265.271128.56=1.12.
- So, now, keep these values as scale factor.
- Now, both Eq and RS values are made same using the scale factor hence, the Eqx and Eqy can be removed from the load case and combinations.
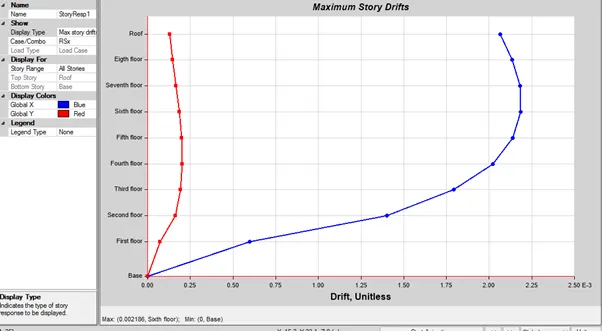
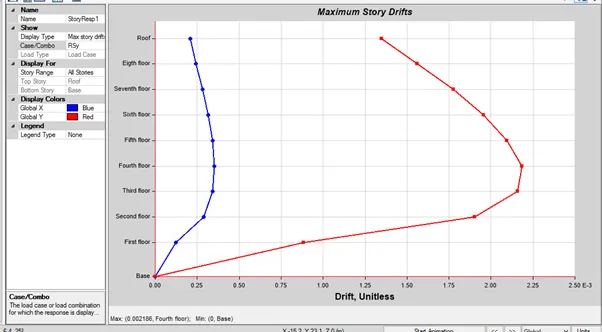
- Now, check the interstory drift. For this click on display then story response plot and then choose maximum story drift
- Here, for both RSx and RSy the max story drift is within 0.004, as given in IS1893-2016
- Now, the axial force diagram is given by clicking on display and then force/stress diagram and then click on frame/pier/spandrel/link forces.
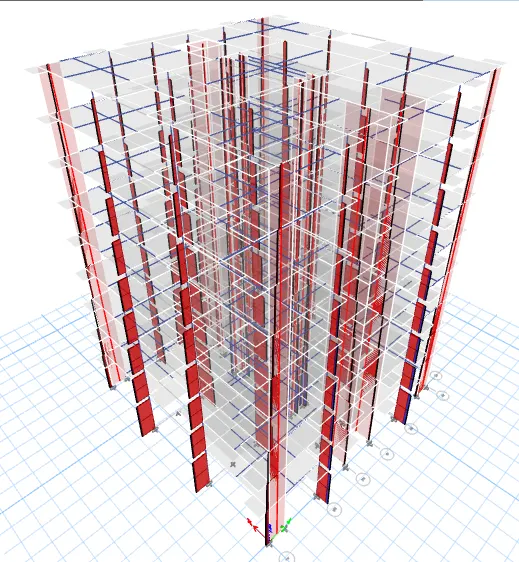
- Hence the completed model of the G+7 building is as given below:
Result:
- The structural model of the G+7 building has been developed which complies with both IS1896 and IS13920.
- After framing the layout, analysis has also been carried out on the model.
- Necessary checks have been done to the model and also cross verified the values with the codes provided above.