Structural dynamics
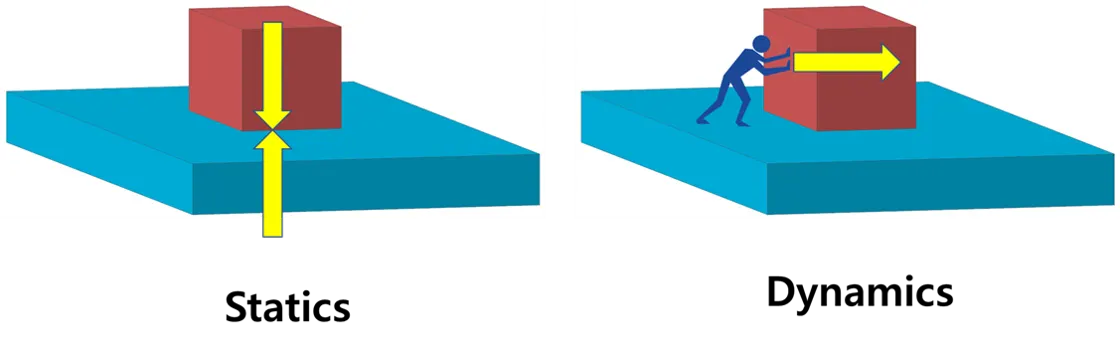
1. Differentiate Static analysis and Dynamic analysis with proper representing pictures
STATIC ANALYSIS
Load is not variable with time and neglected due to slow applying of load.
Motion of the structure can be disregarded.
There is no necessity to count Inertia and damping forces in the case of static analysis, but the elastic force should be accounted for.
There is no inertia effect on static analysis.
DYNAMIC ANALYSIS
Load is variable with time due to fast applying of load and vibration.
Motion can not be disregarded (can't be considered as static).
Inertia and damping forces should be accounted for in the calculation of dynamic analysis.
Inertia effect is considered in dynamic analysis.
2. Explain the following with relevant force-displacement graph
- Elastic behavior
- Inelastic behavior
- Plastic behavior
- Non-linear Inelastic behavior
Elastic behavior - The ability of a deformed material body to return to its original shape and size when the forces causing the deformation are removed. A body with this ability is said to behave (or respond) elastically. From the force-displacement graph, for every material it shows a linear path upto certain point, hence the body shows elastic properties at a certain limit with the forces applied.
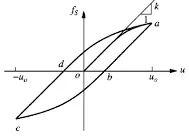
Inelastic behavior - The deformation of a material that does not disappear on the removal of the force that produces it. From the force-displacement graph, inelastic behavior corresponds to the nonlinear path. Inelasticity is experienced by the body as soon as the path goes out of the linear curve.
Plastic behavior - The behavior of plastic structures beyond the bending collapse load is influenced by the changes in the geometry of a structure during the process of plastic deformation. After the yield point every material undergoes the plastic deformation as shown in the curve. Even the load is removed the deformation cannot be reversed as elastic deformation.
Non-linear Inelastic behavior - Force displacement relationship becomes non-linear and inelastic at large deofrmations. Force fs corresponding to deformation is not single valued and depends on history of deforamtions and whether deformations is increasing or decreasing. The below shown graphs represents the non-linear inelastic behaviour of material.
3. Explain Mass, Stiffness & Damping components in the equation of motion
The Single Degree of Freedom System is a combination of 3 pure independent systems such as the stiffness, the damping, and the mass component.
The Stiffness Component – the frame without damping or mass. The external force fs on the stiffness component is related to displacement u by fs = Ku if the system is linearly elastic.
The Damping Component – the frame with its damping property with no stiffness or mass. The external force on the damping component is related to velocity by FD = ců, where fd is the damping force, c is the viscous damping coefficient and ů is the velocity.
The Mass Component – the roof mass without the stiffness or damping of the frame. The external force fi on the mass component is related to the acceleration by fi = mű
Equation of MOtion:
mű + fd + fs = p(t)
mű + ců+ ku = p(t)
4. Provide relationship between Natural period (Tn) & Natural frequency (f) and provide their definitions
Natural period (Tn) – the vibration of the system (Tn) is the time required for the undamped system to complete one cycle of free vibration (Unit is in seconds).
It is related to the natural circular frequency of vibration, ωn, in units of radians per second. With, Tn = 2π/ωn or ωn = 2π/Tn
Natural frequency (f) - number of the cycle (or one complete revolution) executed by the system in one second with units in hertz.
Where f=1/Tn
Natural vibration properties ωn, Tn, and f depend only on the mass and stiffness of the structure.
Therefore, the relation between natural period of vibration of the system(Tn) and natural frequency(fn) is fn=(1/Tn)
5. Explain in detail about Response spectrum & its Graph
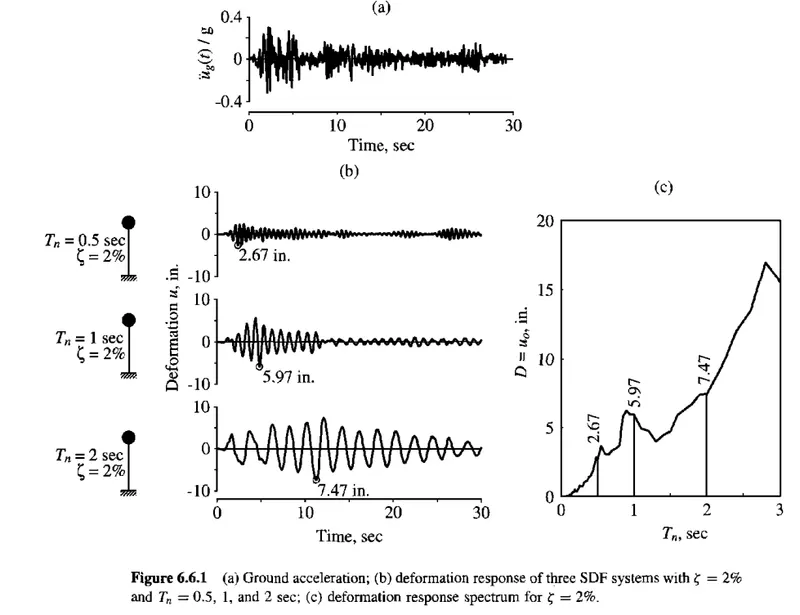
A response spectrum is a function of frequency or period, showing the peak response of a simple harmonic oscillator that is subjected to a transient event. The response spectrum is a function of the natural frequency of the oscillator and of its damping. Thus, it is not a direct representation of the frequency content of the excitation (as in a Fourier transform), but rather of the effect that the signal has on a postulated system with a single degree of freedom (SDOF).
Response spectrum analysis is a method to estimate the structural response to short, nondeterministic, transient dynamic events. Examples of such events are earthquakes and shocks. Since the exact time history of the load is not known, it is difficult to perform a time-dependent analysis. Due to the short length of the event, it cannot be considered as an ergodic ("stationary") process, so a random response approach is not applicable either.
The response spectrum method is based on a special type of mode superposition. The idea is to provide an input that gives a limit to how much an eigenmode having a certain natural frequency and damping can be excited by an event of this type.
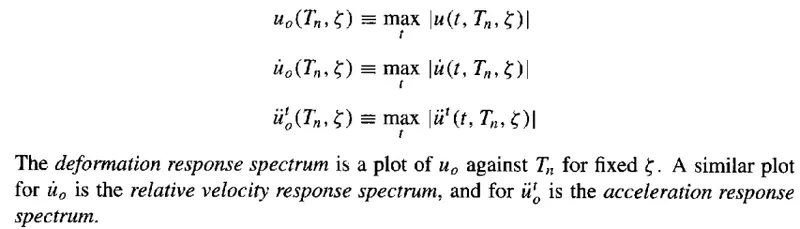
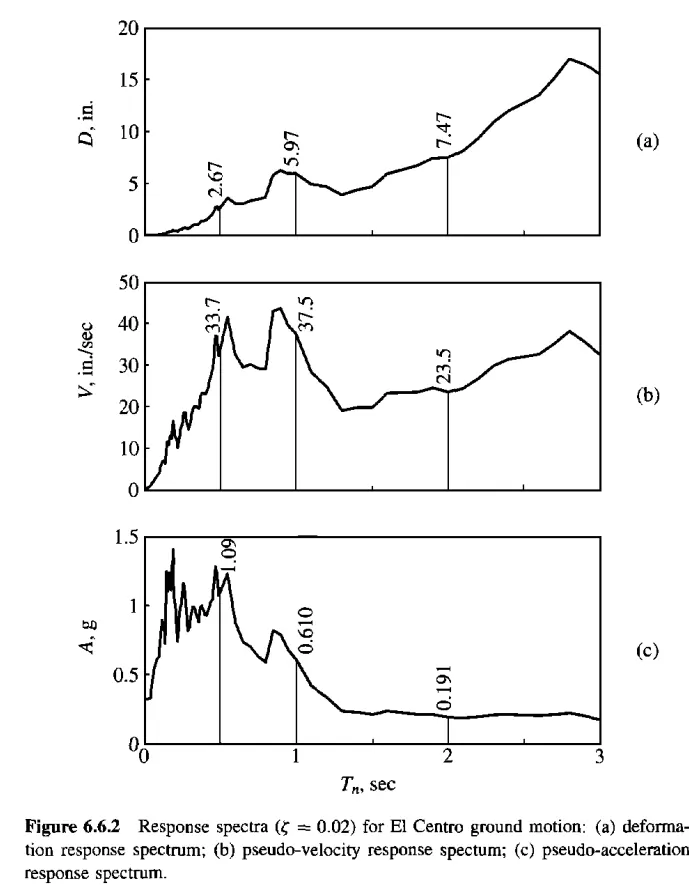
A variety of response spectra can be defined depending on the response quantity that is plotted. The respective graphs are given below