Structural dynamics
1. Differentiate Static analysis and Dynamic analysis with proper representing pictures
Answer:-

Difference between dynamic code analysis and static code analysis
- Dynamic analysis is the testing and evaluation of an application during runtime. Static analysis is the testing and evaluation of an application by examining the code without executing the application. Many software defects that cause memory and threading errors can be detected both dynamically and statically. The two approaches are complementary because no single approach can find every error. The primary advantage of dynamic analysis: It reveals subtle defects or vulnerabilities whose cause is too complex to be discovered by static analysis. Dynamic analysis can play a role in security assurance, but its primary goal is finding and debugging errors. The primary advantage of static analysis: It examines all possible execution paths and variable values, not just those invoked during execution. Thus static analysis can reveal errors that may not manifest themselves until weeks, months or years after release. This aspect of static analysis is especially valuable in security assurance, because security attacks often exercise an application in unforeseen and untested ways.
- Static analysis is the testing and evaluation of an application by examining the code without executing the application whereas Dynamic analysis is the testing and evaluation of an application during runtime. Many software defects that cause memory and threading errors can be detected both dynamically and statically. The two approaches are complementary because no single approach can find every error. The primary advantage of dynamic analysis: It reveals subtle defects or vulnerabilities whose cause is too complex to be discovered by static analysis. Dynamic analysis can play a role in security assurance, but its primary goal is finding and debugging errors.
Level of in-depth review
- The key difference between a static and dynamic code analyser is the how in-depth the code review process is. By default, static code analysis combs through every single line of source code to find flaws and errors. For dynamic analysis, the lines of code that get reviewed depend upon which lines of source code are activated during the testing process. Unless a line of code is interacted with, the dynamic analysis tool will ignore it and continue checking active codes for flaws. As a result, dynamic analysis is a lot quicker since it is able to review code on the fly and generates real-time data. However, static code analysis provides peace of mind that each and every line of source code has been thoroughly inspected. It may take longer, but static code analysis runs in the background and is crucial for creating a flawless web application.
Catching errors early and making recommendations
- The primary advantage of static analysis: It examines all possible execution paths and variable values, not just those invoked during execution. Thus static analysis can reveal errors that may not manifest themselves until weeks, months or years after release. This aspect of static analysis is especially valuable in security assurance, because security attacks often exercise an application in unforeseen and untested ways.
- As mentioned before, dynamic analysis reviews codes during the testing process and generates real-time results. While it is great for fine-tuning the user experience, it has one major drawback: any errors highlighted by dynamic code analysis tools requires developers to go all the way back to the source code, make changes to the code itself and then make changes to everything that has been modified as a result of changing the source code. This is a very time consuming and expensive process; one that companies and developers like to avoid at all costs. Static code analysis tools highlight any errors immediately and allow developers to makes changes before proceeding any further. Moreover, static code analysis tools are more feature-packed than their dynamic counterparts. One important feature is the number of errors it can detect and the recommendations it can make to fix that error. If configured, static code analysers can automatically make the required changes and let developers know what changes have been made.
Cost of code analysis tools
- Just like any other business, software application companies have to find a fine balance between application costs and profit margins. With respect to price, static code analysis tools are always cheaper than dynamic analysers. Moreover, having a dynamic code analyser requires a company to hire professionals trained in the use of dynamic analysis tools. A static code analysis tool can be used by any web developer with ease, thus guaranteeing that it won’t turn out to be a long-term expenditure. Static code analysers are absolutely essential for application developers, whereas dynamic code analysers can only be used in conjunction with static analysis tools.
2. Explain the following with relevant force-displacement graph
- Elastic behaviour
- Inelastic behavior
- Plastic behavior
- Non-linear Inelastic behaviour
Ans
Understanding the behaviour of materials and structures under load is critical in structural engineering. The behaviour of materials can be described using force-displacement graphs, which help illustrate how materials respond to applied forces.
Let's explain each of the terms mentioned and provide relevant force-displacement graphs for each:
1. Elastic Behavior:
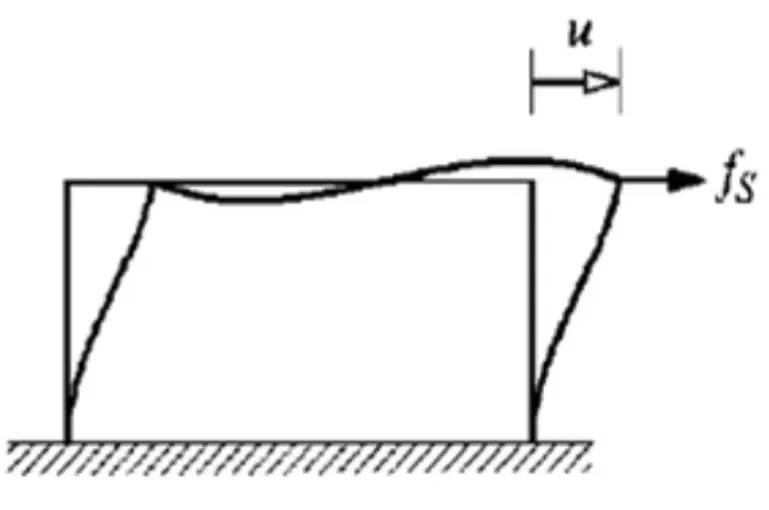
Elastic behaviour refers to the property of a material or structure to return to its original shape and size after the applied force is removed. This means that when a force is applied, the material deforms elastically, and when the force is released, it returns to its initial state with no permanent deformation.
Here's a relevant force-displacement graph for elastic behaviour:
2. Inelastic Behavior:
Inelastic behaviour occurs when a material or structure undergoes permanent deformation even after the applied force is removed. Inelastic behaviour can occur due to factors like plastic deformation, cracking, or yielding, and it implies that the material or structure does not return to its original state.
Here's a relevant force-displacement graph for inelastic behaviour: 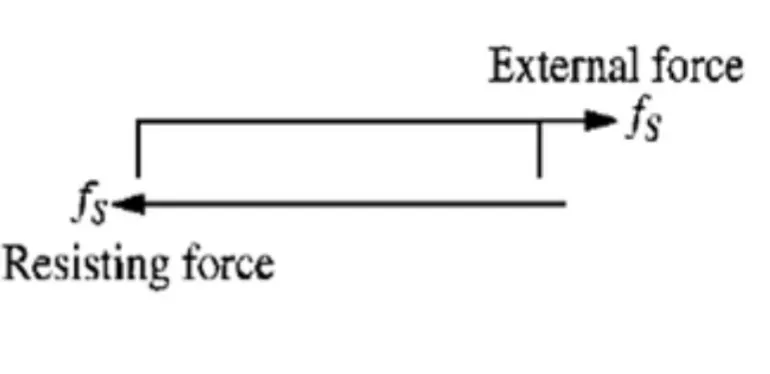 3. Plastic Behavior:
Plastic behaviour is a specific type of inelastic behaviour where a material undergoes permanent deformation without a significant increase in stress. It typically occurs after a yield point is reached. In plastic behaviour, the material deforms plastically, but the applied force may not increase significantly.
Here's a relevant force-displacement graph for plastic behaviour: 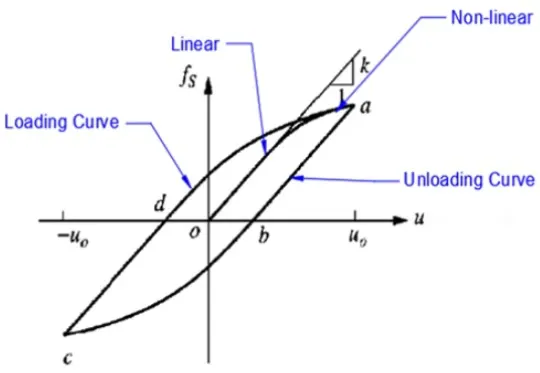
4. Non-linear Inelastic Behavior:
Non-linear inelastic behaviour is a more complex form of inelasticity where the relationship between force and displacement is not linear. This behaviour can involve a combination of elastic, plastic, and other deformations, and the stress-strain curve may exhibit multiple peaks and valleys.
Here's a relevant force-displacement graph for non-linear inelastic behaviour: 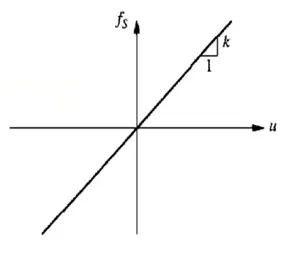
3. Explain Mass, Stiffness and damping components in the equation of motion
Ans
In the context of structural and mechanical engineering, the equation of motion describes the behaviour of a dynamic system subjected to external forces or excitations. The equation of motion typically includes three main components: mass, stiffness, and damping.
Let's explain each of these components:
1. Mass (M): Mass represents the inertia of a system, which is its resistance to changes in motion. In the context of the equation of motion, mass refers to the physical mass of the object or structure being analyzed. The greater the mass, the more force is required to accelerate or decelerate the object. In mathematical terms, mass (M) is typically represented as a scalar constant.
The force is related to the mass component with the equation of fi=Mu¨
2. Stiffness (K): Stiffness is a measure of the system's resistance to deformation or displacement under an applied force. It quantifies how much a system resists changes in shape or position. In the context of structural analysis, stiffness is often related to the material properties and geometry of the structure. For mechanical systems, it may refer to the stiffness of springs, rods, or other elements. Stiffness (K) is typically represented as a positive constant in the equation of motion.
The force is related to the stiffness component with the equation of fs=Ku
3. Damping (C): Damping represents the dissipation of energy within a dynamic system. It accounts for the resistance to motion caused by various internal and external factors, such as friction, air resistance, or energy losses within the system. Damping helps model how a system's motion gradually comes to rest or stabilizes after being subjected to external forces or excitations. Damping (C) is typically represented as a positive constant in the equation of motion.
The force is related to the damping component with the equation of fd=Cu˙
The general form of the equation of motion for a dynamic system can be expressed as:
M⋅u¨+C⋅u˙+K⋅u=P(t)
Where:
- M represents the mass of the system.
- u¨ represents the acceleration of the system (the second derivative of displacement concerning time).
- C represents the damping coefficient.
- u˙ represents the velocity of the system (the first derivative of displacement concerning time).
- K represents the stiffness of the system.
- u represents the displacement of the system.
- P(t) represents the external forces or excitations applied to the system as a function of time
- This equation of motion describes how the dynamic system responds to external forces (P(t)) based on its mass (M), stiffness (K), and damping (C) properties. The interplay of these three components determines the system's behaviour, including its natural frequencies, damping ratios, and response to various excitations. Engineers use this equation to analyze and design systems across various engineering disciplines.
4. Provide relationship between Natural period (Tn) & Natural frequency (f) and provide their definitions
Ans
Natural period:
- Natural Period Tn of a building is the time taken by it to undergo one complete cycle of oscillation. It is an inherent property of a building controlled by its mass m and stiffness k. These three quantities are related by its units are seconds (s)
- The natural period of a building is simply a time taken by it to undergo one complete cycle of oscillation.
- The natural period is one of the properties or building which is controlled by mass and stiffness.
- Formula to find out natural period is,
Tn =2π√(m/k)
where,
- Tn is a natural period of building.
- m is mass
- k is stiffness
Reciprocal of the natural period of a building is nothing but the natural frequency and its unit is Hertz(Hz)
simply put, the time period of a building is it’s natural period of oscillation when subjected to ground shaking in the event of an earthquake.
The building is modelled to be under harmonic oscillation and the time period is calculated in a similar way as in harmonic oscillation
T = 2π√(k/m)
where k is the total stiffness and m is the total mass.
- k is calculated as the sum of the lateral stiffness of all stiffness providing and moment resisting vertical members (colomns, moment resisting frames, sheer walls, etc.) m is calculated as the sum of masses of all members on the storey.
Natural frequency (f) :
f=√stiffness/√Mass of structure.
- Take the case of a very tall building which is susceptible to damage whan earthquake occur will have higher group and hence lower natural frequency.
- Thereby, it is desirable to have higher natural frequencies. Also, at low natural frequencies, the structure can resonate easier and hence lead to amplification.
- I do not know enough about building dynamics to comment about this mathematically, but this is a plausible argument.
- A building’s natural frequency (n) is simply the inverse of the fundamental period (T), and, for flexible and dynamically sensitive buildings and other structures, this natural frequency is used in the calculation of the Gust Factor. The ASCE 7 standard specifies that buildings are considered “flexible” if they have a fundamental period greater than 1 second. Tall building or moment-frame buildings tend to be more flexible than others, so these code criteria can have a significant impact on their design and their construction costs. And engineering judgement is required when the natural frequency/fundamental period of the structure is near 1.0 and note that the nonbuilding structure or components with the fundamental period less than 0.06 s shall be considered a rigid element.
5. Explain in detail about Response spectrum & its Graph
Ans
- A response spectrum is a graphical plot of the frequency of an oscillator and its damping. The response spectrum plot represents the peak or steady-state response (velocity, displacement, or acceleration) of a series of oscillators of varying natural frequency. In vibration analysis of any system, the response spectrum is very useful as the resulting plot can provide the response of any linear system with respect to its natural frequency. The response spectrum finds its usage in interpreting seismic or earthquake events and slug flow events.
- Response Spectrum Analysis is a scientific method for estimating the structural response of dynamic vibration events. To perform the response spectrum analysis, the first job is to define the response spectrum of the system. In this article, we will explore the basics of the response spectrum and learn the steps for performing seismic/earthquake analysis using the response spectrum analysis method.
Response Spectrum Analysis Method
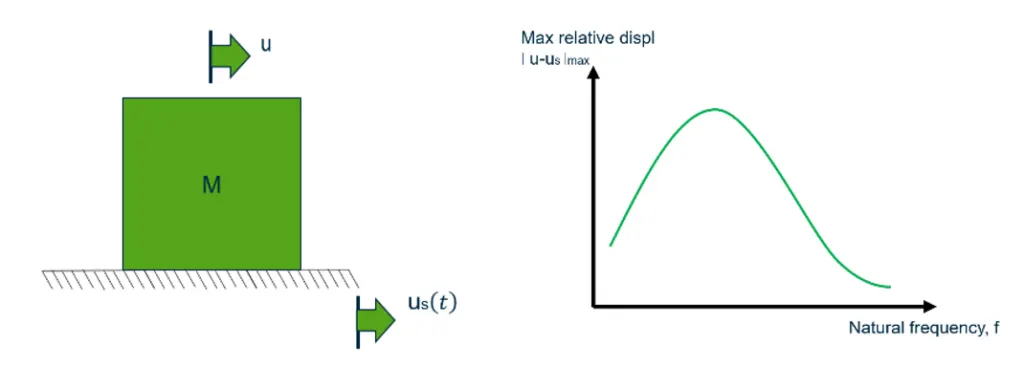
- Response spectrum plot gives the maximum response (that maybe maximum displacement, maximum velocity, maximum acceleration, or any other parameter of interest) to the natural frequency (or natural period) subjected to specified excitation for linear single degree of freedom system oscillators. These plots are subjected to specific damping and it changes as damping changes.
Parameters affecting Response Spectram
The response spectral values are dependent on various factors like,
- Soil condition
- Energy release mechanism
- Damping in the system
- Epicentral distance
- Focal depth
- Richter magnitude
- Time period of the system
Construction of Response Spectrum Plot
- The construction of Response Spectrum requires the solution of a single degree of freedom systems, for a sequence of natural frequency values and damping ratio in the range of interest. Every solution provides only one point (with the maximum value) of the response spectrum. All of these maximum response values are plotted against natural frequency to construct a single response spectrum.
- Since a large number of systems must be analyzed in order to fully plot each response spectrum, the task is lengthy and time-consuming. But once these curves are constructed and available for the excitation of interest, the analysis for the design of structure subjected to dynamic loading is reduced to a very simple calculation of the natural frequency of the system and the use of response spectrum to calculate the maximum response.
- These response spectrum plots are created for specific areas of regions and different for different regions. The study of geographic areas combined with an assessment of historical earthquakes allows geologists to determine and to create for respective areas, which show the likely maximum response values to be experienced in a region during an earthquake.