Structural dynamics
Structural dynamics
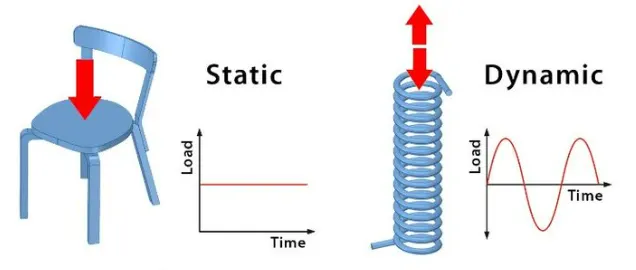
AIM1 :Differentiate Static analysis and Dynamic analysis with proper representing pictures
EXPLAINATION : The differentiaton between Static and Dynamic analysis
| Static Analysis | Dynamic Analysis |
| 1. Static analysis time invariant analysis of forces like Stress, strain and displacement etc. | Dynamic analysis is time dependent analysis |
| 2. Static loads applied on structure slowy | Dynamic Loads applied on the structures Suddenly |
| 3. Static analysis done with minimum three degree of freedom | Dynamic analysis of structure done with single degree of freedom |
| 4. Static analysis done where the structure deformations behave linear | Dynamic analysis done where structure behaves non-linear deformations |
| 5. The results are a consequence of the applied constraints and loads, for example, bearings, gravity, forces, etc. | Inertia and damping forces taken into account |
| 6. Example- Dead Load , Live load | Example- Earthquake load , Wind Load |
Static analysis time invariant analysis of forces Dynamic analysis is time dependent analysis
AIM 2 : Explain the following with relevant force-displacement graph
- Elastic behavior
- Inelastic behavior
- Plastic behavior
- Non-linear Inelastic behavior
EXPLAINATION :
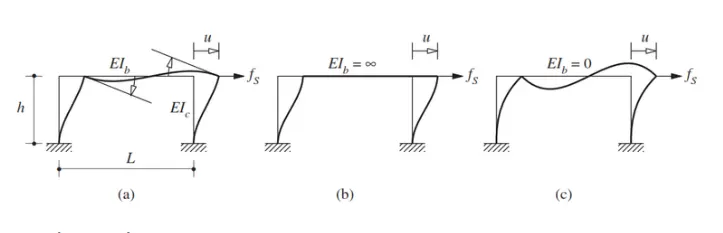
1. Elastic Behaviour : Ability of deformed matrrial body to return to its original shape and size when force causing the deformation are removed for Example:Consider the frame a with shown parameters L,h,E and second moment of area about the axis of bending ,when the flexural rigidity of Beam is infinty then stiffness(k) of the column will be k=∑12EIc/h3 for columns, but if stiffness of the beam is Zero of no stiffness (then EIb=0) k =3EIc/h3
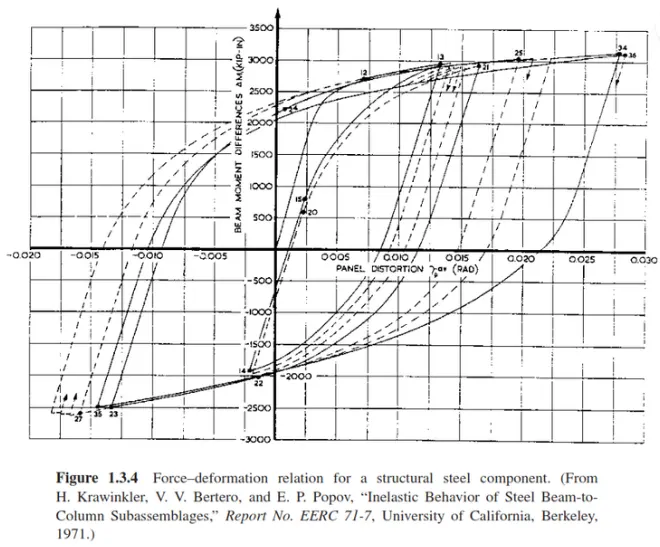
2. Inelastic Behaviour : Determined by experiments, the force–deformation relation for a structural steel component undergoing cyclic deformations expected during earthquakes. The initial loading curve is nonlinear at the larger amplitudes of deformation, and the un-loading and reloading curves differ from the initial loading branch; such a system is said to be inelastic. This implies that the force–deformation relation is path dependent, i.e., it depends on whether the deformation is increasing or decreasing.
3. Plastic Behaviour of structure : Plastic behiviour known as permanent deformation after that member can not attains its original shape or position of deformation or displacement
4. Non-Linear Inelastic behaviour : Force displacement relation Becomes Non-linear and inelastic at large deformations. For fs corresponding to the deformation is not single valued and depends on history of deformations and whether deformation is increasing or decreasing thus the resisting force can be expressed as fs=fs(u,v)
AIM 3 : Explain Mass, Stiffness & Damping components in the equation of motion
EXPLAINATION :
Single degree of freedom system can be viewed as combination of 3 independent system as follows :
- The stifffness component- ; the frame without damping or mass , the external forces fs on the stiffness componenet is relaed to displacement by u by fs=ku if the system is linearly elastic
- The Damping component -: the frame with its damping property but no stiffness or mass the external force on the damping component is related to velocity by fd=cv
- The mass component = The roof mass without the stiffness or damping of the frame the external force fi on the mass component is related to acceleration by fi=mu
Equation of motion
P-fs-fD=m*u(acceleration)
m*u+fD+fs=P(t)
m*u+c*u(velocity)+k*u=P(t)
where,
m-Mass
k-Stiffness
fD-Damping force [ fD=c*u ; c-viscous damping coeff ; u-velocity ]
(Damping force is related to velocity across linear viscous damper )
Equation of motion:Earthquake excitation
m*u(acceleration)+c*u(velocity)+k*u=-m*ug(t)
AIM 4 : Provide relationship between Natural period (Tn) & Natural frequency (f) and provide their definitions
EXPLAINATION :
Natural Period(Tn): Time required for undamped system to complete one cycle of free vibration. Unit is Seconds
Tn=2π/Wn
Natural Frequency(f): Number of cycle (or one complete revolution) executed by system in one second. Unit is hertz
f=1/Tn
Natural vibration properties Wn, Tn and f are depends only on mass and stiffness of structure
Aim 5 : Explain in detail about Response spectrum & its Graph
EXPLAINATION :
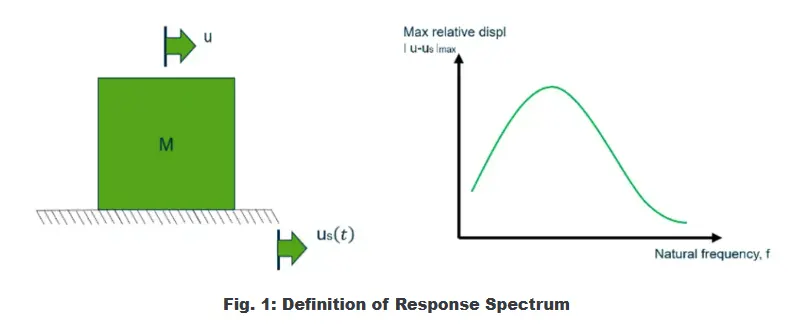
Response spectrum analysis is a method to estimate the structural response to short, nondeterministic, transient dynamic events. Examples of such events are earthquakes and shocks. Since the exact time history of the load is not known, it is difficult to perform a time-dependent analysis.
A response spectrum is a function of frequency or period, showing the peak response of a simple harmonic oscillator that is subjected to a transient event. The response spectrum is a function of the natural frequency of the oscillator and of its damping. Thus, it is not a direct representation of the frequency content of the excitation (as in a Fourier transform), but rather of the effect that the signal has on a postulated system with a single degree of freedom (SDOF) . A plot of peak value of response quantity (u, v and a) as a function of natural vibration perod(Tn) of system is called Response Spectrum for that quantity. Pseudo acceleration for an SDF system with natural frequency is related to its peak deformation, D=uo
Response spectrum plot gives the maximum response (that maybe maximum displacement, maximum velocity, maximum acceleration, or any other parameter of interest) to the natural frequency (or natural period) subjected to specified excitation for linear single-degree-of-freedom system oscillators. These plots are subjected to specific damping and it changes as damping changes as shown below :