Structural dynamics
CHALLENGE 2:
Structural dynamics
QUESTION NUMBER 1:
Differentiate Static analysis and Dynamic analysis by properly representing pictures
ANSWER:
The nature of loading governs the kind of analysis to be performed on the structure. The loads are divided into two basic categories
- Static Loads are the loads, the variation of load with respective time is very slow (the acceleration of load is very very less than the natural frequency of the structure)
- Dynamic Loads are the loads, the variation of load with respective time is fairly quick in comparison to the structure's natural frequency.
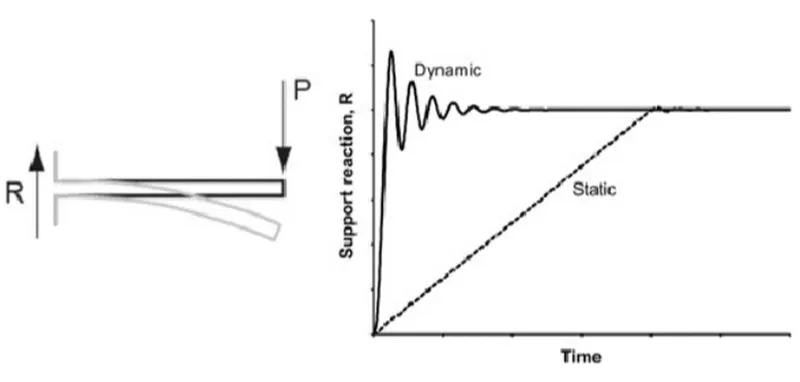
| Static Analysis | Dynamic Analysis |
| 1. static analysis time-invariant analysis of forces like Stress, strain, displacement, etc. | 1. Dynamic analysis is a time-dependent analysis |
| 2. The results are a consequence of the applied constraints and loads, for example, bearings, gravity, forces, etc. | 2. Inertia and damping forces are taken into account |
| 3.Static loads applied on structure slowy | 3.Dynamic Loads applied on the structures Suddenly |
| 4. Example- Dead Load, Live load | 4. Example- Earthquake load, Wind Load |
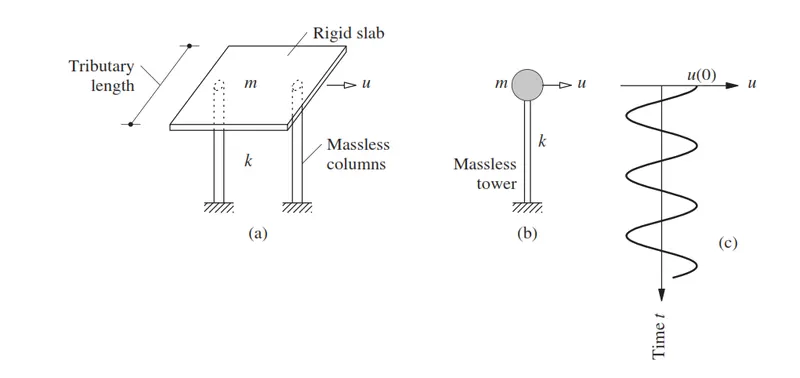
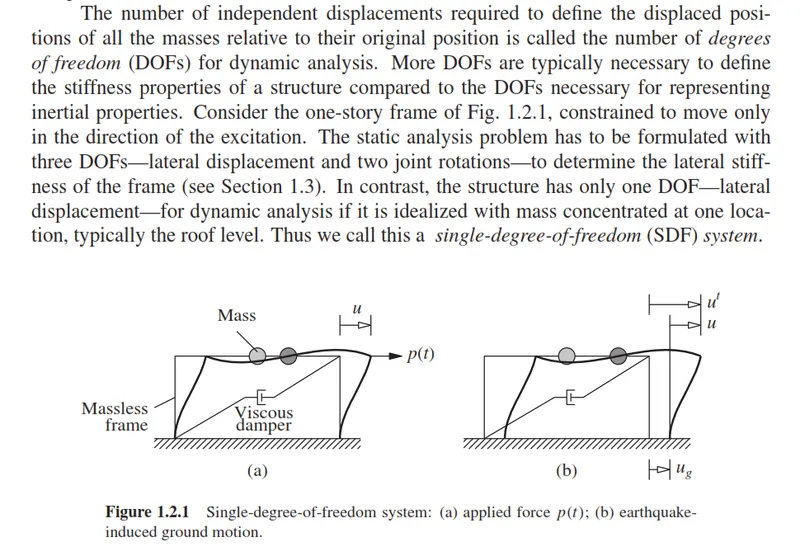
| 5. Static analysis was done with a minimum of three degrees of freedom. |
5. Dynamic analysis of structure done with a single degree of freedom |
| 6. Static analysis is done where the structure deformations behave linearly. | 6. Dynamic analysis is done where the structure behaves in non-linear deformations |
In the dynamic analysis, we assume the mass is concentrated at a point with a single degree of freedom as seen in below picture,
QUESTION NUMBER 2:
Explain the following with a relevant force-displacement graph
- Elastic behavior
- Inelastic behavior
- Plastic behavior
- Non-linear Inelastic behavior
ANSWER:
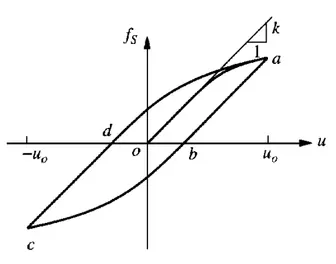
- Under cyclic deformation due to earthquake, the initial loading curve is non-linear with a larger amplitude of formation.
- After initial loading there are unloading and reloading curves. Both differ from the initial loading branch.
- We see that at a certain point in cyclic loading, it become-linear until point (a).
- Then there is unloading then the load moves in the negative direction and then there is reloading then it does not follow the initial unloading path. It will follow a new path.
- This implies the fs corresponding to an inbuilt direction (lateral deformation) is not a single value. It depends on the history of deformation
Force-displacement graph of Elastic behavior:-
- Elasticity is the ability of a deformed material body to return to its original shape and size when the forces causing the deformation are removed.
- For a linear elastic system the relationship between the lateral force fs and resulting deformation u is linear that is, fs=ku; where k is the lateral stiffness of the system; its unit is force/length.
- In linear deformation k is constant.
- This deformation would be linear at a smaller displacement. But would become nonlinear at larger deformations.
- Elastic behavior is the property of the material up to which the material can retain its shape. From the aforementioned graph, it is clearly mentioned that up to a certain point from "O," the graph is linear and shows its elastic properties.
Force-displacement graph of Inelastic behavior:-
- For extreme loadings, the structure is allowed to experience a limited amount of deformation beyond the elastic limit.
- This deformation is called “inelastic” since in contrast to elastic deformation when the loading is removed, the structure does not return to its original position.
- Inelastic behavior is the property of the material when the material can't retain its previous shape after a certain deformation. In the aforementioned graph, inelastic behavior has been shown in the upper shape of the curve up to point "a".
Force-displacement graph of Plastic behavior:-
- For stresses beyond the elastic limit, a material exhibits plastic behavior.
- This means the material deforms irreversibly and does not return to its original shape and size, even when the load is removed.
- When stress is gradually increased beyond the elastic limit, the material undergoes plastic deformation.
- Plastic behavior occurs when the material completely lost its ductility. In the above-mentioned graph, plastic behavior occurs during unloading after point "a".
Force-displacement graph of Non-linear Inelastic behavior:-
- Force displacement relationship becomes non-linear and inelastic at large deformations
- Force fs corresponding to deformation is no single-valued and depends on the history of deformations and whether deformation is increasing or decreasing. Thus the resisting force can be expressed as fs=fs(u,v).
- Non-linear inelastic behavior occurs after the line from "O" tends to bend towards point"a".
QUESTION NUMBER 3:
Explain Mass, Stiffness & Damping components in the equation of motion
ANSWER:
The single degree of freedom system can be viewed as a combination of 3 pure independent system
- The stiffness component
- The damping component
- The mass component
The stiffness component:-
- The term stiffness is used in earthquake engineering to designate how well a building will endure large lateral displacements imposed by ground shaking.
- Stiffness is a measure of how much force is required to displace a building by a certain amount. The frame is without damping or mass.
- The external force fs on the stiffness component is related to displacement u by fs=ku
- If the system is linearly elastic.
The Damping component:-
- Damping is the dissipation of vibratory energy in solid mediums and structures over time and distance.
- Similar to the absorption of sound in air, damping occurs whenever there is any type of friction that diminishes movement and disperses the energy.
- The frame with its damping property but no stiffness or mass.
- The external force on the damping component is related to velocity by fd=cv.
The mass component:-
- The vertical irregularities in structures are Stiffness irregularity, Mass irregularity, Vertical geometric irregularity, and Discontinuity in capacity. A. Centre of Mass.
- The center of mass is a position defined as the average position of all the parts of the system, weighted according to their masses.
- The roof mass without the stiffness or damping of the frame.
- The external force f1 on the mass component is related to acceleration by fi=mu¨
mu¨+ fd + fs = p(t) that is mu¨ + cu˙ + ku = p(t)
Now, the external force p(t) is applied to the complete system. They may therefore be visualized among the 3 components of the structure. That is inertial, stiffness, and damping force
QUESTION NUMBER 4:
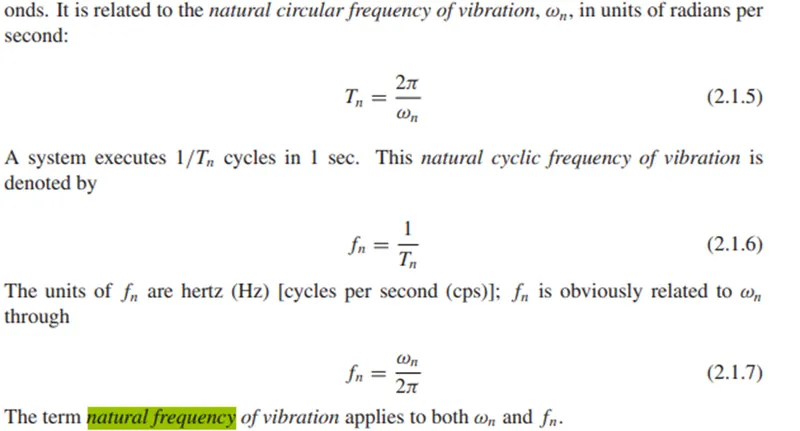
Provide the relationship between Natural period (Tn) & Natural frequency (f) and provide their definitions
ANSWER:
Natural frequency (f):
Natural frequency, also known as eigenfrequency, is the frequency at which a system tends to oscillate in the absence of any driving force. Also referred to as wn
Natural period (Tn):
The period of one complete oscillation of a body or system.
Relationship:
- Both refer to quantities which are mass and stiffness.
- Natural frequency is inversely proportional to the natural period.
- The following formulas are taken from the book, Dynamics of structure,
QUESTION NUMBER 5:
Explain in detail about Response spectrum & its Graph
ANSWER:
- A central concept in earthquake engineering, the response spectrum is a practical means of characterizing ground motion and its effects on structures of different Tn.
- It provides a convenient means to summarize the peak response of all possible linear single-degree-of-freedom systems to a particular component of ground motion.
- It also provides a practical approach to applying the knowledge of structural dynamics to the design structures and development of lateral force requirements in building codes.
- A plot of the peak value of a response quantity (u, v, and a) as a function of the natural vibration period Tn of the system, or a related parameter such as circular frequency ωn or cyclic frequency fn, is called the response spectrum for that quantity.
- Each such plot is for Single Degree of Freedom systems having a fixed damping ratio Շ, and several such plots for different values of Շ are included to cover the range of damping values encountered in actual structures.
- A variety of response spectra can be defined depending on the response quantity plotted. Consider the following peak responses.
- The response spectrum can be of 2 types. The deformation response spectrum is a plot of peak u, against Tn for fixed Շ.
- A similar plot for peak u˙ is the relative velocity response spectrum, and for the peak u¨, is the acceleration response spectrum.
Deformation Response Spectrum:-
- Here is the particular ground motion that is an L-Centro earthquake.
- The response developed for the r L-centro earthquake is shown.
- Now, the time variation of the deformation induced in the ground motion in 2 different single degrees of freedom systems is presented.
- Every single degree of freedom has as its own period of vibrations that is Tn=1sec and Tn=2sec. And the damping ratio was kept constant.
- Each of the single-degree freedom systems subjected to this earthquake. That is the displacement history that we obtain.
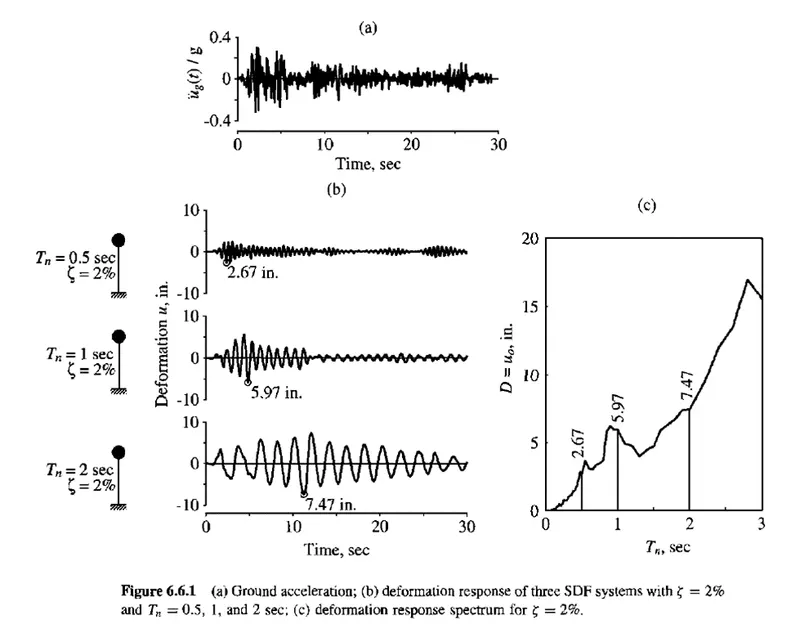
- First Peak deformation we obtain is 2.67 inch for Tn=0.5sec and Շ = 2%
- Second Peak deformation we obtain is 5.97 inch for Tn=1sec and Շ = 2%
- Third Peak deformation we obtain is 7.47 inch for Tn=2sec and Շ = 2%
- In x-axis it shows the natural period of vibration and y-axis peak displacement.
- Now, to determine the peak deformation value, repeat the process again and compute displacement for natural period vibration.
- For a range of single degree of freedom system with different period of vibration keep the damping ratio as constant.
- For getting the peak period of vibration that is displacement from response spectrum curve. That deformation can be multiplied by stiffness to get an equivalent static force.
- From there we can do a simple structural analysis to obtain the bending moment and shear force in the structure.
Pseudo-Acceleration Response Spectrum:-
- Pseudo acceleration for a single degree of freedom system with natural frequency ωn is related to its peak deformation D = uo, due to earthquake ground motion:
A = (ωn^2) * D = ((2π/Tn)^2) * D.
- The quantity A has units of acceleration and is related to the peak value of base shear Vbo (just another name for the peak value of the equivalent static force fso):
Vbo = fso = mA (or) Vbo = (A/g)*ω.
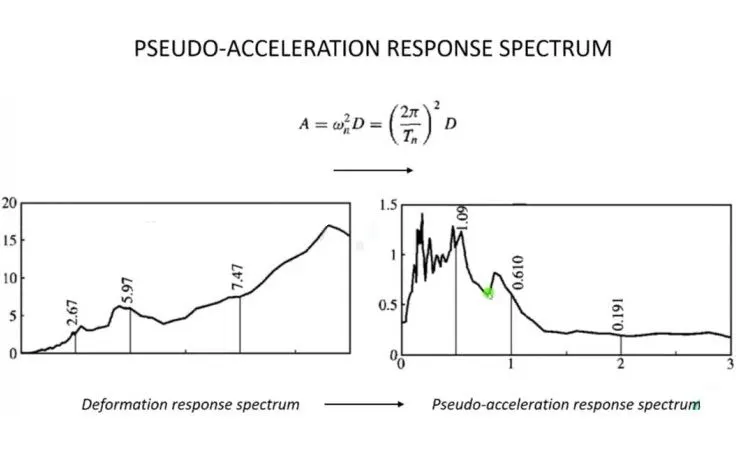
- A(t) is called pseudo acceleration and can be easily obtained by multiplying deformation at each instant of time with
ωn^2 = ((2π/Tn)^2).
- Most codes worldwide are force-based values related to peak acceleration are mentioned in the code and those values can be easily multiplied by the mass of the structure to obtain the equivalent static force.
- When equivalent static force is expressed in the form of deformation.
- The stiffness of the system is to be calculated and it can be a laborious task.
...........................................THE END..........................................................................................