Structural dynamics
AIM -
TO STUDY THE INTRODUCTION OF STRUCTURAL DYNAMICS
INTRODUCTION -
Structural dynamics is a type of structural analysis that covers the behavior of a structure subjected to dynamic (actions having high acceleration) loading. Dynamic loads include people, wind, waves, traffic, earthquakes, and blasts. Any structure can be subjected to dynamic loading. Dynamic analysis can be used to find dynamic displacements, time history, and modal analysis.
Structural analysis is mainly concerned with finding out the behavior of a physical structure when subjected to force. This action can be in the form of load due to the weight of things such as people, furniture, wind, snow, etc., or some other kind of excitation such as an earthquake, shaking of the ground due to a blast nearby, etc. In essence, all these loads are dynamic, including the self-weight of the structure because at some point in time these loads were not there. The distinction is made between the dynamic and the static analysis based on whether the applied action has enough acceleration in comparison to the structure's natural frequency. If a load is applied sufficiently slowly, the inertia forces (Newton's first law of motion) can be ignored and the analysis can be simplified as static analysis.
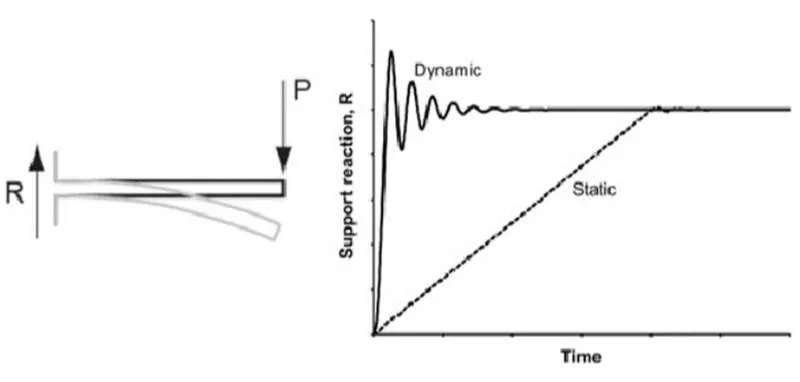
A static load varies very slowly. A dynamic load changes with time fairly quickly in comparison to the structure's natural frequency. If it changes slowly, the structure's response may be determined with static analysis, but if it varies quickly (relative to the structure's ability to respond), the response must be determined with a dynamic analysis.
Dynamic analysis for simple structures can be carried out manually, but for complex structures, finite element analysis can be used to calculate the mode shapes and frequencies.
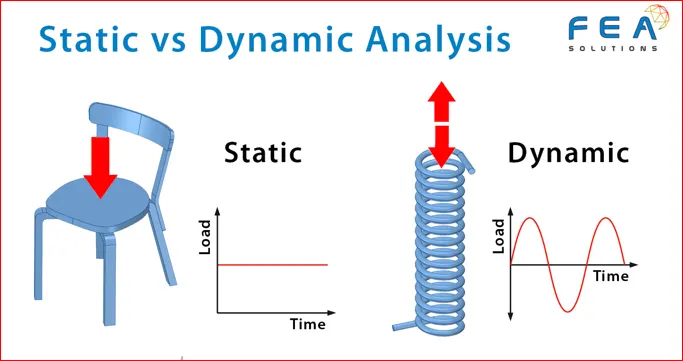
1. Differentiate Static analysis and Dynamic analysis with proper representing pictures
Ans :
Static analysis:
- A static structural analysis calculates the effect of steady (or static) loading conditions on a structure.
- It ignores inertia and damping effects, such as those caused by time varying loads.
- Static analysis is an essential procedure to design a structure.
- Using static analysis, the structure's response to the applied external forces is obtained. Moreover, the static analysis is performed when the structure is subjected to external displacements, such as differential support settlements.
- Load is not variable with time and neglected due to slow applying of load.
- Motion of the structure can be disregarded.
- Static analysis doesn't considered inertia force along with static force.
- The displacement obtained by static analysis is more.
- Static forces does not change in size, position or in direction
- Incase of building structures is static, the analysis is not sufficient for high ends.
- In static force analysis, inertia force and inertia torque caused by acceleration are neglected.
Dynamic analysis:
- Dynamic analysis is a type of structural analysis which covers the behavior of a structure subjected to dynamic (actions having high acceleration) loading.
- A dynamic load is any load that changes over time. These type of loads exert forces onto a structure that are often much greater than their static equivalents.
- Dynamic analysis is the testing and evaluation of a program by executing data in real-time.
- The objective is to find errors in a program while it is running, rather than by repeatedly examining the code offline.
- Load is variable with time due to fast applying of load and vibrations.
- Motion cannot be disregarded.
- Dynamic analysis considered inertia force along with dynamic force
- The displacement obtained by dynamic analysis are less.
- Whereas in dynamic forces changes in either size, position or in direction.
- Incase of building structures is dynamic, the analysis is sufficient for high ends.
- In dynamic force analysis, inertia force and inertia torque caused by acceleration are not neglected.
- Static Loads are the loads, the variation of load with respective time is very slowly (the acceleration of load is very very less than the natural frequency of the structure)
- Dynamic Loads are the loads, the variation of load with respective time is fairly quick in comparison to the structure's natural frequency.

====================================================================
2) Explain the following with relevant force-displacement graph
- Elastic behavior
- Inelastic behavior
- Plastic behavior
- Non-linear Inelastic behavior
Ans :
- Under cyclic deformation due to earthquake, the intial loading curve is non - linear with larger amplitude of formation.
- After initial loading there are unloading and reloading curves. Both differ from initial loading branch.
- We see that at certain point in cyclic loading it becomes non linear until the point (a).
- Then there is unloading then load moves in negative direction and then there is reloading then it doesnot follow intial unloading path. It will follow a new path.
- This implies the fs coressponding an inbuilt direction (lateral deformation) is not a single value. It depends on the history of deformation
- Elastic behavior:
Ability of a deformed material body to return to its original shape and size when the forces causing the deformation are removed. A body with this ability is said to behave elastically.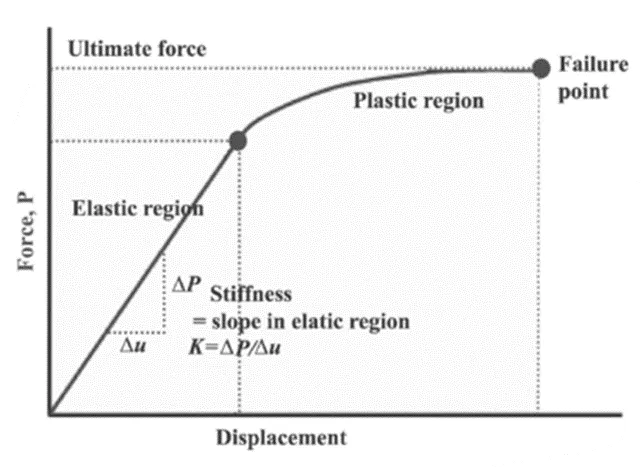
- Elasticity, ability of a deformed material body to return to its original shape and size when the forces causing the deformation are removed.
- For a linear elastic system the relationship between the lateral force fs and resulting deformation u is linear that is, fs=ku; where k is the lateral stiffness of the system; its unit are force/length.
- In linear deformation k is constant
- This deformation would be linear at smaller displacement. But would become non linear at larger deformations.
- Elastic behavior is the property of the material upto which the material can retain it's shape. From the aforementioned graph it is clearly mentioned that upto a certain point from "O" the graph is linear and shown its elastic properties.
- Inelastic behavior:
Material that does not return to its original shape after being deformed or when the external forced is removed.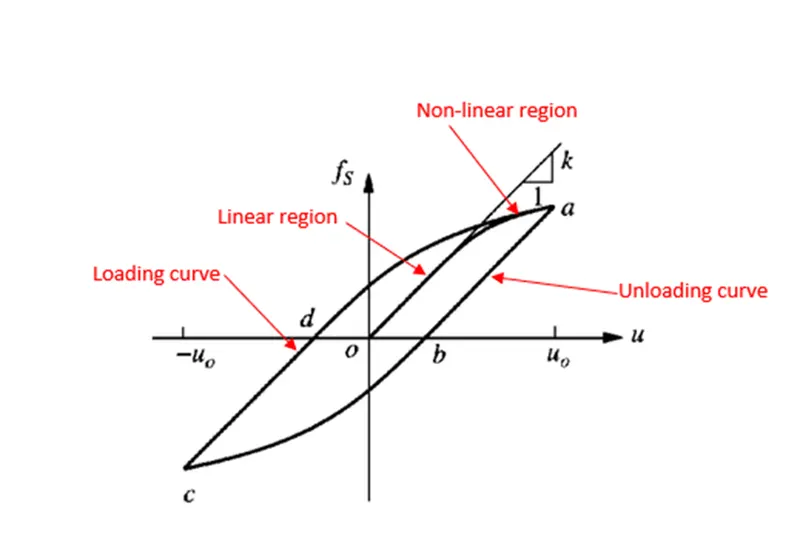
- For extreme loadings, the structure is allowed to experience a limited amount of deformation beyond the elastic limit.
- This deformation is called “inelastic” since in contrast to elastic deformation, when the loading is removed, the structure does not return to its original position.
- Inelastic behavior is the property of the material when the material can't retain it's previous shape after a certain deformation. In the aforementioned graph inelastic behavior has been shown in the upper shape of the curve upto point "a".
- Plastic behavior:
For stresses beyond the elastic limit, a material exhibits plastic behavior. This means the material deforms irreversibly and does not return to its original shape and size, even when the load is removed. When stress is gradually increased beyond the elastic limit, the material undergoes plastic deformation.
Plastic behavior
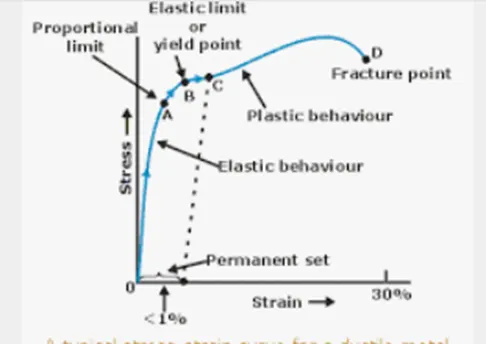
- For stresses beyond the elastic limit, a material exhibits plastic behavior.
- This means the material deforms irreversibly and does not return to its original shape and size, even when the load is removed.
- When stress is gradually increased beyond the elastic limit, the material undergoes plastic deformation.
- Plastic behavior occurs when the material completely lost it's ductility. In the above mentioned graph plastic behavior occurs during unloading after point "a".
- Non- linear elastic behavior:
Materials have elastic behavior usually only up to a certain load, which is called the 'yield point'. After that, the deformations are plastic. Rubber, for instance, has an elastic stress–strain curve, but the relation is not linear − in such cases nonlinear elastic models are required
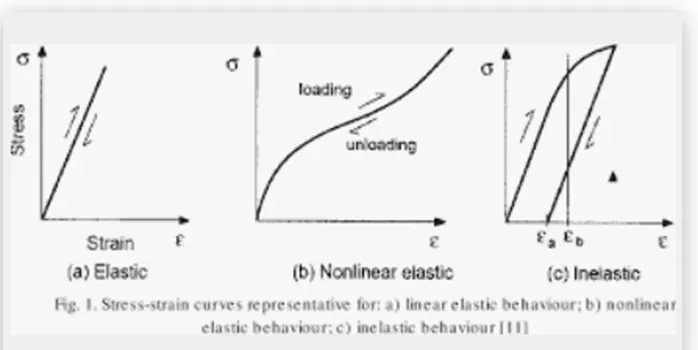
- Force displacement relationship becomes non-linear and inelastic at large deformations
- Force fs corresponding to deformation is not single valued and depends on history of deformations and whether deformations is increasing or decreasing. Thus the resisting force can be expressed as: fs=fs(u,v).
- Non-linear inelastic behavior occurs after the line from "O" tends to bend towards point"a".
====================================================================
3) Explain Mass, Stiffness & Damping components in the equation of motion
Ans : The Single Degree of Freedom System is a combination of 3 pure independent systems such as the stiffness, the damping, and the mass component.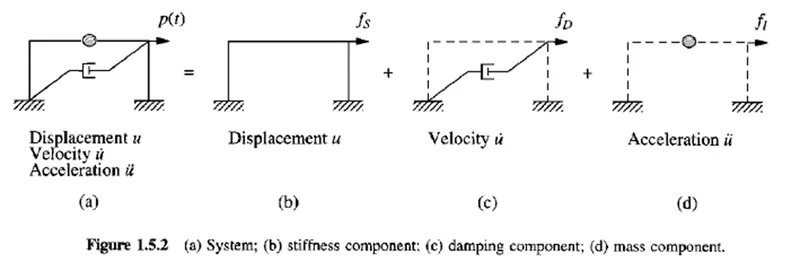
Stiffness Component – the frame without damping or mass. The external force fs on the stiffness component is related to displacement u by fs = ku if the system is linearly elastic.
- The term stiffness is used in earthquake engineering to designate how well a building will endure large lateral displacements imposed by ground shaking.
- Stiffness is a measure of how much force is required to displace a building by a certain amount.The frame without damping or mass.
- The external force fs on the stiffness component is related to displacement u by fs=ku
- If the system is linearly elastic.
Damping Component – the frame with its damping property with no stiffness or mass. The external force on the damping component is related to velocity by fd = cu’
where fd is the damping force, c is the viscous damping coefficient and ů is the velocity.
- Damping is the dissipation of vibratory energy in solid mediums and structures over time and distance.
- Similar to the absorption of sound in air, damping occurs whenever there is any type of friction that diminishes movement and disperses the energy.
- The frame with its damping property but no stiffness or mass .
- The external force on the damping component is related to velocity by fd=cv.
Mass Component – the roof mass without the stiffness or damping of the frame. The external force fi on the mass component is related to the acceleration by fi=mu”
fi + fd + fs = p(t)
mu” + cu’ + ku = p(t)
The external force p(t) is applied to the complete system. They may therefore visualize among the 3 components of the structure. That is inertial, stiffness and damping force.
- The vertical irregularities in structures are Stiffness irregularity, Mass irregular, Vertical geometric irregularity, Discontinuity in capacity. A. Centre of Mass.
- The centre of mass is a position defined as the average position of all the parts of the system, weighted according to their masses.
- The roof mass without the stiffness or damping of the frame.
- The external force f1 on the mass component is related to acceleration by fi=mu¨
mu¨+ fd + fs = p(t) that is mu¨ + cu˙ + ku = p(t)
Now, the external force p(t) is appilied to the complete system
====================================================================
4) Provide relationship between Natural period (Tn) & Natural frequency (f) and provide their definitions
Ans :
Natural period (Tn)
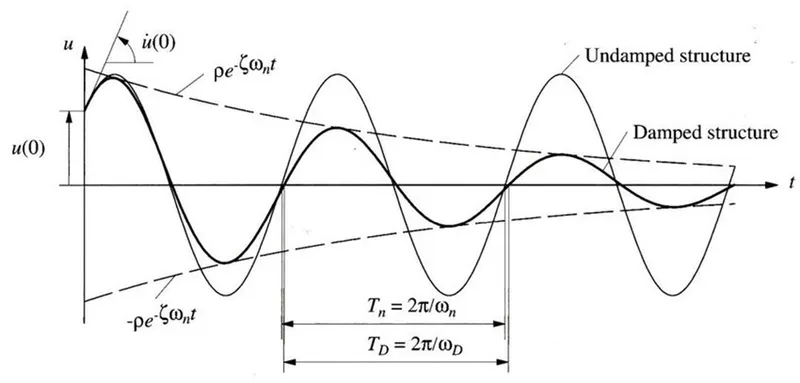
The time required to complete one cycle of vibration (unit is seconds). It is related to the natural circular frequency of vibration, ωn, in units of radian per second.
Tn = 2π/ωn
Natural frequency (f)
Natural frequency is the frequency of a body under free vibration. It is number of cycles per unit time. The unit of frequency is hertz.
fn=1/Tn
================================================================
5) Explain in detail about Response spectrum & its Graph
Ans : Response spectrum analysis is a method to estimate the structural response to short, nondeterministic, transient dynamic events. Examples of such events are earthquakes and shocks. Since the exact time history of the load is not known, it is difficult to perform a time-dependent analysis. Due to the short length of the event, it cannot be considered as an ergodic ("stationary") process, so a random response approach is not applicable either.
- A central concept in earthquake engineering, response spectrum is a pratical means of characterizing ground motion and their effects on structures of different Tn.
- It provides a convenient means to summarize the peak response of all possible linear single degree of freedom systems to a particular component of ground motion.
- It also provides a practical approach to apply the knowledge of structural dynamics to the design structures and development of lateral force requirements in building codes.
- A plot of the peak value of a response quantity (u, v and a) as a function of the natural vibration period Tn of the system, or a related parameter such as circular frequency ωn or cyclic frequency fn, is called the response spectrum for that quantity.
- Each such plot is for Single Degree of Freedom systems having a fixed damping ratio Շ, and several such plots for different values of Շ are included to cover the range of damping values encountered in actual structures.
- A variety of response spectra can be defines depending on the response quantity is plotted. Consider the following peak responses.
- The response spectrum can be of 2 types. The deformation response spectrum is a plot of peak u, against Tn for fixed Շ.
- A similar plot for peak u˙, is the realtive velocity response spectrum, for the peak u¨, is the acceleration response spectrum.
Deformation Response Spectrum:-
- Here is the paticular ground motion that is L-centro earthquake.
- The response developed for L-centro earthquake as shown.
- Now, the time variation of the deformation induced in the ground motion in 2 different single degree of freedom system is presented.
- Each single degree of freedom as its own period of vibrations that is Tn=1sec and Tn=2sec. And the damping ratio kept constant.
- Each of the single degre freedom system subjected this earthquake. That is the displacement history that we obtain.
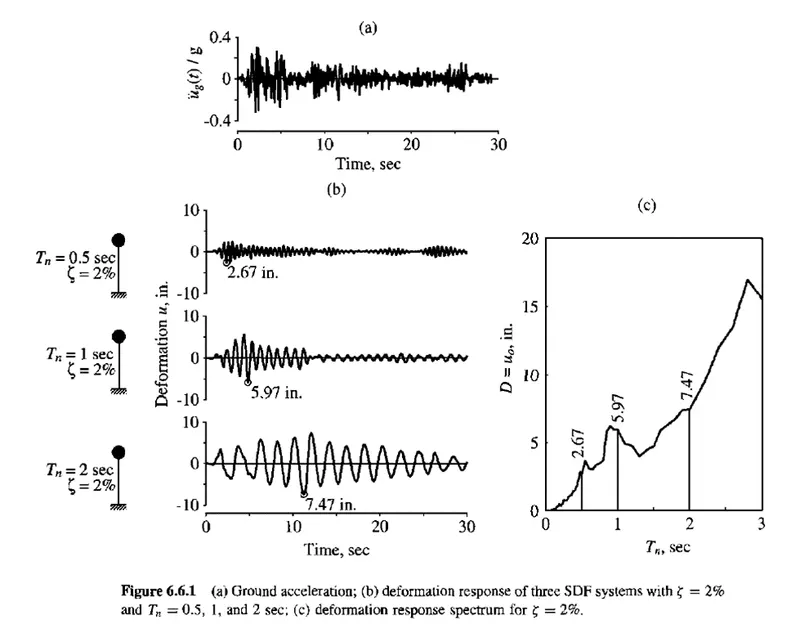
- First Peak deformation we obtain is 2.67 inch for Tn=0.5sec and Շ = 2%
- Second Peak deformation we obtain is 5.97 inch for Tn=1sec and Շ = 2%
- Third Peak deformation we obtain is 7.47 inch for Tn=2sec and Շ = 2%
- In x-axis it shows the natural period of vibration and y-axis peak displacement.
- Now, to determine the peak deformation value, repeat the process again and compute displacement for natural period vibration.
- For a range of single degree of freedom system with different period of vibration keep the damping ratio as constant.
- For getting the peak period of vibration that is displacement from response spectrum curve. That deformation can be multiplied by stiffness to get equivalent static force.
- From there we can do simple structural analysis to obtain the bending moment and shear force in the structure.
Pseudo-Acceleration Response Spectrum:-
- Pseudo acceleration for an single degree od freedom system with naturak frequency ωn is related to its peak deformation D = uo, due to earthquake ground motion: A = (ωn^2) * D = ((2π/Tn)^2) * D.
- The quantity A has units of acceleration and is related to the peak value of base shear Vbo (just another name for the peak value of the equivalent static force fso): Vbo = fso = mA (or) Vbo = (A/g)*ω.
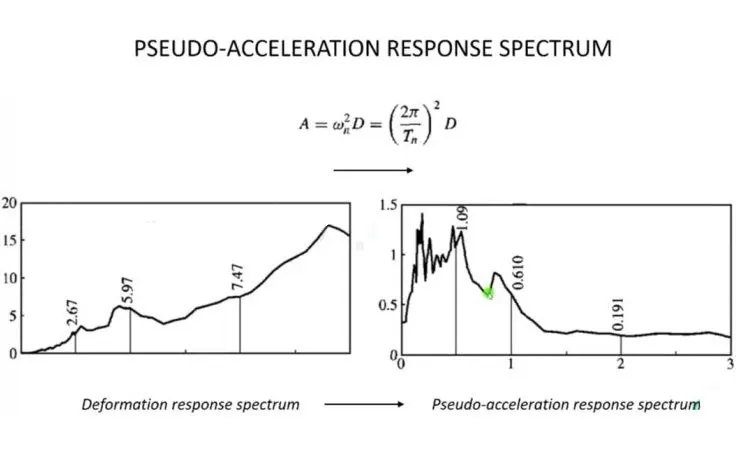
- A(t) is called pseudo acceleration and can be easily obtained by multiplying deformation at each instant of time with ωn^2 = ((2π/Tn)^2).
- Most codes world wide are force based values related to peak acceleration are mentioned in the code and those values can be easily multiply by mass of the structure to obtain the equivalent static force.
- When equivalent static force expressed in the form of deformation.
- The stiffness of the system as to be calculated and it can be leborious task.
====================================================================