Stress Analysis on Spur Gear using Ansys Workbench
Stress Analysis of a Spur Gear.
Aim: The aim of this challenge is to perform stress analysis on Spur gears under three different materials and compare their results.
Objective:
- To conduct static stress analysis on the Spur gear component and find out the Equivalent stress, Total deformation, and Stress intensity for the given different materials. Also, we need to find the area in which the component may fracture.
- To write a detailed report comparing the results of the three cases and conclude which material would you recommend based on these results.
Procedure:
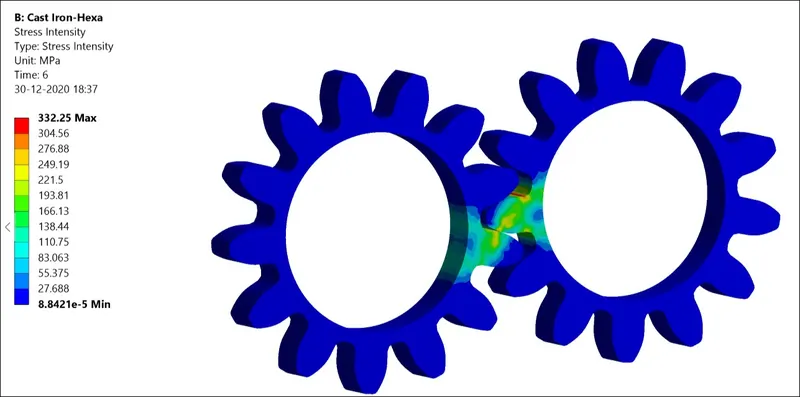
Stress Intensity: The stress intensity factor is a concept in Fracture Mechanics that is used to measure the stress concentration at a crack tip. In safety design, It is compared to a critical value and evaluate whether a component or structure is prone to fracture. The critical value is typically a material parameter and varies from material to material.
Model Setup:
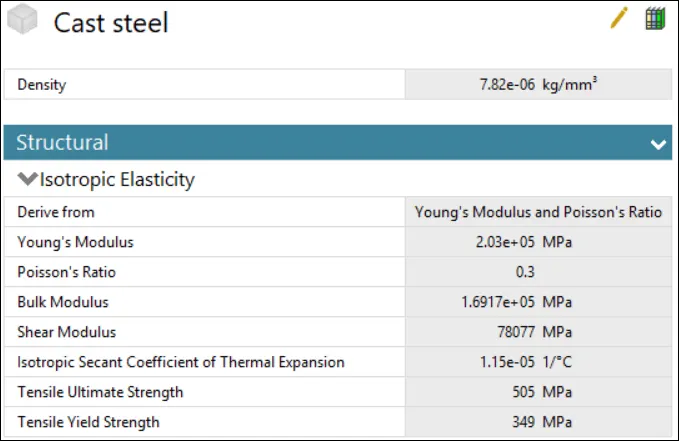
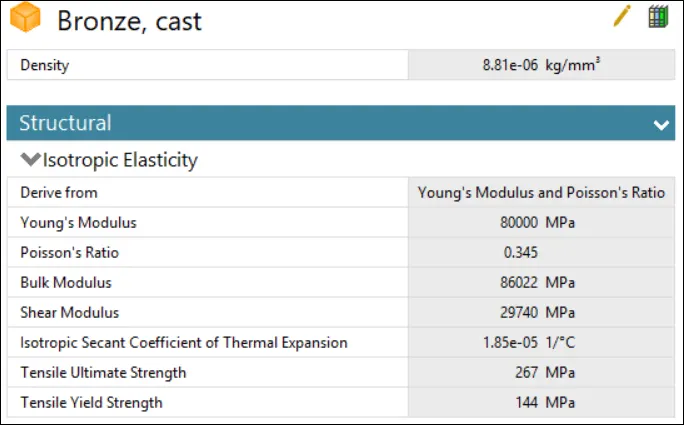
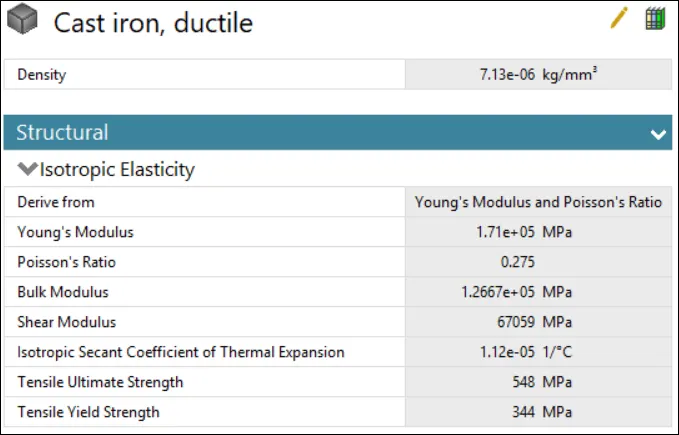
First, we will have to include the material we need from the Engineering data. The materials we will be using are Cast Iron(ductile), Cast Steel, and Cast Bronze.
Material data of Cast Iron ductile, cast steel, and cast bronze.
Once the Materials have been updated and selected for the gears we can start giving the connections.
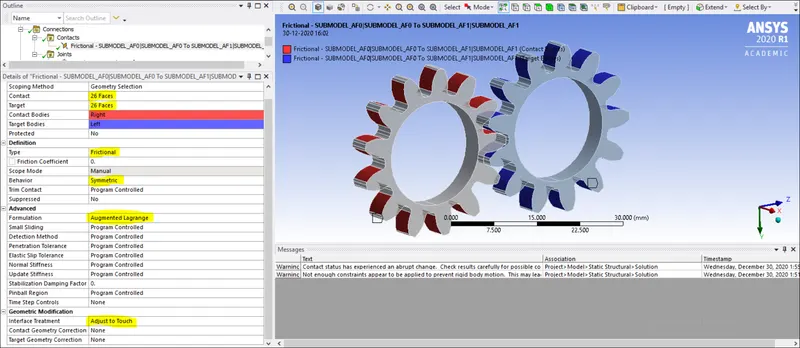
The contact and target show 26 faces as they have 13 teeth each, Two faces for each teeth. We need to select the only faces that may touch and provide connection type as Friction. We are avoiding other faces as it may increase the computational time. Behaviour is changed to Symmetric. The Formulation is selected to Augmented Lagrange. The interface treatment is given as Adjust to touch.
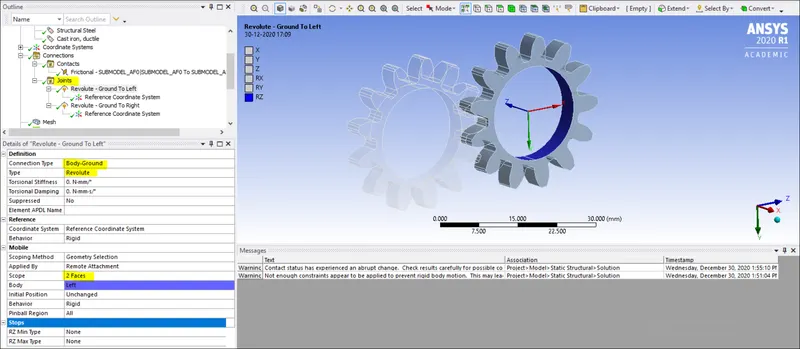
Since the Spur gear needs to rotate we will be providing the Connection type of Body-Ground then revolute to the inner surfaces of the gear. You can see that the given gear will be rotating along the Z-axis. The same thing will be done for the second gear.
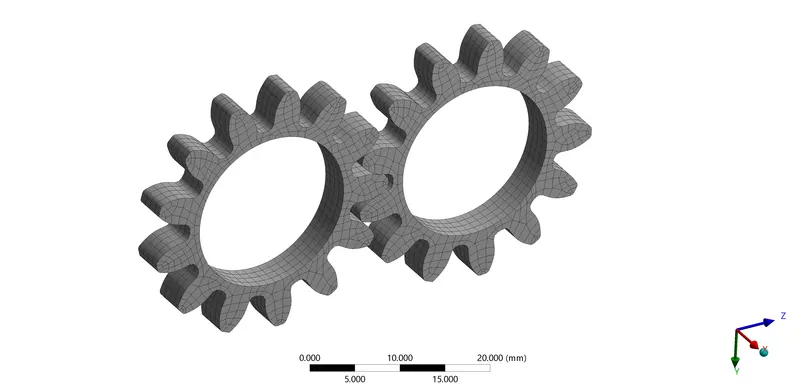
Once the connections are given we can mesh the part. The Element type is Hexa and the Element size is 1mm. The number of elements formed is 2808 and the number of nodes is 16586.
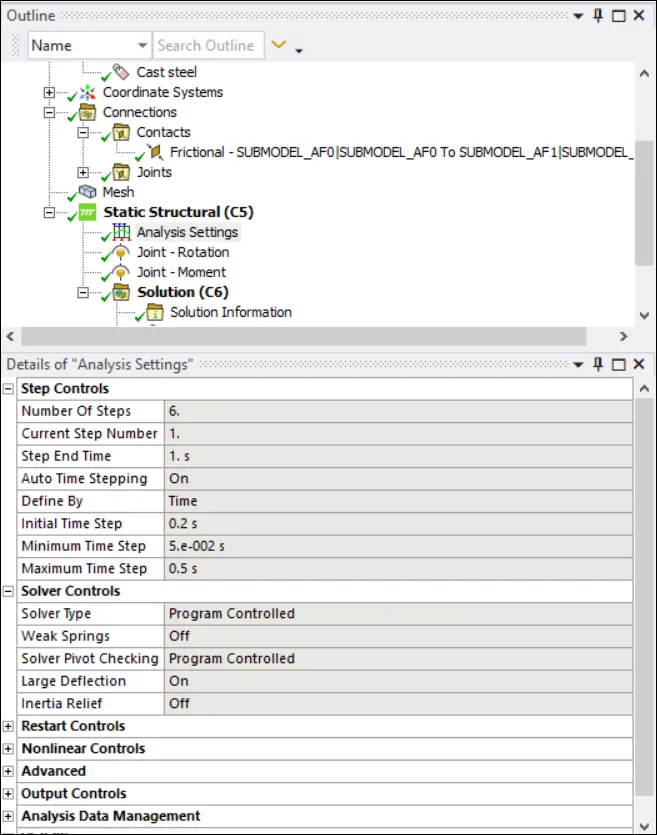
The Analysis is run using the given analysis settings. The number of steps is 6 as for each second the gear will rotate 30'. We must select Auto time-stepping as ON. The initial Time Step is 0.2 seconds, the Minimum time step is 0.05 seconds and the Maximum time step is 0.5 seconds.
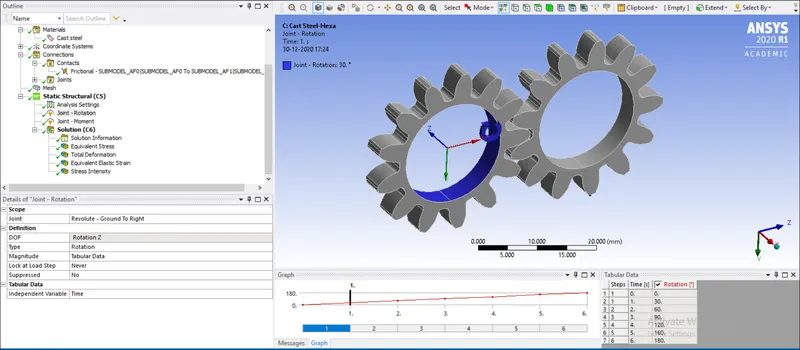
In this step, the rotation is given to one of the spur gear. For each second the gear will rotate 30'. At the end of 6 seconds, it would have rotated 180 degrees.
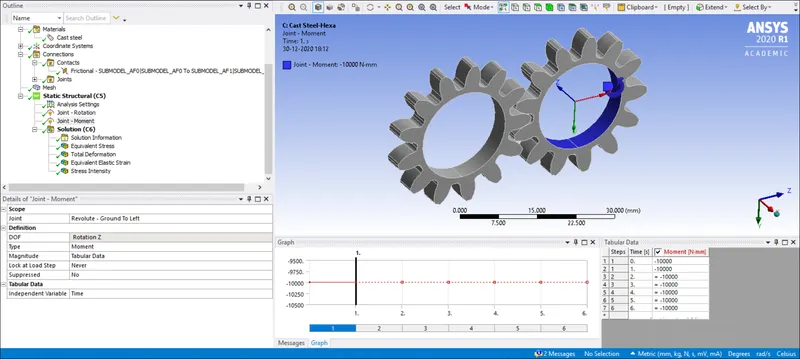
The second gear will be providing the moment as you can see in the above image. Both the gears must rotate in the opposite direction. Once all the above inputs have been given we must Solve the problem.
Results:
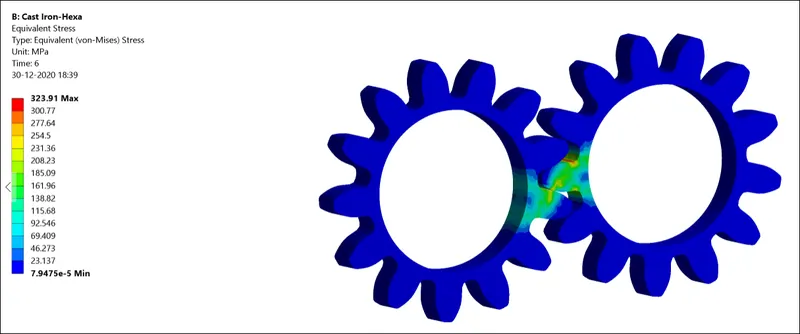
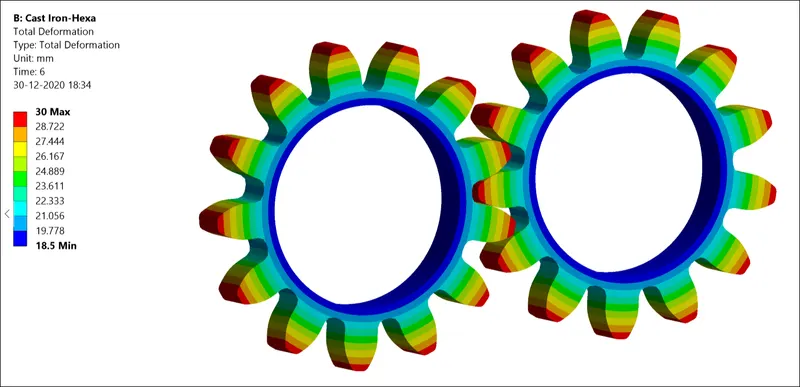
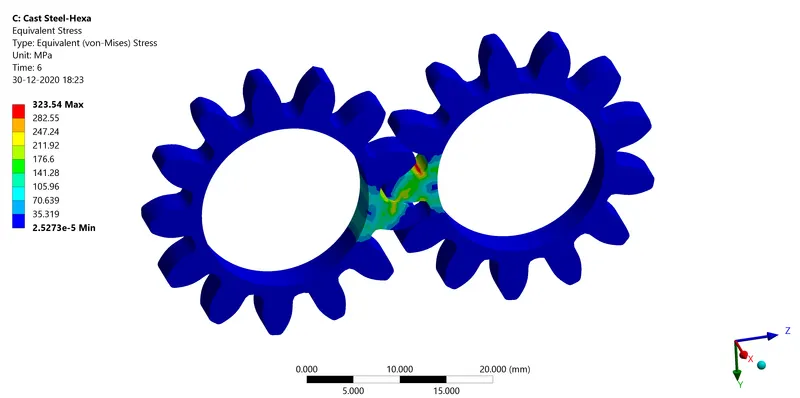
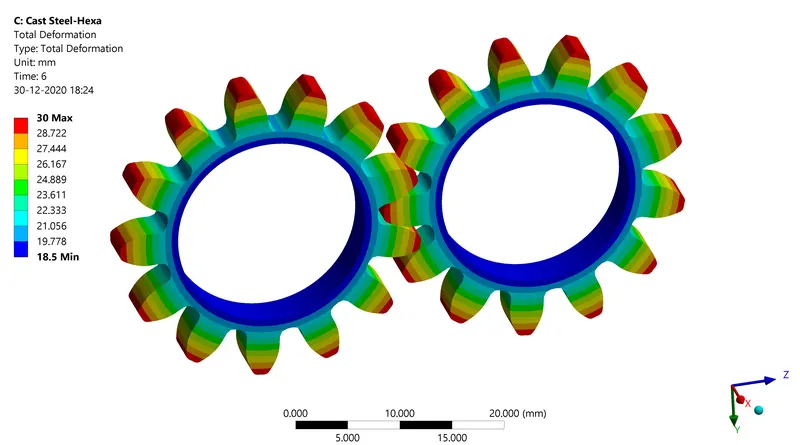
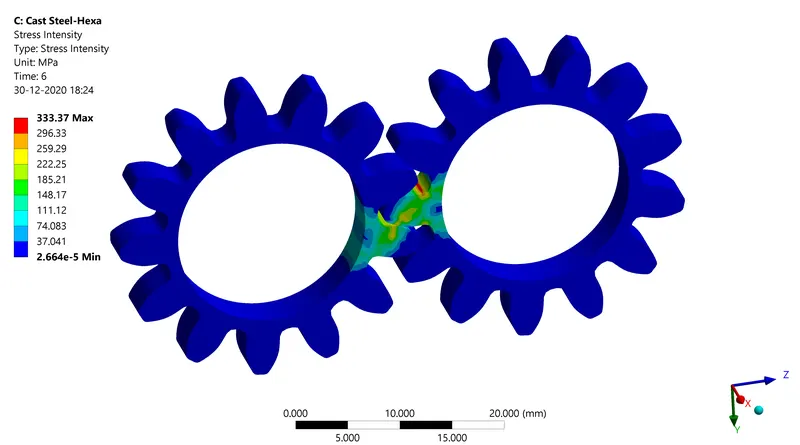
All the results are shown for the 6th second of the Simulation.
Cast Iron Ductile:
Equivalent(von-mises)Stress:
Total Deformation:
Stress Intensity:
Stress Graph:
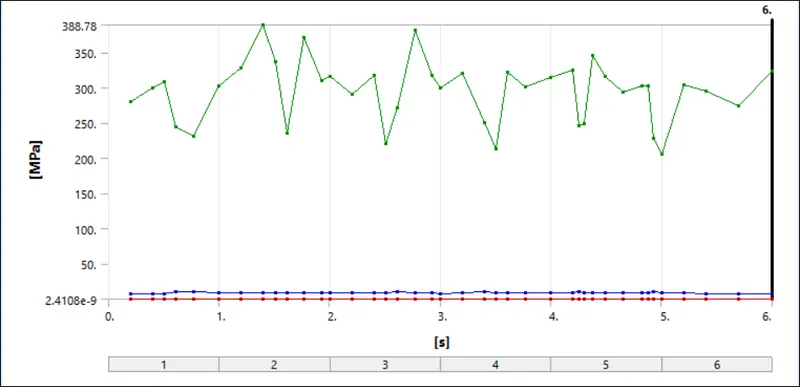
Stress Values along with the Time Step:
| Time | Minimum(Mpa) | Maximum(Mpa) | Average(Mpa) |
| 0.2 | 1.11E-08 | 280.32 | 8.01 |
| 0.4 | 1.30E-07 | 299.04 | 8.1697 |
| 0.505 | 1.15E-07 | 307.94 | 8.1674 |
| 0.61 | 1.50E-06 | 244.96 | 9.7296 |
| 0.7675 | 7.85E-07 | 230.76 | 10.247 |
| 1 | 2.82E-07 | 302.17 | 8.6056 |
| 1.2 | 8.48E-09 | 328.11 | 8.284 |
| 1.4 | 1.74E-06 | 388.78 | 8.6366 |
| 1.505 | 1.77E-06 | 336.08 | 9.0471 |
| 1.61 | 1.15E-05 | 234.8 | 9.2632 |
| 1.7675 | 1.23E-07 | 370.37 | 8.8215 |
| 1.925 | 1.23E-08 | 309.47 | 8.5919 |
| 2 | 1.03E-08 | 316.5 | 8.9061 |
| 2.2 | 6.61E-07 | 290.97 | 8.3666 |
| 2.4 | 8.24E-08 | 317.68 | 8.7936 |
| 2.505 | 2.41E-09 | 220.18 | 8.8885 |
| 2.61 | 2.23E-05 | 271.39 | 9.875 |
| 2.7675 | 3.59E-08 | 381.89 | 8.4255 |
| 2.925 | 2.56E-07 | 316.54 | 8.6683 |
| 3 | 1.16E-08 | 300.02 | 8.091 |
| 3.2 | 2.06E-07 | 319.6 | 8.4022 |
| 3.4 | 9.13E-06 | 250.46 | 9.8768 |
| 3.505 | 4.89E-07 | 213.62 | 9.3521 |
| 3.61 | 3.17E-07 | 321.89 | 8.6878 |
| 3.7675 | 9.86E-09 | 300.37 | 8.5068 |
| 4 | 8.96E-06 | 314.52 | 8.8902 |
| 4.2 | 9.02E-08 | 324.78 | 8.9864 |
| 4.25 | 8.27E-06 | 245.18 | 9.933 |
| 4.3 | 3.36E-06 | 249.1 | 9.3044 |
| 4.375 | 1.93E-07 | 345.25 | 9.1958 |
| 4.4875 | 7.46E-06 | 315.68 | 8.1979 |
| 4.6563 | 1.84E-07 | 293.75 | 8.291 |
| 4.825 | 1.94E-07 | 303.09 | 8.6223 |
| 4.875 | 1.90E-07 | 303.08 | 8.9526 |
| 4.925 | 6.23E-07 | 228.24 | 10.303 |
| 5 | 1.03E-07 | 205.69 | 8.9907 |
| 5.2 | 3.21E-06 | 304.01 | 8.3535 |
| 5.4 | 1.63E-06 | 294.73 | 8.0282 |
| 5.7 | 1.09E-07 | 274.35 | 7.8449 |
| 6 | 7.95E-05 | 323.91 | 7.9835 |
The maximum stress formed in the above simulation is 388.78Mpa which is above the Yield Strenght so this component is failing.
Cast Bronze:
Equivalent(von-mises)Stress:
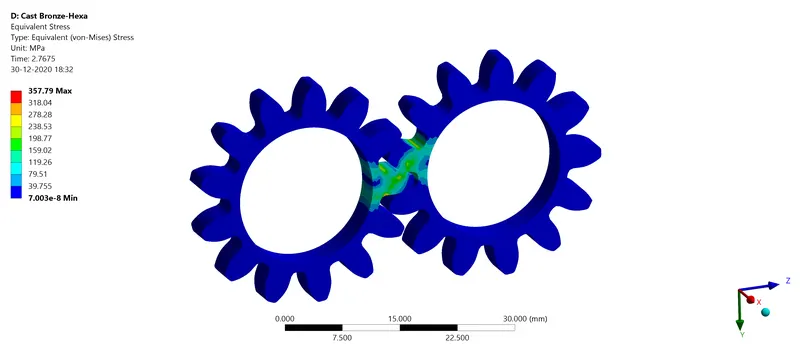
Total Deformation:
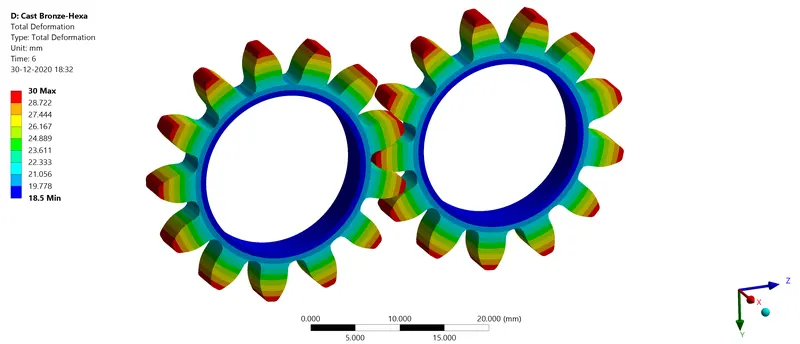
Stress Intensity:
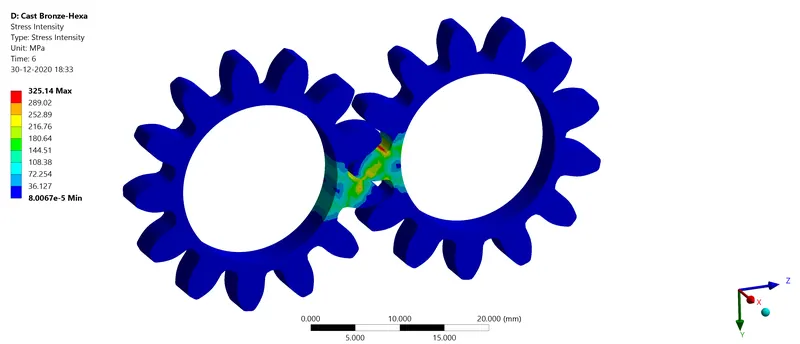
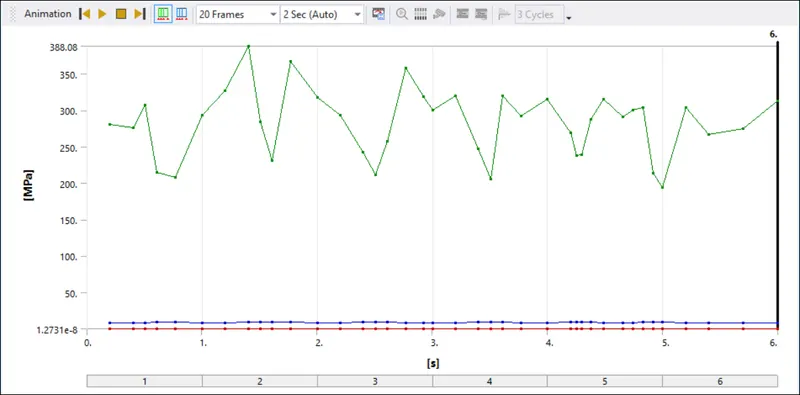
Stress Graph
Stress Values along with the Time Step:
| Time | Minimum(Mpa) | Maximum(Mpa) | Average(Mpa) |
| 0.2 | 2.07E-08 | 281.09 | 8.0468 |
| 0.4 | 2.07E-08 | 275.85 | 8.0966 |
| 0.505 | 4.04E-07 | 307.19 | 8.2466 |
| 0.61 | 2.59E-06 | 214.47 | 8.9 |
| 0.7675 | 3.01E-06 | 208 | 9.1824 |
| 1 | 1.18E-07 | 293.35 | 8.3374 |
| 1.2 | 7.58E-08 | 327.26 | 8.3007 |
| 1.4 | 1.95E-06 | 388.08 | 8.6966 |
| 1.505 | 2.67E-05 | 284.64 | 9.1034 |
| 1.61 | 1.51E-06 | 230.71 | 9.2896 |
| 1.7675 | 5.97E-07 | 367.37 | 8.7779 |
| 2 | 3.50E-08 | 317.26 | 8.4071 |
| 2.2 | 4.84E-07 | 293.77 | 8.4093 |
| 2.4 | 4.20E-07 | 242.52 | 8.7953 |
| 2.505 | 5.53E-07 | 211.52 | 8.9222 |
| 2.61 | 1.90E-06 | 257.72 | 9.059 |
| 2.7675 | 7.00E-08 | 357.79 | 8.2404 |
| 2.925 | 2.42E-08 | 318.61 | 8.2056 |
| 3 | 2.38E-08 | 299.77 | 8.1154 |
| 3.2 | 1.73E-07 | 319.55 | 8.4375 |
| 3.4 | 5.82E-06 | 246.61 | 9.0244 |
| 3.505 | 2.08E-08 | 206.03 | 8.9888 |
| 3.61 | 8.02E-07 | 320.37 | 8.7203 |
| 3.7675 | 1.70E-08 | 291.89 | 8.2676 |
| 4 | 1.27E-08 | 315.43 | 8.3669 |
| 4.2 | 9.33E-08 | 268.63 | 9.0803 |
| 4.25 | 1.72E-07 | 237.47 | 9.3295 |
| 4.3 | 8.78E-07 | 239.44 | 9.3369 |
| 4.375 | 9.18E-07 | 287.79 | 9.2184 |
| 4.4875 | 3.41E-07 | 315.18 | 8.2374 |
| 4.6563 | 2.44E-06 | 291.16 | 8.2926 |
| 4.7448 | 3.79E-07 | 300.14 | 8.5332 |
| 4.8334 | 3.68E-07 | 303.45 | 8.7287 |
| 4.9167 | 4.48E-06 | 213.26 | 9.0055 |
| 5 | 2.60E-07 | 193.6 | 9.0534 |
| 5.2 | 2.20E-07 | 303.28 | 8.2519 |
| 5.4 | 2.13E-07 | 266.86 | 7.8518 |
| 5.7 | 2.08E-07 | 274.93 | 7.8769 |
| 6 | 6.94E-05 | 313.15 | 8.0109 |
The maximum stress formed in the above simulation is 388.08Mpa which is above the Yield Strenght so this component is failing.
Cast Steel:
Equivalent(Von-Mises)Stress:
Total Deformation:
Stress Intensity:
Stress Graph
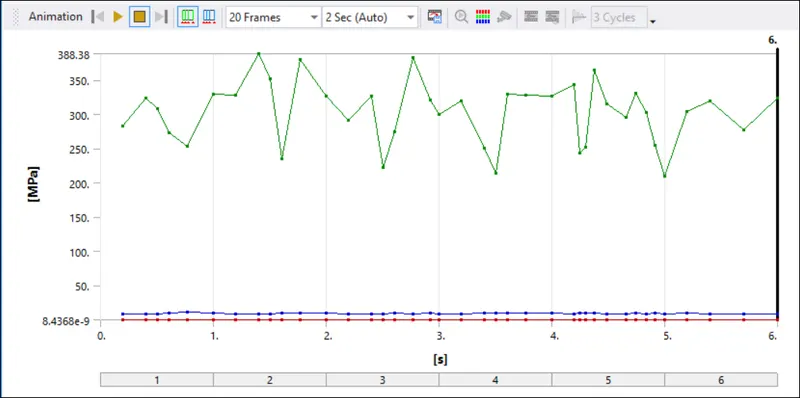
Stress Values along with the Time Step:
| Time | Minimum(Mpa) | Maximum(Mpa) | Average(Mpa) |
| 0.2 | 1.57E-08 | 282.58 | 8.0393 |
| 0.4 | 1.23E-07 | 324.23 | 8.8607 |
| 0.505 | 1.65E-06 | 307.6 | 8.2665 |
| 0.61 | 3.21E-06 | 272.35 | 10.157 |
| 0.7675 | 1.37E-06 | 253.6 | 10.775 |
| 1 | 1.39E-08 | 329.5 | 9.3137 |
| 1.2 | 1.13E-08 | 327.97 | 8.3027 |
| 1.4 | 3.31E-06 | 388.38 | 8.6515 |
| 1.505 | 4.84E-08 | 351.84 | 9.1288 |
| 1.61 | 2.51E-07 | 235.51 | 9.2718 |
| 1.7675 | 4.41E-07 | 379.3 | 9.6256 |
| 2 | 1.04E-05 | 326.84 | 9.6352 |
| 2.2 | 4.68E-07 | 291.16 | 8.3799 |
| 2.4 | 1.60E-07 | 326.73 | 8.9037 |
| 2.505 | 4.41E-07 | 222.81 | 8.9959 |
| 2.61 | 1.93E-05 | 274.44 | 10.289 |
| 2.7675 | 1.08E-07 | 382.89 | 8.4554 |
| 2.925 | 3.07E-07 | 321.31 | 9.3287 |
| 3 | 1.38E-08 | 299.89 | 8.1052 |
| 3.2 | 1.58E-07 | 319.48 | 8.4099 |
| 3.4 | 1.63E-05 | 250.13 | 10.27 |
| 3.505 | 6.19E-07 | 214.35 | 9.5563 |
| 3.61 | 1.05E-05 | 329.68 | 9.411 |
| 3.7675 | 8.44E-09 | 328.17 | 9.201 |
| 4 | 1.04E-06 | 326.06 | 9.6075 |
| 4.2 | 9.08E-08 | 343.75 | 8.98 |
| 4.25 | 1.33E-05 | 243.5 | 10.236 |
| 4.3 | 4.19E-06 | 251.81 | 9.3106 |
| 4.375 | 2.23E-07 | 365.08 | 9.2198 |
| 4.4875 | 2.21E-07 | 315.49 | 8.2122 |
| 4.6563 | 2.35E-07 | 295.15 | 8.3178 |
| 4.7448 | 2.68E-07 | 331.36 | 9.3469 |
| 4.8334 | 3.40E-07 | 303.13 | 8.6857 |
| 4.9167 | 7.41E-06 | 254.85 | 10.346 |
| 5 | 3.47E-07 | 209.91 | 8.9932 |
| 5.2 | 2.38E-05 | 303.83 | 9.1557 |
| 5.4 | 2.89E-06 | 319.62 | 8.7411 |
| 5.7 | 1.38E-07 | 276.84 | 7.8764 |
| 6 | 2.53E-05 | 323.54 | 8.007 |
The maximum stress formed in the above simulation is 388.38Mpa is above the Yield Strenght so this component is failing.
Location of Possible Fracture:
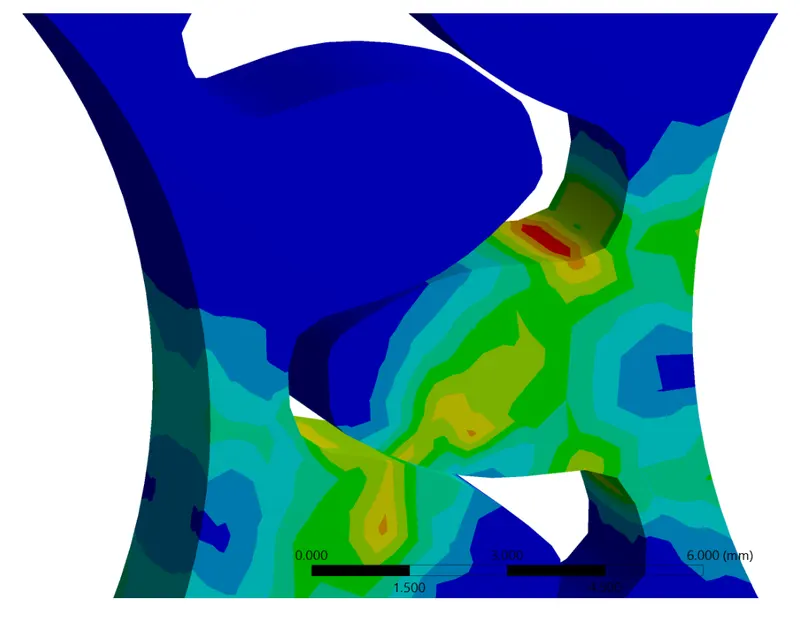
From the above image, you can see the red area which shows the maximum concentration of Stress in this region of the part will enter Plastic deformation because the Maximum Stress formed is more than the yield for all three materials. If we increase the load for the given part the fracture will occur first in the above red region.
Comparing the results from all the three cases:
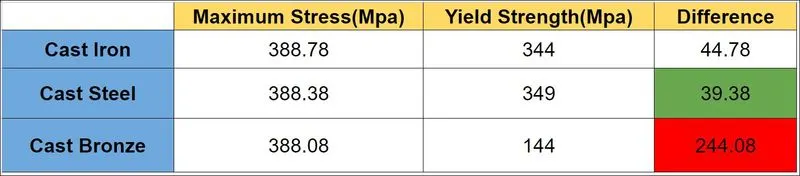
In FEA the Maximum stress formed is compared with the yield strength and only if the Maximum Stress formed is less than the Yield we consider the part to be safe. All the three above materials fail if we compare them with their respective Yield Strength. So here we can select the best among the three based on which has the least Difference(Maximum Stress-Yield). That is which material is failing the least.
So from the above table, you can see that the Maximum stress formed is very similar for all three materials. We can see that the least Maximum stress is for Bronze and the Highest is for Cast Iron. But since the yield of the bronze is very less compared to Cast Iron and the difference between the Maximum Stress and Yield for bronze is very High so Cast Bronze is not prefered even if it has the least stress formation.
From the above three materials, the safest choice will be Cast Steel as it has the least difference followed by Cast Iron. In real-life scenarios, all three materials won't be prefered as they all fail.
Conclusion:
For all the three cases the simulation was run and from comparing the results we can conclude by stating that even though Bronze has the least Maximum Stress due to its low yield we will be choosing Cast Steel followed by Cast Iron. Cast Steel is failing the least.