State Flow Logic for Gear Shift Using Simulink Software
AIM-2
Make a Simulink chart for the “Gear shift” logic as per below conditions:
Speed Range(kmph) Gear
0 to 15 1
16 to 25 2
26 to 40 3
41 to 60 4
Above 61 5
Give speed input while the simulation is running & display the gear number.
REQUIREMENTS
MATLAB & SIMULINK softwares
Simulink - is a graphical user interface for modeling and simulation of block schematics. The core of the Matlab is used to compute the simulating results. Simulink is primarily used for modeling dynamic systems. Simulink’s libraries offer a plenty of blocks useful for modeling complex systems. With help of integrating methods, we can simulate the system and analyze it in time.
Simscape – is a library of basic real world mechanics, hydraulics and electronics components. System, built from these blocks, is modeled from view of energy flow. Model works directly with physical parameters, so it approximates good real systems. Simscape generates differential equations from the modeled system that can communicate with other components from Matlab/Simulink after the simulation has been started.
PROCEDURE
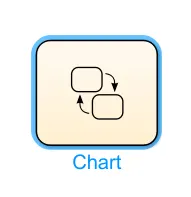
- The first step is to create a stateflow chart in the simulink environment. It is done by double clicking on the simulink environment and searching for 'chart' or draging it from the simulink library.
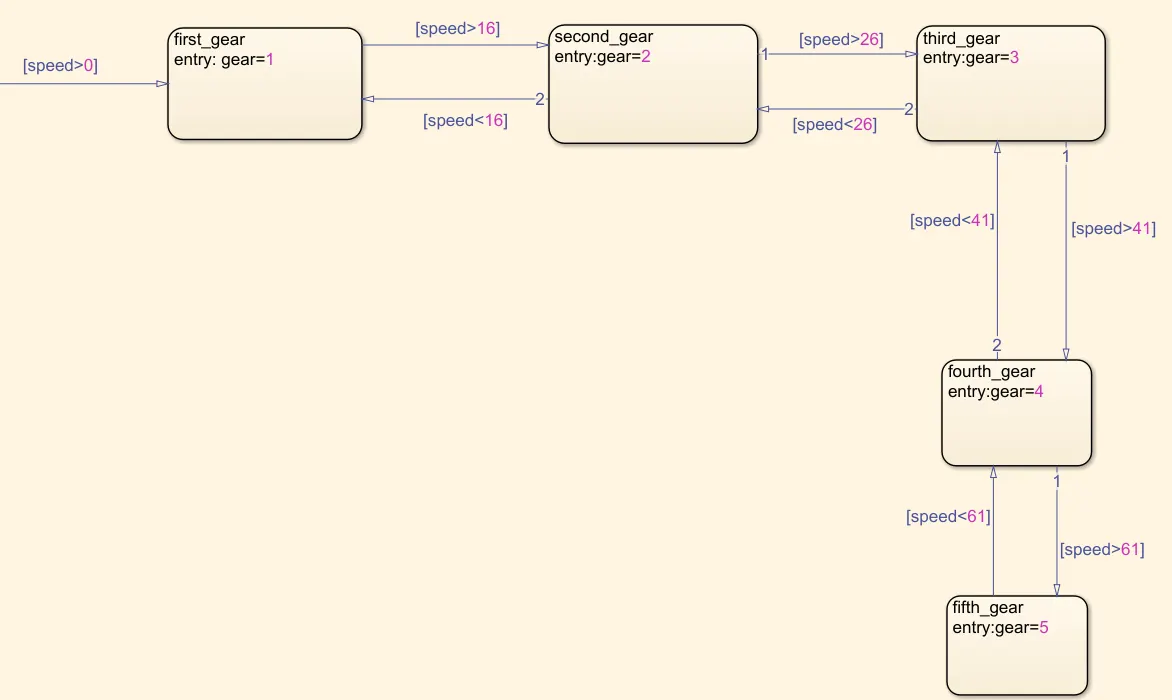
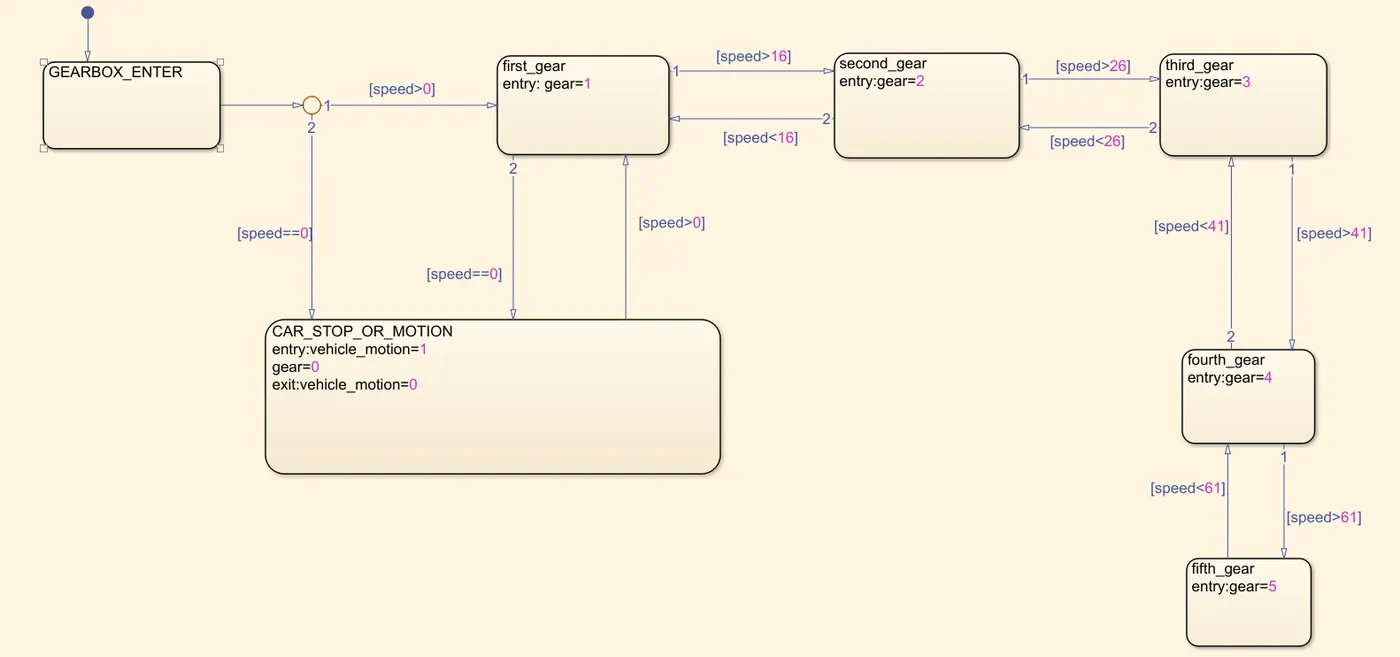
- Then we will create the 5 states for the five gear shifts with output arguements as the gear number for the respective states. Also the conditions for the transition from one gear state to the other is provided as shown in the figure.
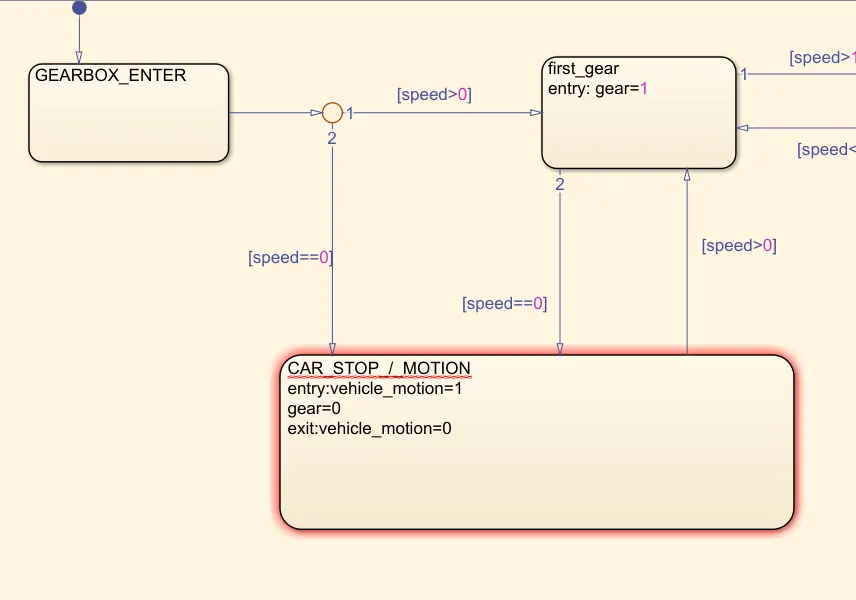
- After that we will define a default state 'GEARBOX_ENTER' which is inturn connected to a junction. From this junction, we are giving another state called 'CAR_STOP_OR_MOTION' for knowing whether the car is in motion or not. If it is in motion gear shift has to make, which has to connected to the first_gear. Else, it has to display 0 in the display block.
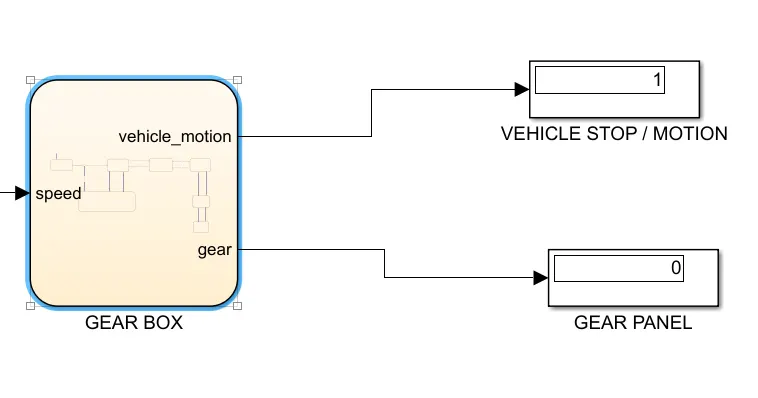
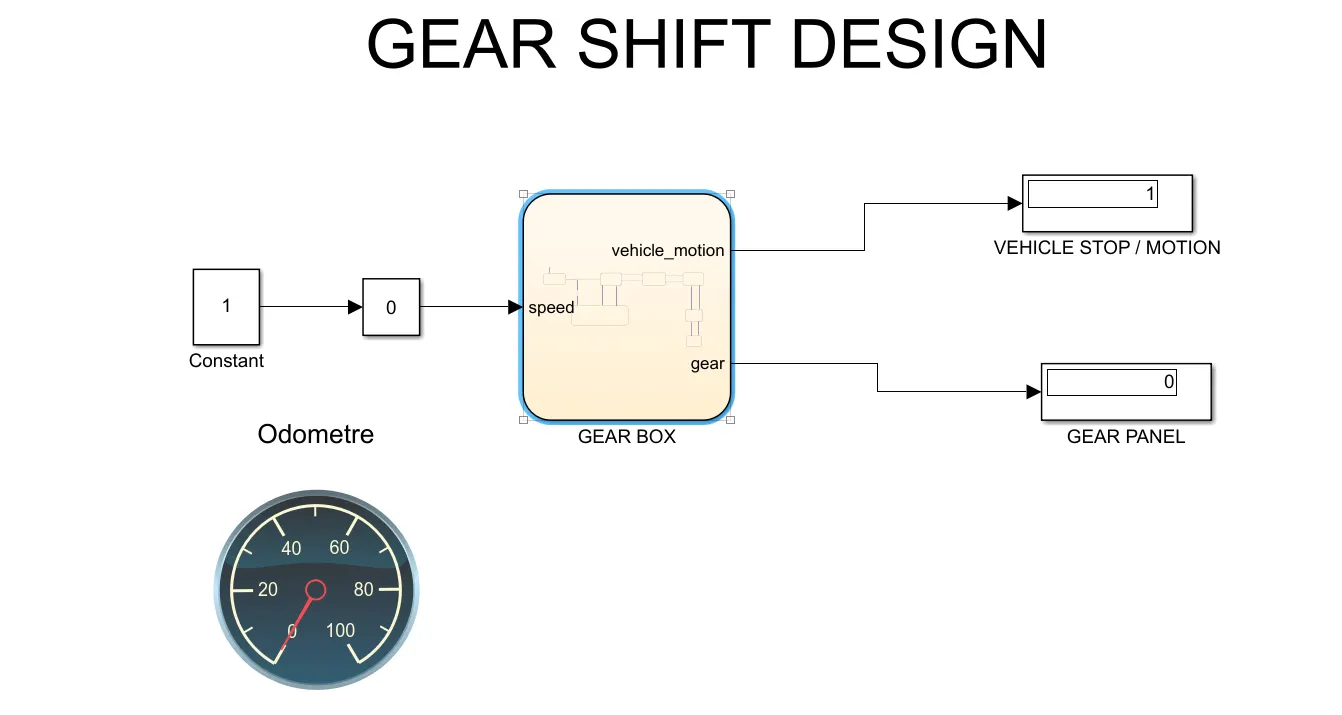
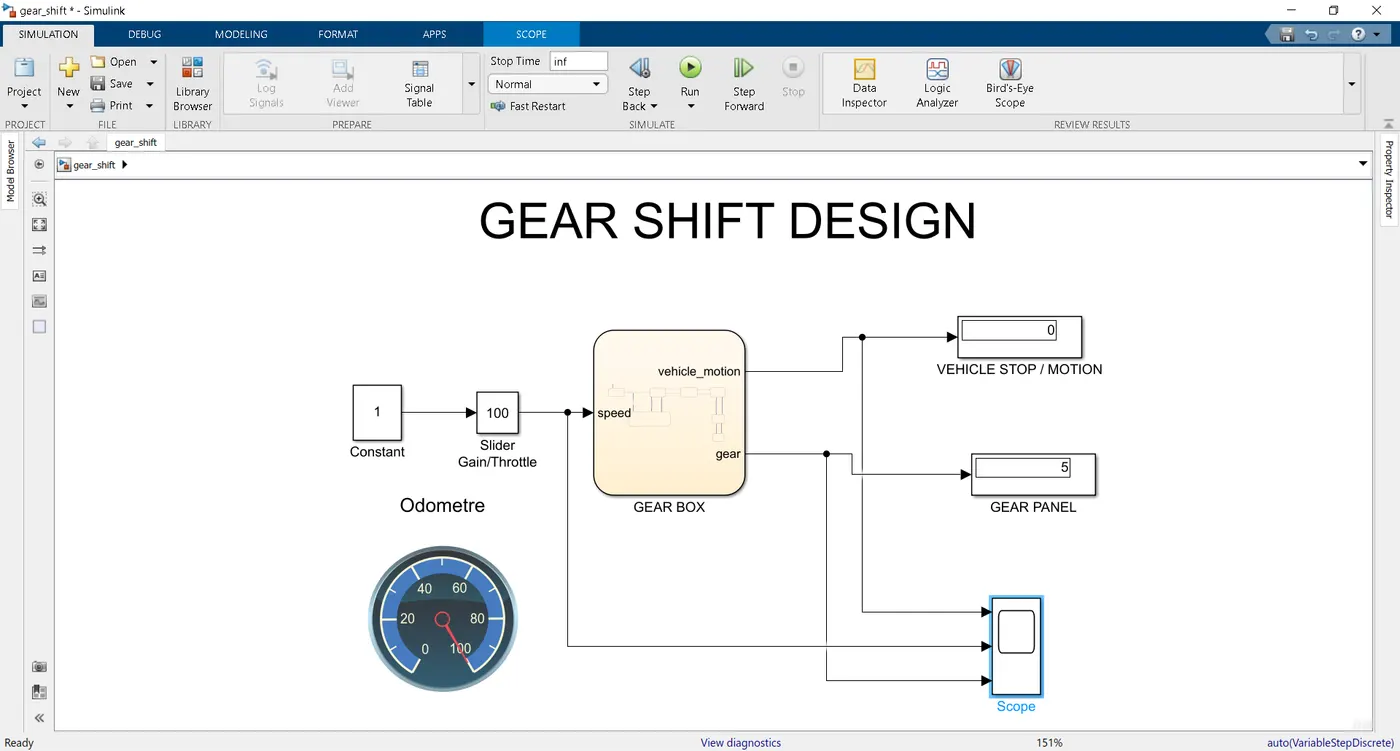
- Now we will define the input and output to the chart. The input has to be made convenient in such a way that the user can provide the input during the simulation. So i made use of a slider gain block alon with a constant block. For clarity of understanding, we will connect a custom gauge block as the odometre to the slider gain.
- The output is conected to 2 display blocks- vehicle stop/motion and gear panel. The former is for displaying whether the gearbox is engaged or not and the later is for knowing which gear is in engagement.
COMPLETED DESIGN
- STATEFLOW CHART FOR GEAR SHIFT
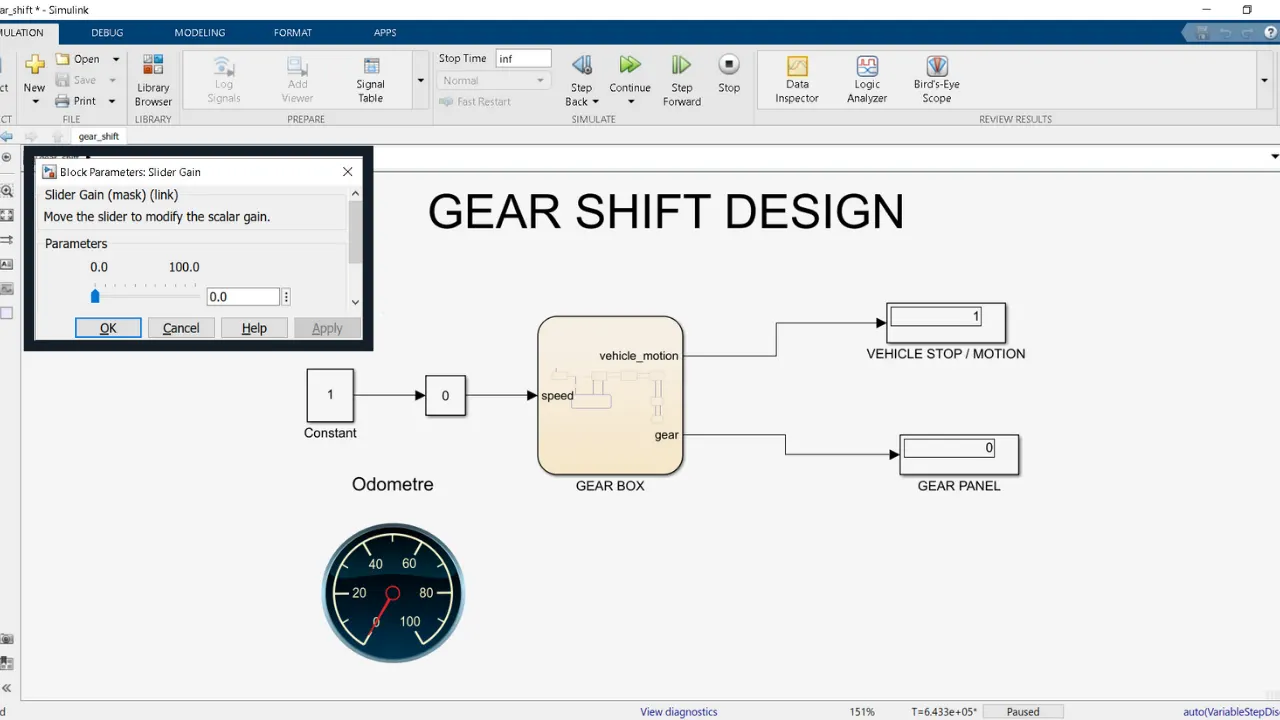
OUTPUT
NOTE:- Here the stop time is given as inf (i.e.infinity). Because the user can provide whichever speed value as many times as he wants during the simulation time, so the simulation can be long enough.
1.WHEN THE SPEED IS 0 (i.e. vehicle stop condition) AND NO GEAR SHIFT IS MADE
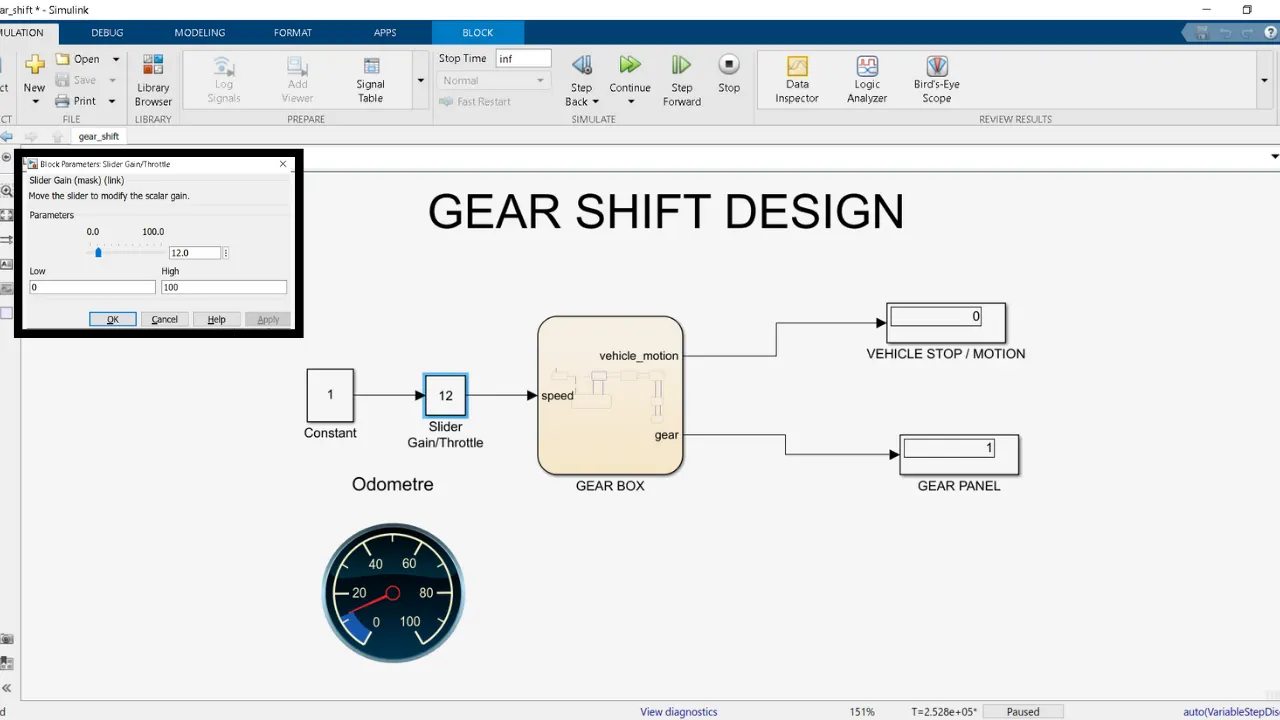
2. WHEN THE SPEED IS 12Kmph, GEAR SHIFT IS MADE TO 1 AND THE VEHCLE IS IN MOTION
3.WHEN THE SPEED IS 23Kmph, GEAR SHIFT IS MADE TO 2 AND THE VEHCLE IS IN MOTION
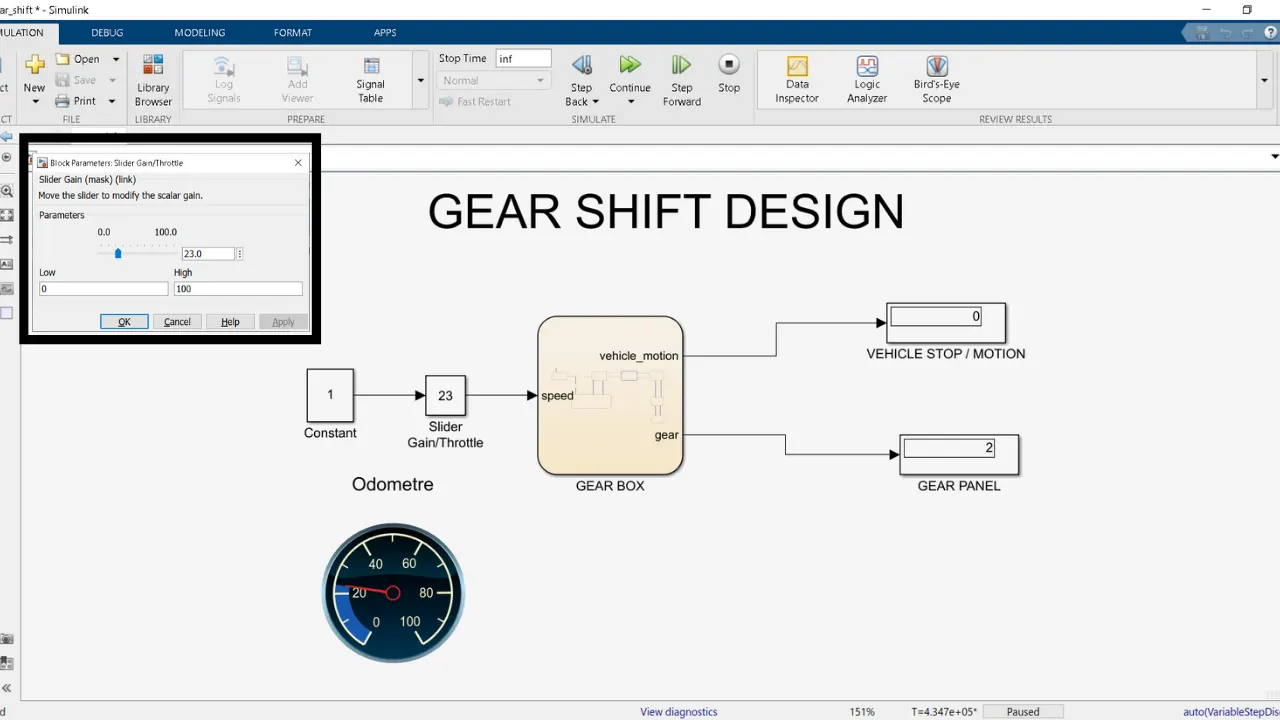
3. WHEN THE SPEED IS 33Kmph, GEAR SHIFT IS MADE TO 3 AND THE VEHCLE IS IN MOTION
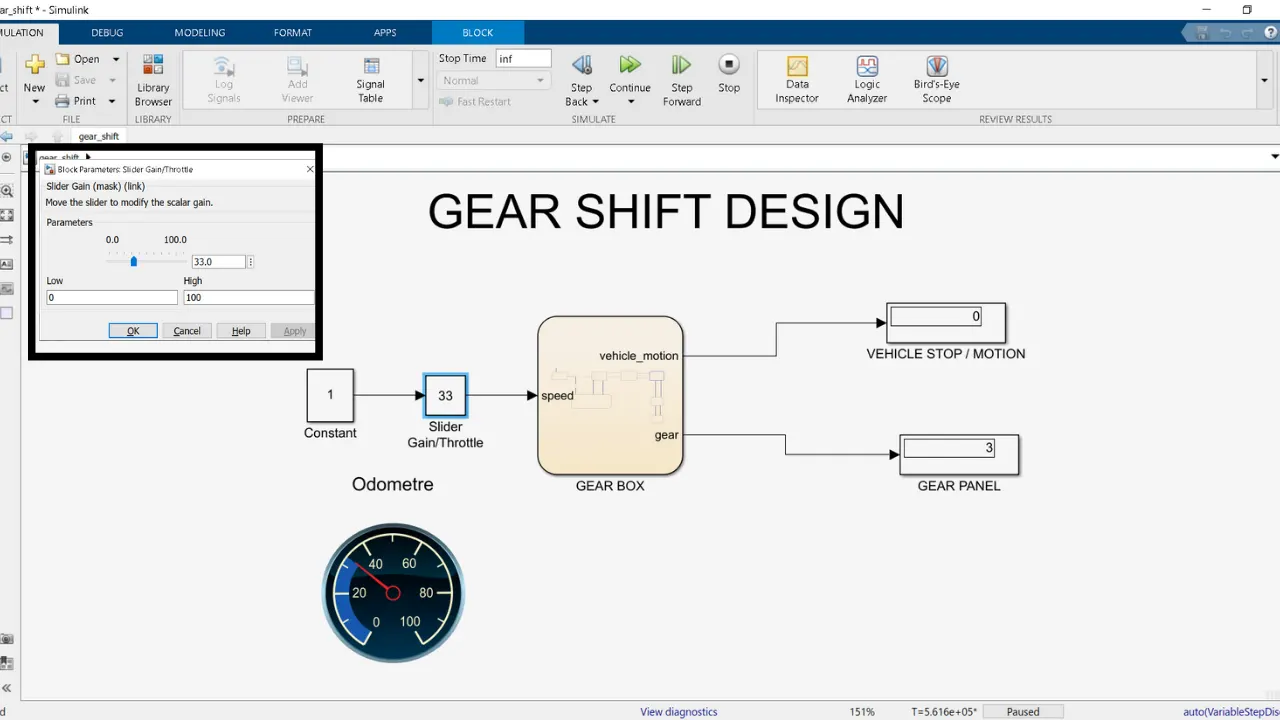
4.WHEN THE SPEED IS 43Kmph, GEAR SHIFT IS MADE TO 4 AND THE VEHCLE IS IN MOTION
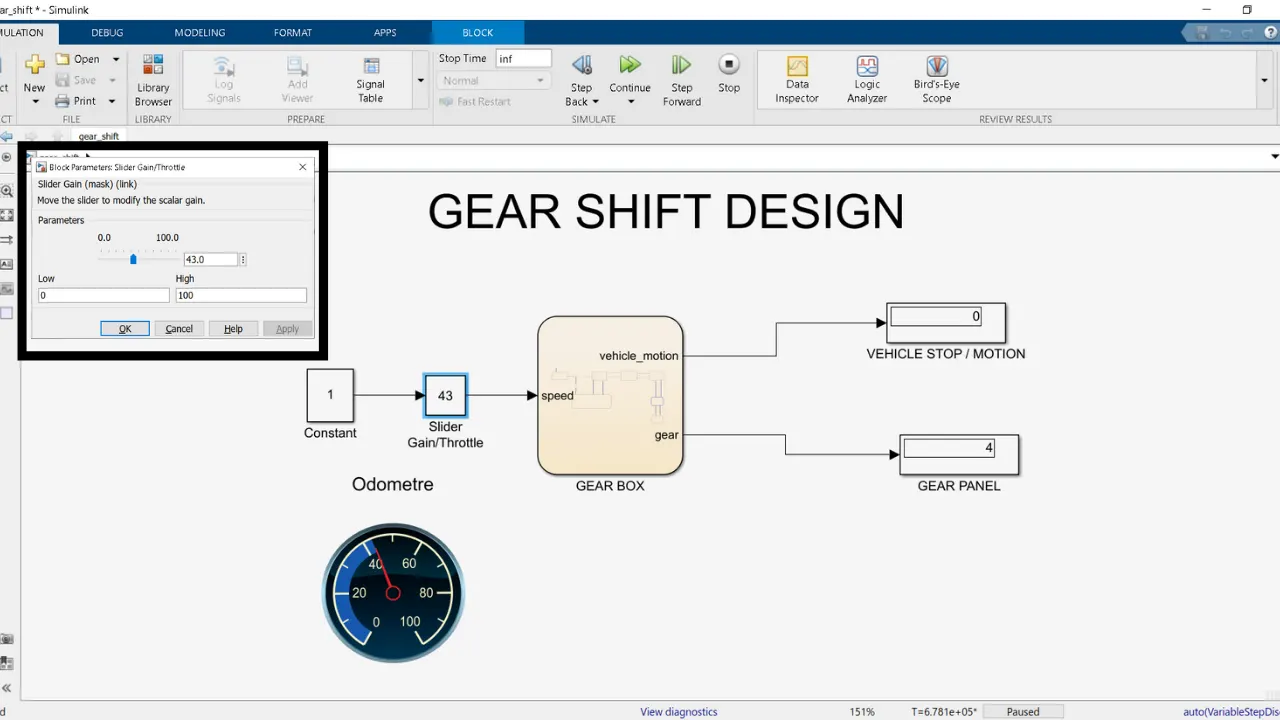
5.WHEN THE SPEED IS 72Kmph, GEAR SHIFT IS MADE TO 5 AND THE VEHCLE IS IN MOTION
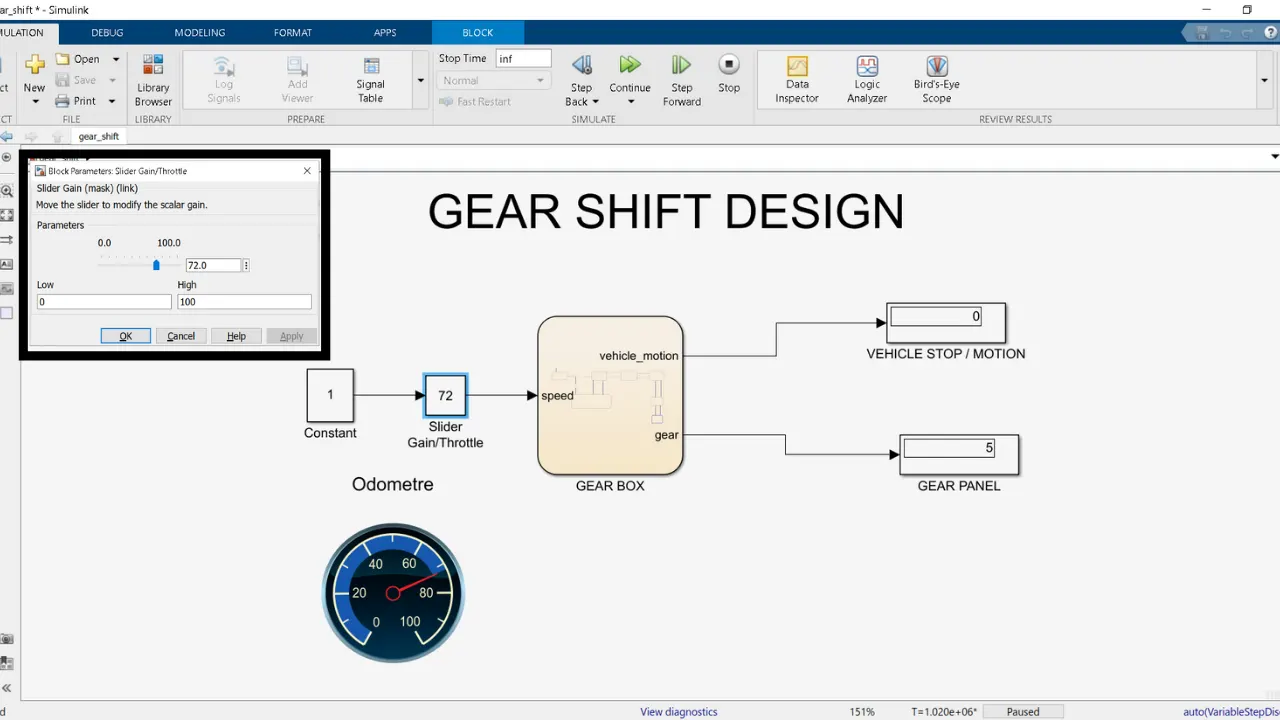
6. FOR MORE CLARITY, I HAVE ADDED THE SCOPE TO INPUT AND OUTPUT PORT AND MANUALLY INCREASED THE THROTTLE FROM O TO 100Kmph. THE RESULTS ARE AS SHOWN BELOW:-
OUTPUT:- You can see the graph is increasing as per the throttle input. The gear shift is made from 0 to 5. The vehicle stop is symbolised using o and vehicle in motion by 1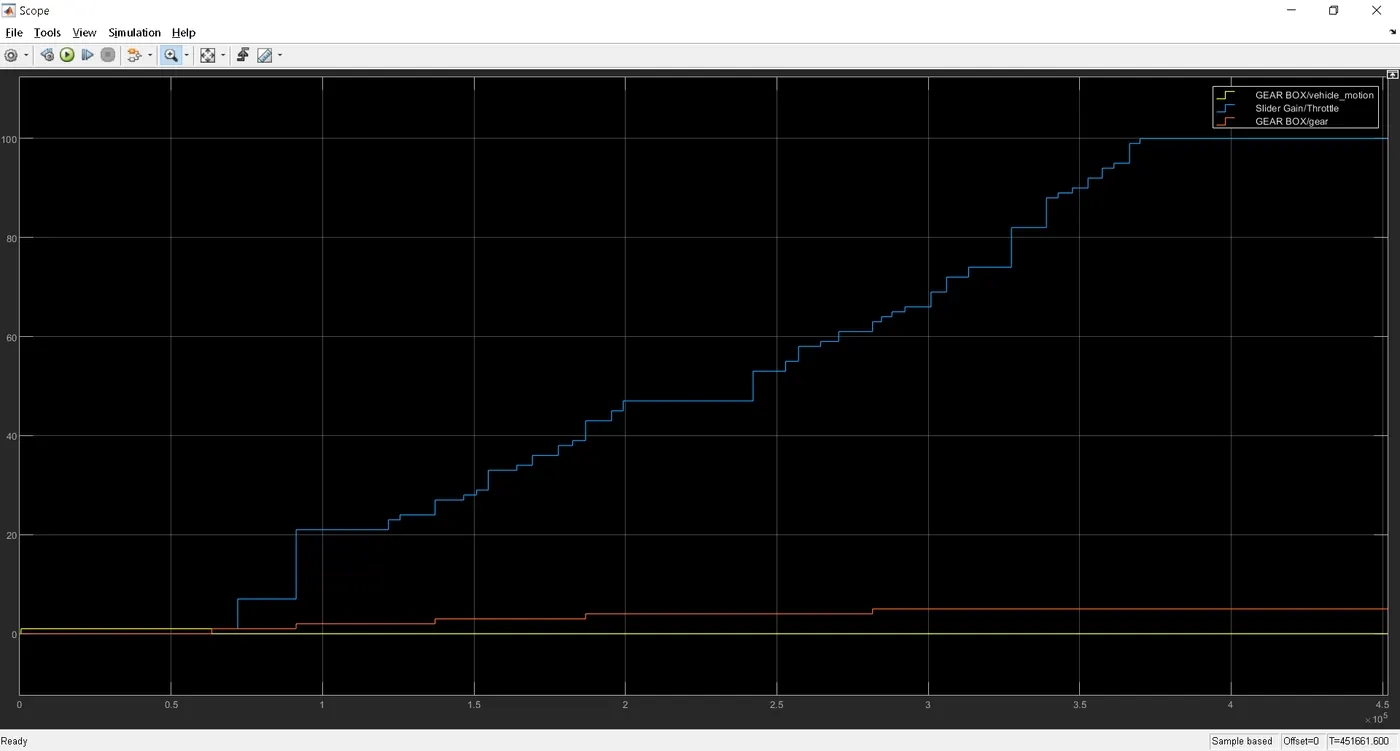
RESULT
The simulink design using stateflow chart for the gear shift is successfully made.