Solve second order ODE using MATLAB
Aim: To solve second order ODE with the help of MATLAB.
Objective:
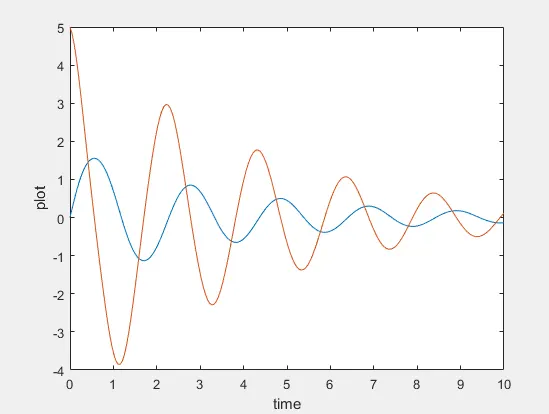
- Plot a graph for displacement, velocity w.r.t. time.
- Create an animation to show the movement of the pendulum.
Theory:
Ordinary Differential Equation(ODE):
An Ordinary Differential Equation(ODE) is a differential equation containing one or more functions one independent variable and derivation of those functions.
Pendulum:
A pendulum is a weight suspended from a pivot so that it can be swing freely. When a pendulum is displaced sideways from its resting, equilibrium position, it is subject to a restoring force due to gravity that will accelerate it back towards the equilibrium position.
Given Equation:
The given equation is..
(d2θ/dt2)+(b/m*dθ/dt)+(g/l*sin(θ)) = 0
Where,
b = damping coefficient,
m = mass of the bob in kg,
g = force due to gravity in m/s2’
l = length of the pendulum in m,
θ= angle made by the string with fixed point.
To solve the above equation we have to simplify the equation, that makes some assumptions given below,
θ=θ1
dθ1/dt=θ2
d2θ/dt2 = d2θ1/dt2 = (d/dt*dθ1/dt) = dθ2/dt
Therefore
(dθ2/dt)+(b/m*θ2)+(g/l*sin(θ1)) = 0
(dθ2/dt) = -(b/m*θ2)-(g/l*sin(θ1))
CODE:
Main Code:
clear all
close all
clc

% input
b = 0.05;   %  damping coefficent
g = 9.81;   %  gravitational force in m/s^2 or N/kg
l = 1;      %  length of pendulum in m
m = 0.1;    %  mass pf the pendulum in kg

% initial condition
theta_0 = [0;5];

% time point
t_span = linspace(0,10,100);

% solution of ODE
[t,results] = ode45(@(t,theta) ode_func(t,theta,b,g,l,m),t_span,theta_0);

% plot for velocity and displacement of pedulum w.r.t. time
plot(t,results(:,1))
hold on
plot(t,results(:,2))
hold off
xlabel('time')
ylabel('plot')

% animation for movement of the pendulum
Theta = results(:,1);
ct = 1;
for i = 1:length(Theta)
    THETA = Theta(i);

    % co-ordinates
    x0 = 0;
    y0 = 0;

    x1 = l*sin(THETA);
    y1 = -l*cos(THETA);

plot([x0 x1],[y0 y1],'linewidth',4,'color','g');

hold on
% animation for movement of the pendulum

plot(x1,y1,'o','markersize',10,'color','r','markerfacecolor','r');
hold off

axis([-1 1.5 -1.5 0]);
pause(0.03);
M(ct) = getframe(gcf);
ct = ct+1;

end

movie(M)
videofile = VideoWriter('pendulum.avi','Uncompressed AVI');
open(videofile)
writeVideo(videofile,M)
close(videofile)
Function CODE:
function[dtheta_dt] = ode_func(t,theta,b,g,l,m)

theta1 = theta(1);
theta2 = theta(2);
dtheta1_dt = theta2;
dtheta2_dt = -(b/m)*theta2-(g/l)*sin(theta1);
dtheta_dt = [dtheta1_dt;dtheta2_dt];
end
Explanation:
It is always better to start a code with some come command to clear, close and cancel all previous data save in the workspace command and editor window. the commands we use are bellow.
clear all
close all
clc
Then give the required input given in the equation. which are as follows,
b= 0.05; damping coefficient
m= 1 kg; the mass of pendulum bob
l= 1 m length of the pendulum
g= 9.81 m/s2; force due to gravity
After that introduce the initial condition of displacement and velocity.
Then create a time span for angular velocity using “linspace” command,
Then call function code to solve the given equation. in the function, code creates a function to say “ode_func” includes some arguments whiv=ch help to solve the equation.
Here we use the command “ode45” which we call function code. This function called an anonymous function. Anonymous functions are very much similar to the regular user-defined functions in MATLAB, but with some distinct individual traits, Anonymous functions are not stored as function files or codes, instead, it is just a data type that makes use of the ‘function handle’ data type. The syntax for creating a function handle is,
Func_handle=@(input_argument) func_definition
Then plot graph to show the displacement, velocity w.r.t. time.
To create an animation to show the movement of the pendulum we use for loop and some commands.
- For loop:
For loop is a set of instructions or commands that repeat itself a specified number of times.
Any loop contains an ‘end’ value statement to symbolized the end of our set of instructions so the program again checks the condition to repeat the process.
Commands:
- plot: to plot a graph.
- getframe(gcf): it used inside the second loop to get the current frame and store it as an image into the array M.
- videowriter:its create an empty video file by the name pendulum in .avi formate.
- writevideo: it inserts the frame stored in the array ‘M’ into a video file
Plot:
Animation:
Conclusion:
in this way, we use MATLAB to create code to solve second order ODE.