PWM Controlled Fan Load using DC motor
Title: PWM Controlled Fan load Using DC Motor
Aim: To model fan type load in MATLAB/Simulink and control it speed using PWM method.
Theory:
Modeling fan type load in Simulink with the help of PWM technique to control the speed of fan. We can vary the speed of fan with the help of PWM. The speed of the fan is varied according to the input voltage using PWM technique.
Pulse Width Modulation Technique (PWM):
It is modulation technique that generates variable width pulse to represent the amplitude of an analog input signal. The length of a time that pulse is in a given state (high/low) is the width of the pulse.
The design of the fan speed control system using Pulse Width Modulation by establishing a connection between an H bridge circuit and a DC motor. In this model, all input ports of the H-Bridge block except the PWM port are connected to ground. As a result, the H-Bridge block behaves as follows:
- When the motor is on, the H-Bridge block connects the motor terminals to the power supply.
- When the motor is off, the H-Bridge block acts as a freewheeling diode to maintain the motor current.
Blocked Used:
Controlled Voltage Source: The Controlled Voltage Source block converts a Simulink input signal into an equivalent voltage source.
Controlled PWM Voltage: The Controlled PWM Voltage block represents a pulse-width modulated (PWM) voltage source.
H-Bridge: The H-Bridge block represents an H-bridge motor driver. The block has the following two Simulation mode options: PWM — The H-Bridge block output is a controlled voltage that depends on the input signal at the PWM port.
DC Motor: This block is used in the DC Motor Position.
Ideal Rotational Motion Sensor: The Ideal Rotational Motion Sensor block represents an ideal mechanical rotational motion sensor.
Current Sensor: Use to Measure the current.
Voltage Sensor: Use to measure the voltage across the DC motor.
Ideal Torque Sensor: The Ideal Torque Sensor block represents a device that converts a variable passing through the sensor into a control signal proportional to the torque.
Pulse Generator: Pulse generator is input for the system in terms of pulse.
Solver Configuration: Solver configuration block use to configure the model.
Scope: Use to get the graphical representation in terms of output.
Simulink Model:
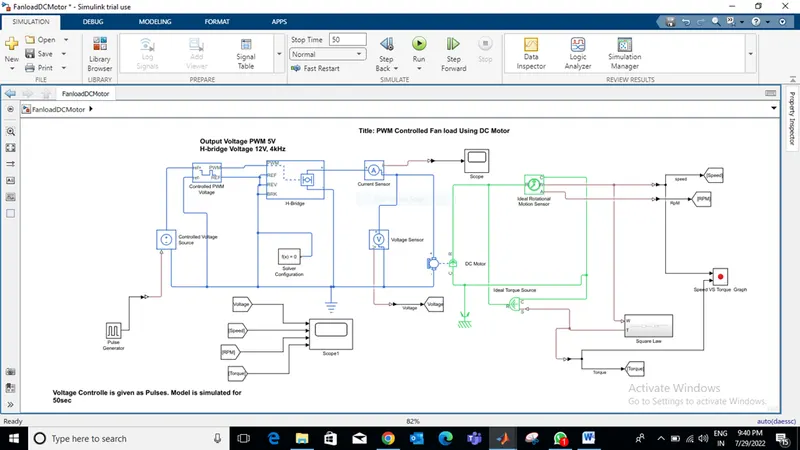
Fig. 1 Simulink Model
Description:
As shown in fig. 1 we use pulse generator to feed the supply to controlled voltage source. Controlled voltage source connected to the input port of controlled PWM voltage. The PWM frequency is 4kHz and its output voltage is 5V. Then PWM port of controlled PWM voltage connected to the H-Bridge PWM port. Output voltage of H-Bridge is 12V. H-Bridge connected to DC Motor through current sensor to measure current. Also voltage sensor connected in parallel with DC Motor to read voltage.
All other input port of H-Bridge are grounded. As a result, the H-Bridge block behaves as follows:
- When the motor is on, the H-Bridge block connects the motor terminals to the power supply.
- When the motor is off, the H-Bridge block acts as a freewheeling diode to maintain the motor current.
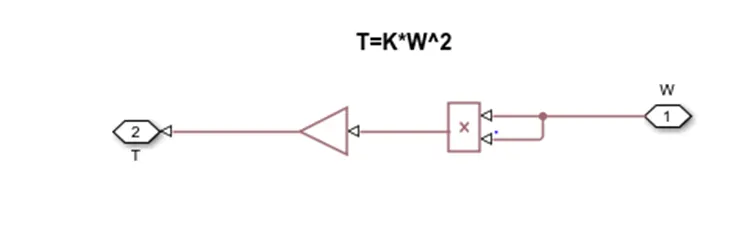
Mechanical part/port are connected to the ideal rotational motion sensor to read the speed and angular velocity. With the help of square law, speed feed to the square law to get torque with is feed to the R terminal of ideal rotational motion sensor through ideal torque sensor.
Torque is directly proportional to the speed of motor, with increasing speed the torque increase. As following..
T=K*W^2
Square law:
Result:
Below attach result screenshot:
Below attach screen shot of scope which showing Voltage, Speed, RPM (Angular Velocity), and Torque.
If we take look on the result we can see that our voltage is for 25sec then it showing zero because we have provided input in terms of pulse, so the pulse parameter are Amplitude is 1, Pulse period is 50, And the pulse width id 50. We are giving pulse for 50% of pulse time which is 50sec, so the its operating for 25sec.
If we check out our speed graph our speed is gradually increase till 85-87 and then it will constant till 25sec and then it decrease to zero because after 25sec our voltage comes to zero. Torque graph as similar to the speed because torque is directly proportional to the speed.
Angular Velocity starts increasing till 2300-2400 and then it constant after 25sec.
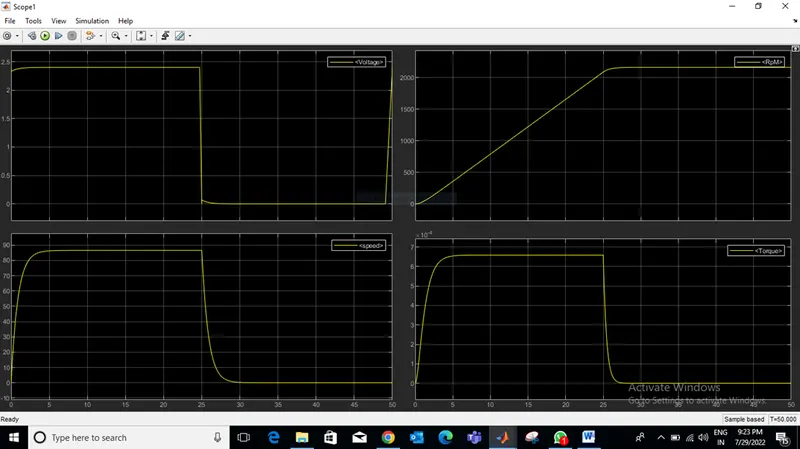
Fig. 2 Graphical Representation of Voltage, Speed, Torque, Angular Velocity
Below attach torque VS speed Characteristics.
Result showing the Torque is directly proportional to the Speed. With increase in speeds the torque increase.
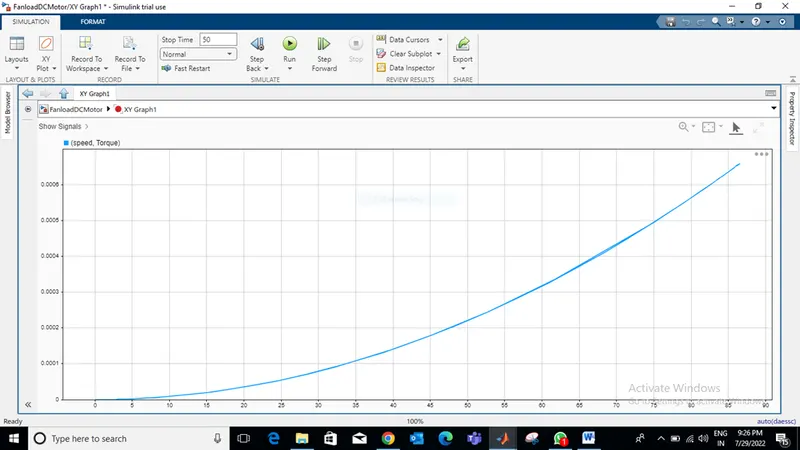
Fig. 3 Torque VS Speed Characteristics
Conclusion:
As above we can see the result or output screenshot (Fig.3). We conclude that the speed is directional proportional to the torque. With increasing speed the torque increase we can see in fig. 3.