Projectile motion Calculator.
Aim :- To write a MATLAB program to create a projectile motion calculator and simulate the trajectory of a object.
Objective :-
- To write a program in MATLAB to calculate the Time of flight, Range (distance), maximum height (h max.) of the object.
- To animate the Projectile motion of the object.
- To analyse the trajectory of a projectile for different velocities.
- To analyse the trajectory of a projectile for different angles.
Theory :-
Projectile motion is the motion of an object thrown or projected into the air, subject to only the acceleration of gravity. The object is called a projectile, and its path is called its trajectory. The primary force acting on a projectile is gravity. This doesn’t necessarily mean that other forces do not act on it, just that their effect is minimal compared to gravity. The path followed by a projectile is known as a trajectory. A baseball batted or thrown is an example of the projectile. When a particle is thrown obliquely near the earth’s surface, it moves along a curved path under constant acceleration that is directed towards the centre of the earth. In projectile motion, the horizontal motion and the vertical motion are independent of each other; that is, neither motion affects the other. Since the gravitational force pulls downward, gravity will only affect the vertical component of the velocity.
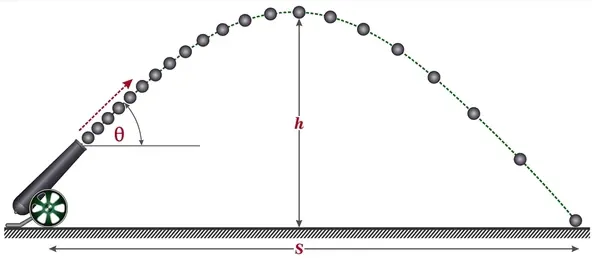
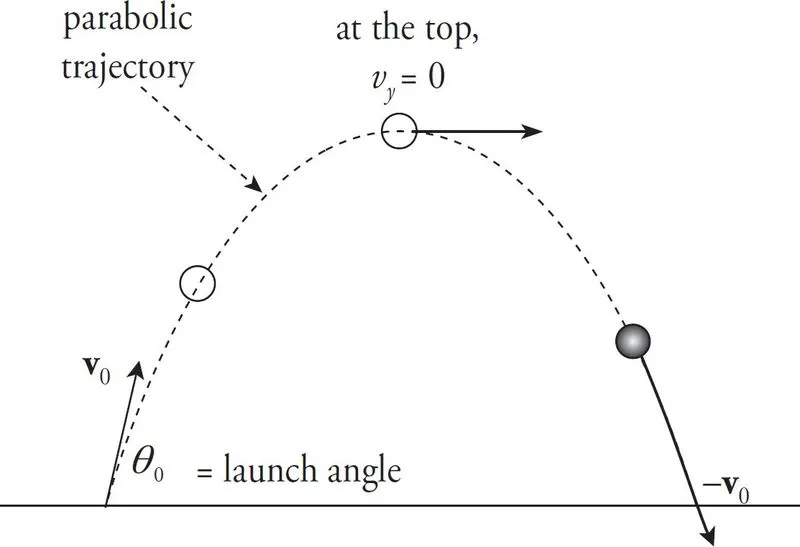
Where,
- v :- Initial velocity of object
- `theta` :- Angle of launch
- vx :- Horizontal velocity component (vx = v*cos `theta`)
- vy :- Verticle velocity component (vy = v*sin`theta`)
- t :- time of flight
- R :- Range (horizontal distance)
- h :- Initial height
- h.max :- maximum height
Time of flight :-
The time of flight of projectile motion is defined as the time from when the object is projected to the time it reaches the surface. It is the total time t for which the projectile remains in the air.

Maximum distance of projectile (Range) :-
Range is defined as the maximum distance that the object will reach in the horizontal direction.

Maximum height of projectile (h.max) :-
The greatest height that the object will reach is known as the peak of the object's motion. The range and the maximum height of the projectile does not depend upon its mass. Hence range and maximum height are equal for all bodies that are thrown with the same velocity and direction.
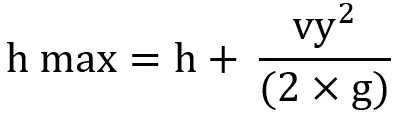
Trajectory :-
The trajectory is the curved path of the object in respect to its motion along with the gravity. We also refer to it as projectile motion.
verticle distance from ground is described by the following formula

Program :-
clear all
close all
clc

disp('Projectile motion calculator')

%input values
g=input('nAcceleration due to gravity (m/s^2) g = ');
v=input('nInitial velocity (m/s) v = ');
h=input('nInitial height (m) h = ');
angle=input('nAngle of lauch (degree) angle  = ');

%Horizontal velocity component
vx=v*cosd(angle);

%Verticle velocity component
vy=v*sind(angle);

fprintf('nResults')
%Time of flight in sec
t=(vy+sqrt((vy)^2+(2*g*h)))/g;
fprintf('nTime of flight in sec nt= %f',t)

%range of the projectile
R=vx*(vy+sqrt(vy^2+2*g*h))/g;
fprintf('nnRange of the projectile (Horizontal distance in meters) nR= %f',R)

%maximum height
h_max=h+vy^2/(2*g);
fprintf('nnMaximum height (in meters) nh max.= %f',h_max)

%projectile motion trajectory
%y=h + x*tan(theta)-g*x^2/2*V^2cos^2(theta)

%converting angle into radians
theta=(angle*pi/180);

%finding coordinates on x-axis
i=(g/2)/(v^2*(cos(theta))^2);

j=(tan(theta));

k=(h);

y=[-i j k];

%finding roots of polynomial equation
r=roots(y);
a=r(2);
b=r(1);
x=linspace(a,b,500);

Y=-i*x.^2+j*x+k;

figure(1)
plot(x,Y,'color','b','linewidth',3,LineStyle='-')
xlabel('bf Horizontal distance (m)')
ylabel('bf Verticle distance (m)')
title('Projectile Trajectory')
legend('Trajectory')
axis([0 100 0 30])
grid on

%Animation of projectile trajectory of object
ct=1;
    for f=1:length(x)
         X=x(f);
         Y=-i*X^2+j*X+k;

    figure(2)
    plot(X,Y,'o','MarkerFaceColor','r',MarkerSize=12)
    axis([0 100 0 30]);
    xlabel('bf Horizontal distance (m)')
    ylabel('bf Verticle distance (m)')
    pause(0.0001);
    grid on
    M(ct)=getframe(gcf);
    ct=ct+1;
    end

%creating video file
movie(M);
videofile=VideoWriter('Projectile_motion1','Uncompressed AVI');
open(videofile)
writeVideo(videofile,M)
close(videofile)
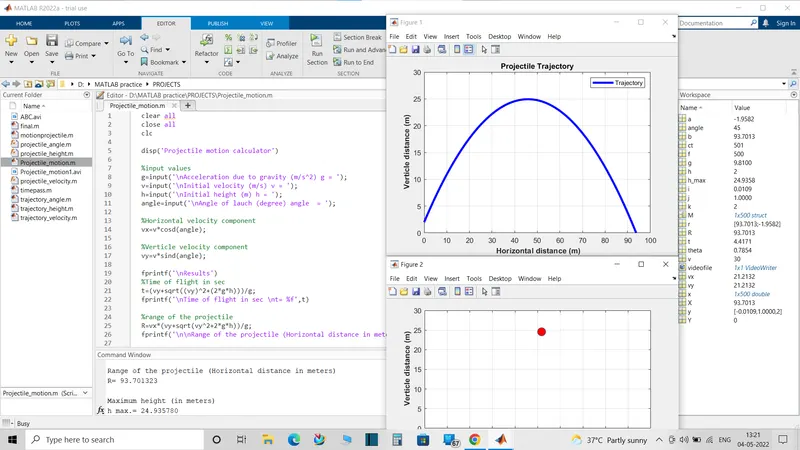
Output :-
Explaination of code :-
The Program starts with basic commands clear all, close all, clc
clear all- It is used to clear the data stored in the workspace.
close all- It is used to close the plots and figures etc.
clc- It is used to clear the command window.
First of all Input values of g, v, h, angle are required to enter in the command window while executing the program.
Horizontal and verticle velocity components are assigned to variables vx and vy respectively.
Time of flight, Range(horizontal distance), Maximum height are calculated using standard formula and results are displayed in command window using fprintf command.
The coordinates of projectile trajectory are calculated by the standard formula. It is a type of quadratic equation so we have divide this equation into three terms i.e [i, j, k] and it has been stored in array 'y'.
Roots of quadratic equation are calculated by using 'roots' command. here we have got the values of two (max. and min.) coordinates of X-axis. To find the coordinates of Y-axis we have created 500 equally spaced values bettween those two values of X coordinates using linspace command and used those values of 'x' in main equation to calculate the values of 'y'.
Graph of Projectile trajectory is plotted using the plot command. Labels on x-axis and y-axis are displayed using xlabel and ylabel commands respectively.
axis has been set for x-axis from 0 to 100 and for y-axis from 0 to 30 using 'axis' command. axis should be set according to the input values.
To animate the projectile motion for loop is used. Initially Loop counter is set then values of 1 to 500 are set in the array 'f'. Variable 'X' is defined to take a single value from array 'x' for each loop and used this value of 'X' in projectile trajectory equation.
All coordinates are plotted using plot command. Labels on x-axis and y-axis are displayed using xlabel and ylabel commands respectively. Circular object is created using 'marker' command. 'pause' command is used to pause the frame for certain timeplot images are saved into an array called 'M' using a function 'getframe(gcf)'. 'movie' command is used to combine all the frames which are stored in array 'M'. 'VideoWriter' function is used to create an empty video file. 'writeVideo' function is used to stich different plot images which are stored in array 'M' to obtain a series of plot and saved in AVI format in system. 'close' command is used to close the videofile.
Results :-
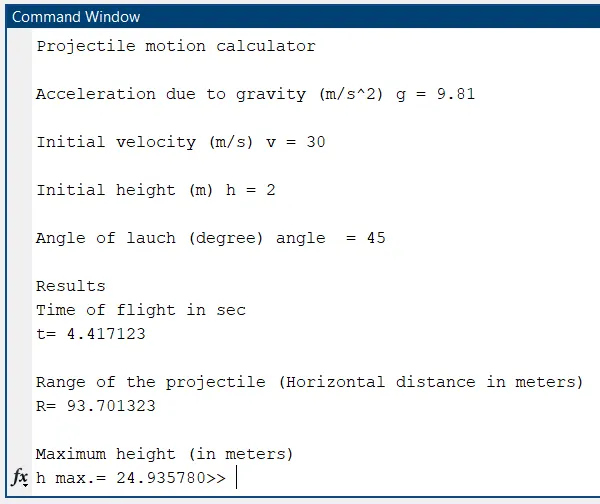
Projectile motion calculator

Acceleration due to gravity (m/s^2) g = 9.81

Initial velocity (m/s) v = 30

Initial height (m) h = 2

Angle of lauch (degree) angle  = 45

Results
Time of flight in sec
t= 4.417123

Range of the projectile (Horizontal distance in meters)
R= 93.701323

Maximum height (in meters)
h max.= 24.935780>>
Output Plot :-
Trajectory of a object :-
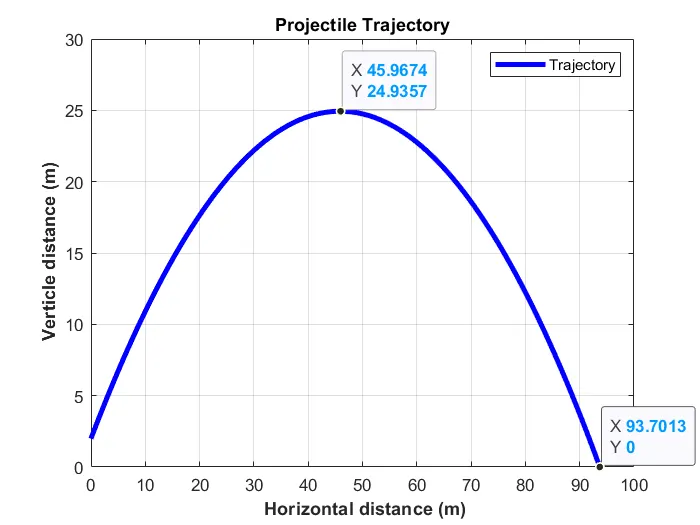
- Projectile motion follows a parabolic path
- In this plot we can see that the maximum height of the trajectory (h max.) is 24.9357 m and the horizontal distance (Range) of the projectile is 93.7013 m.
Animation of Projectile trajectory (gif file) :-
Output in Command Window :-
Program to analyse the projectile trajectory for different initial velocities :-
clear all
close all
clc

%input values
g=9.81;
v=linspace(15,40,5);
h=1.5;
angle=40;

%Horizontal velocity component
vx=v.*cosd(angle);

%Verticle velocity component
vy=v.*sind(angle);

%Time of flight in sec
t=(vy+sqrt((vy).^2+(2*g*h)))/g

%range of the projectile
R=vx.*(vy+sqrt(vy.^2+2*g*h))/g

%maximum height
h_max=h+vy.^2/(2*g)

%projectile motion trajectory
%y=h + x*tan(theta)-g*x^2/2*V^2cos^2(theta)

%converting angle into radians
theta=(angle*pi/180);
ct=1;
for n=1:length(v)
    V=v(n);

%finding coordinates on x-axis
i=(g/2)/(V^2*(cos(theta))^2);

j=(tan(theta));

k=(h);

y=[-i j k];

%finding roots of polynomial equation
r=roots(y);
a=r(2);
b=r(1);
x=linspace(a,b,500);

Y=-i*x.^2+j*x+k;

figure(1)
plot(x,Y,'linewidth',3,LineStyle='-')
hold on
xlabel('bf Horizontal distance (m)')
ylabel('bf Verticle distance (m)')
title('Projectile Trajectory')
axis([0 170 0 40])
grid on
ct=ct+1;
end
Output :-
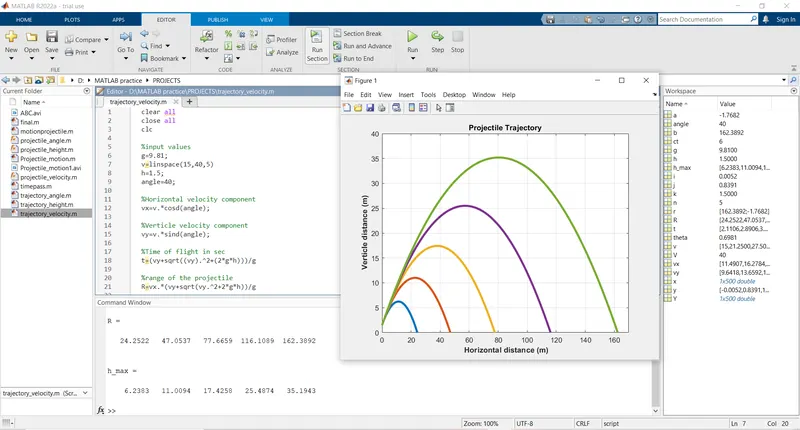
In this program we have taken a array of velocity and used that array in a projectile trajectory equation to obtain the plot of trajectory at different velocities.
Five values of velocity are taken between 15 to 40m/s using 'linspace' command. Other inputs are kept constant.
Similarly Time of flight, Range(horizontal distance), Maximum height are calculated using standard formula. ('.') is used in the equation as input is in the form of array.
To take one by one values from velocity array 'for loop' is used. 'v' variable is defined to store the values of velocity one by one and used that value in standard formula to calculate the x and y coordinates.
Projectile trajectory is plotted using plot command. Axis has been set for x-axis from 0 to 170 and for y-axis from 0 to 40 using 'axis' command.
Output Plot :-
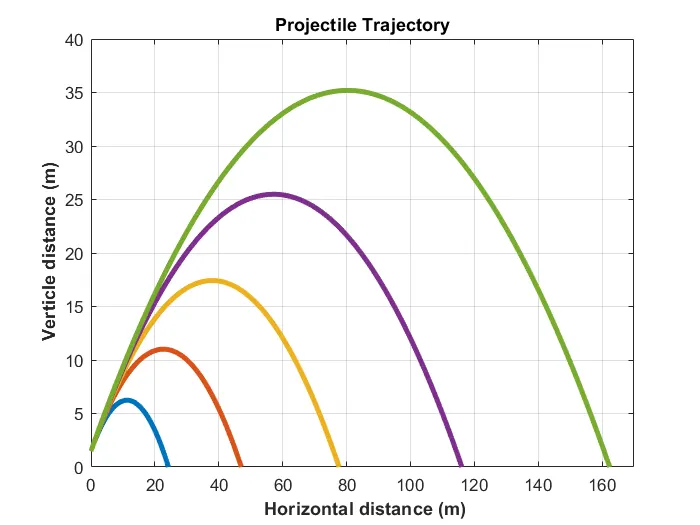
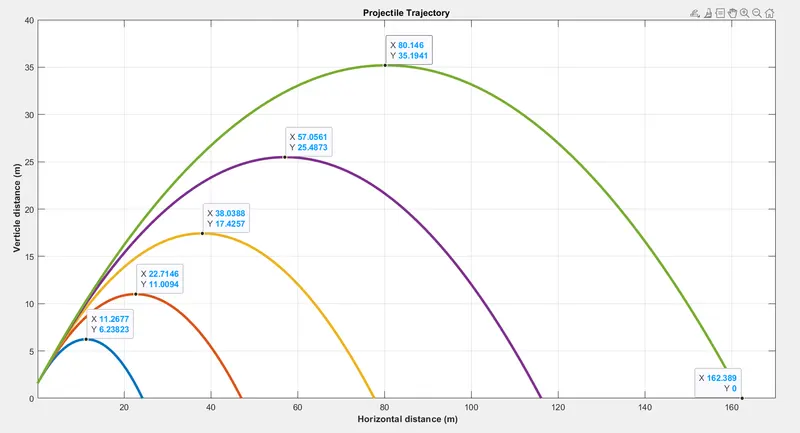
Trajectories of a body has been plotted for different velocities (15.0 m/s , 21.25 m/s , 27.50 m/s , 33.75 m/s , 40.00 m/s respectively).
As the velocity increases maximum height (h max.) and maximum horizontal distance (range) of a projectile trajectory are also increases.
Results :-
- Velocity :-

- Horizontal distance (Range) :-

- Maximum height (h max.) :-

Program to analyse the projectile trajectory for different Angles :-
clear all
close all
clc

%input values
g=9.81;
v= 30;
h=1;
angle=linspace(25,65,5)

%Horizontal velocity component
vx=v*cosd(angle);

%Verticle velocity component
vy=v*sind(angle);

%Time of flight in sec
t=(vy+sqrt((vy).^2+(2*g*h)))/g

%range of the projectile
R=vx.*(vy+sqrt(vy.^2+2*g*h))/g

%maximum height
h_max=h+vy.^2/(2*g)

%projectile motion trajectory
%y=h + x*tan(theta)-g*x^2/2*V^2cos^2(theta)

%converting angle into radians
theta=(angle*pi/180);
ct=1;
for n=1:length(angle)
    THETA=theta(n);

%finding coordinates on x-axis
i=(g/2)/(v^2*(cos(THETA))^2);

j=(tan(THETA));

k=(h);

y=[-i j k];

%finding roots of polynomial equation
r=roots(y);
a=r(2);
b=r(1);
x=linspace(a,b,500);

Y=-i*x.^2+j*x+k;

figure(1)
plot(x,Y,'linewidth',2,LineStyle='-')
hold on
xlabel('\bf Horizontal distance (m)')
ylabel('\bf Verticle distance (m)')
title('Projectile Trajectory for different angles')
axis([0 100 0 40])
grid on
ct=ct+1;
end
Output :-
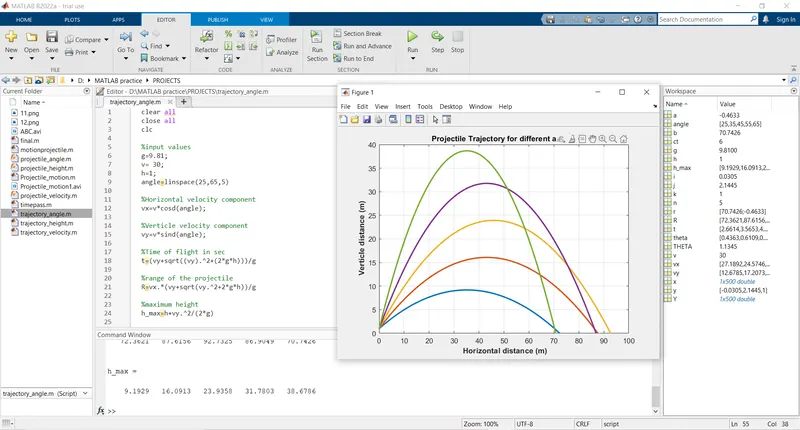
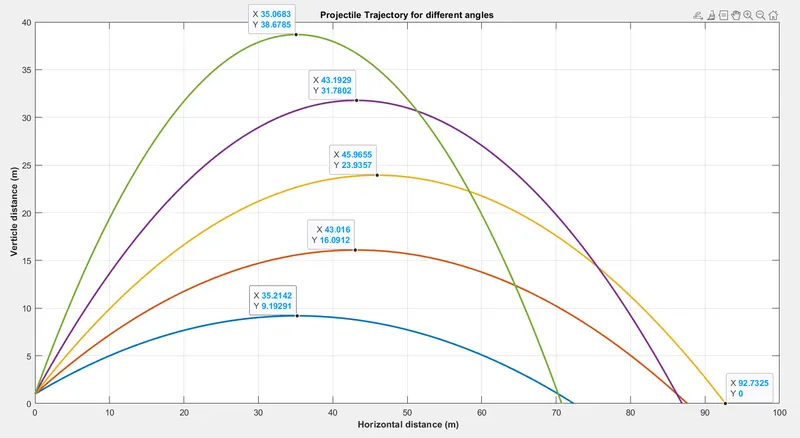
In this program we have taken a array of angle and used that array in a projectile trajectory equation to obtain the plot of trajectory at different angles.
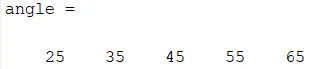
Five values of angles are taken between 25 to 65 degrees using 'linspace' command. Other inputs are kept constant.
Similarly Time of flight, Range(horizontal distance), Maximum height are calculated using standard formula. ('.') is used in the equations as input is in the form of array.
To take one by one values from angle array 'for loop' is used. 'THETA' variable is defined to store the values of angles one by one and used that value in standard formula to calculate the x and y coordinates.
Projectile trajectory is plotted using plot command. axis has been set for x-axis from 0 to 100 and for y-axis from 0 to 40 using 'axis' command.
Output Plot :-
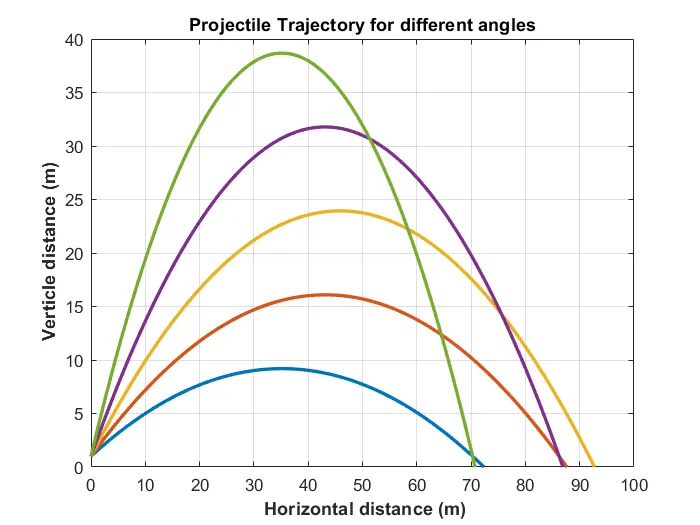
Trajectories of a body has been plotted for different angles (25, 35, 45, 55, 65 degrees respectively).
As the angle increases maximum height (h max.) of a projectile trajectory is also increases but maximum horizontal distance (Range) is increases upto 45 degrees. The Range of projectile at 55 degree and 65 degree are obtained less than the Range which is obtained at 45 degree.
So we can conclude that when the value of angle increases above 45 degree, the horizontal distance (Range) is decreases.
Results :-
- Angles :-
- Horizontal distance (Range) :-

- Maximum height (h max.) :-

Animation video of Projectile trajectory :-
Here is the link for the video of the Animation of Projectile trajectory
References :-
https://en.wikipedia.org/wiki/Projectile_motion
https://www.toppr.com/guides/physics/motion-in-a-plane/projectile-motion/
.