Project 1 - Parsing NASA thermodynamic data
Aim :- To write a program in MATLAB to parse the NASA thermodynamic data file and then calculate the thermodynamic properties of various gas species.
Objective :-
- To write a function that extracts the 14 co-efficients and calculates the enthalpy, entropy and specific heats for all the species in the data file.
- To calculate the molecular weight of each species and display it in the command window
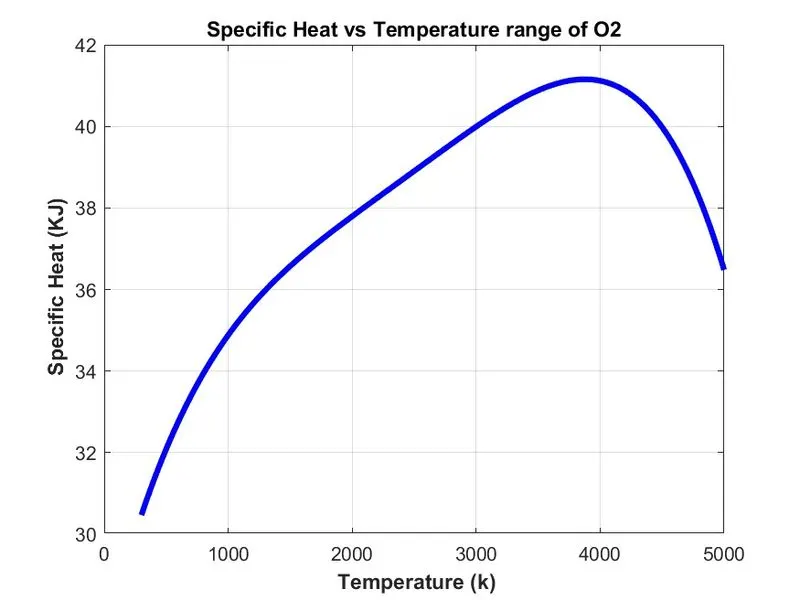
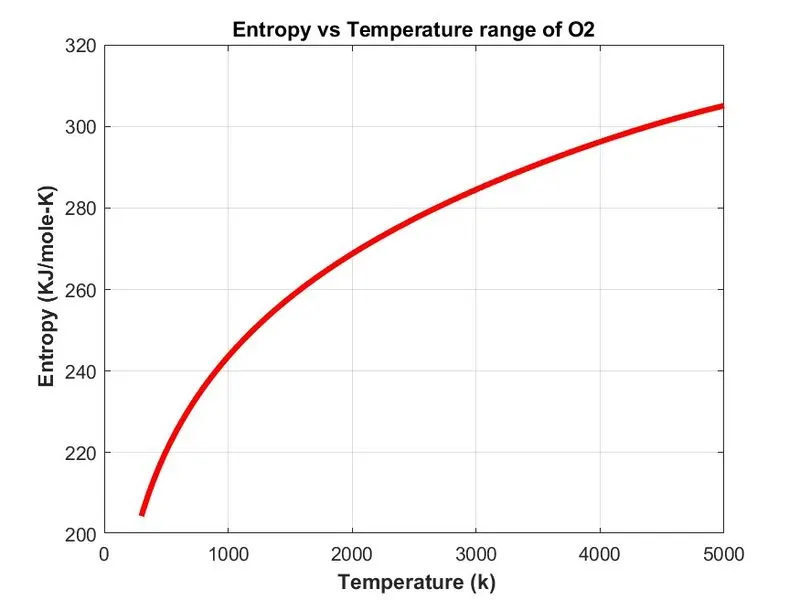
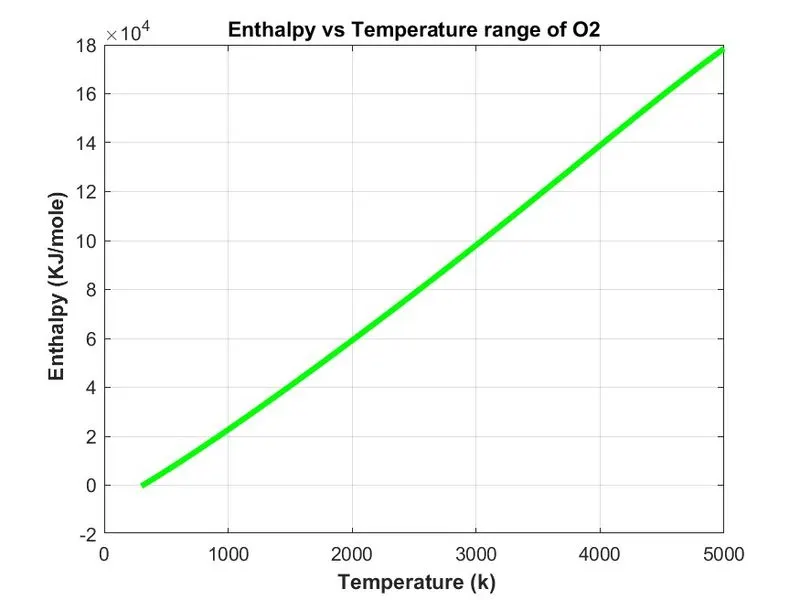
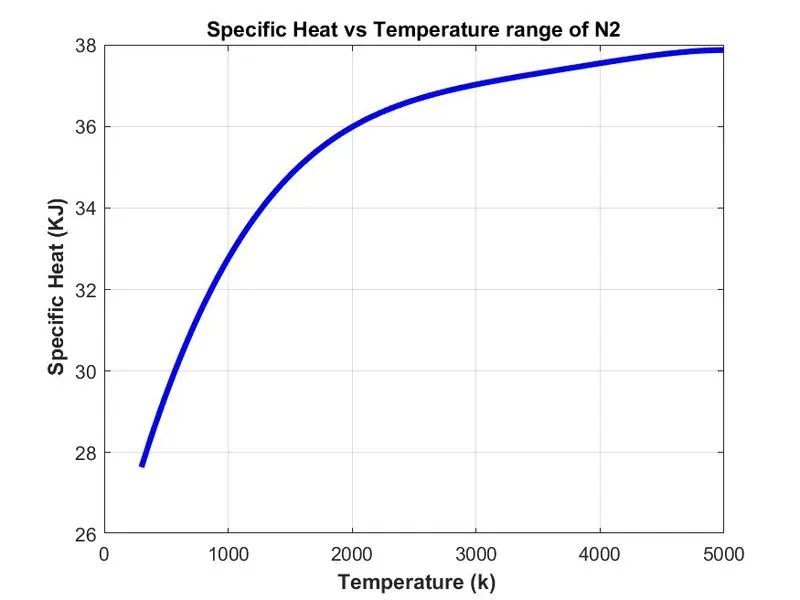
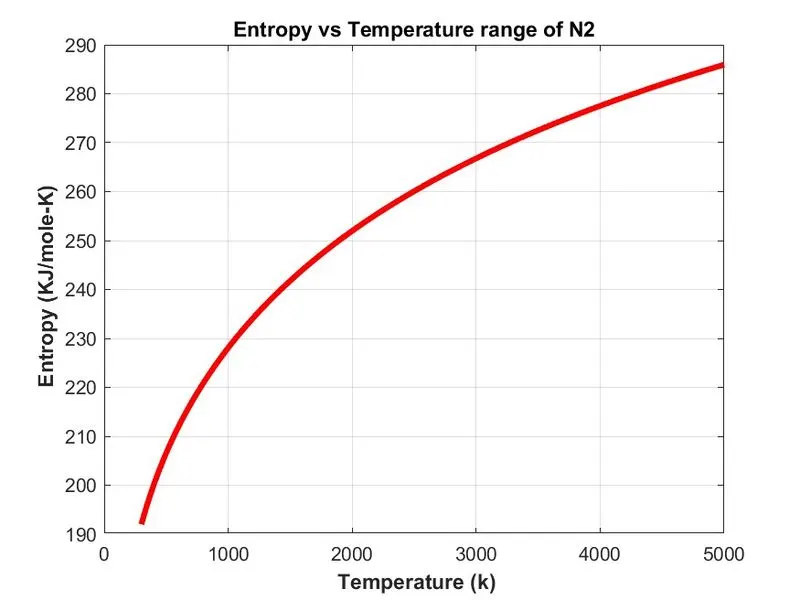
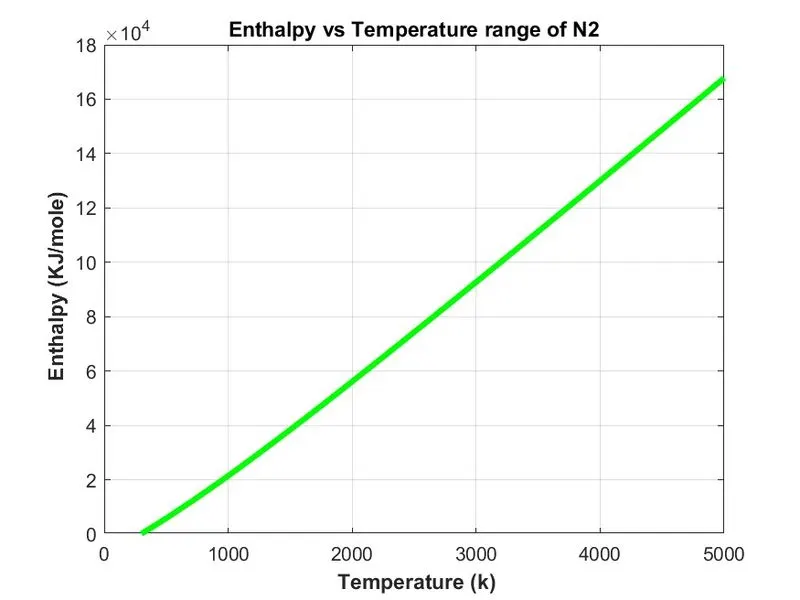
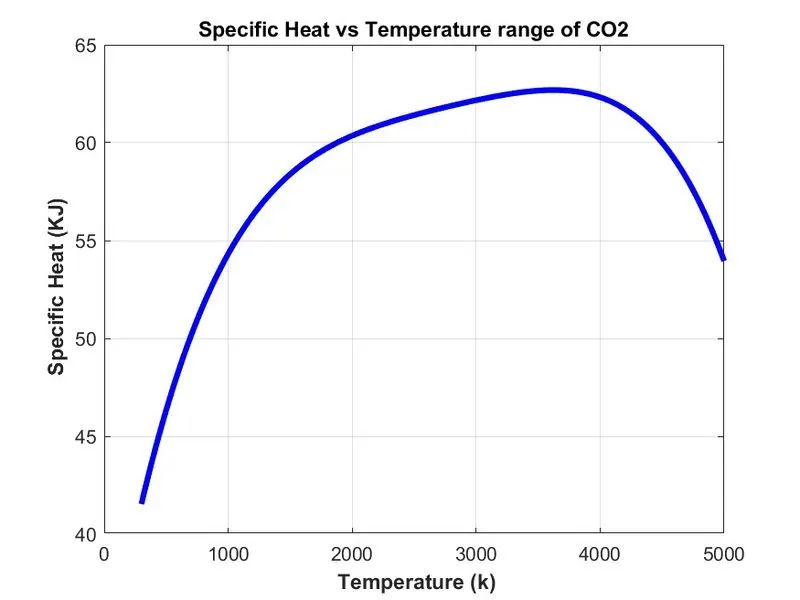
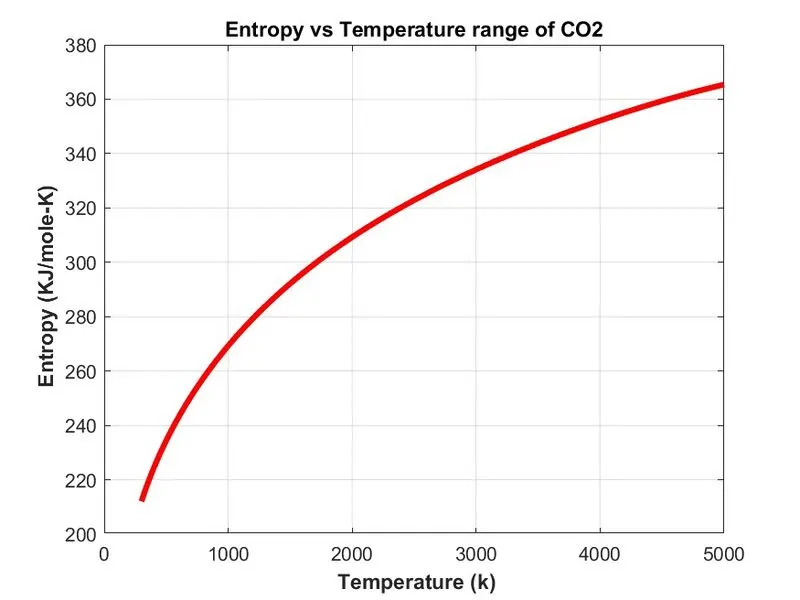
- To plot the Cp, Enthalpy and Entropy for the local temperature range (low temperature : high temperature) specific for each species.
- To save the plots as images with appropriate names and dump them in separate folders for each species with suitable name.
Theory :-
Data parsing is a process in which a string of data is converted from one format to another. It is mainly used for extracting the useful information from large datasets.
In this project we are going to extract information from NASA thermodynamic data file. It contains 53 gas species values. Each element has its own temperature range and 14 coefficients.
These coefficients are used to calculate the specific heat, Enthalpy, Entropy, molecular weight of each gas species.
Molecular weight :-
A Molecular weight is the sum of atomic weights of the atoms in a molecule.
Specific heat :-
specific heat is the quantity of heat required to raise the temperature of one kg of a substance by one Kelvin (or 1 °C), and its units are J/(kg K) or J/(kg °C).
cp = (a1 + a2 T + a3 T^2 + a4 T^3 + a5 T^4)*R
Enthalpy :-
Enthalpy is defined as the sum of the internal energy and the product of the pressure and volume of a thermodynamic system (H = E + PV). Enthalpy is state function. It has the dimensions of energy and is thus measured in units of joules or ergs.
H = (a1 + a2 T/2 + a3 T^2/3 + a4 T^3/4 + a5 T^4/5 + a6/T)*R*T
Entropy :-
Entropy is a measure of the randomness or disorder of a system. The value of entropy depends on the mass of a system. It is denoted by the letter S and has units of joules per kelvin. Entropy can have a positive or negative value. According to the second law of thermodynamics, the entropy of a system can only decrease if the entropy of another system increases.
S = (a1 lnT + a2 T + a3 T^2/2 + a4 T^3/3 + a5 T^4/4 + a7)*R
Main Program :-
clear all
close all
clc

%reading given (THERMO.dat) data file
f1=fopen('THERMO.dat','r');
get=fgetl(f1);

% Reading temperature from file
temp=fgetl(f1);
%splitting the strings into cells
s=strsplit(temp);

%converting string cells into numbers
temp_low=str2num(s{2});
temp_mid=str2num(s{3});
temp_high=str2num(s{4});

%Temperature range
T=linspace(temp_low,temp_high,1000);

% Universal gas constant Input
R=8.314;

for i=1:3
    get=fgetl(f1);
end

%Reading the species
for j=1:53
    tline=fgetl(f1);

    A=strsplit(tline,' ');
    species=(A{1});

    lowtemp=str2num(A{end-3});
    midtemp=str2num(A{end-2});
    hightemp=str2num(A{end-1});

    tline1=fgetl(f1);
    %finding the string E
    a=strfind(tline1,'E');

    %Extracting higher and lower temperature coefficient
    %Extracting higher temperature coefficient
    a1=tline1(1:a(1)+3);
    a1=str2num(a1);
    a2=tline1(a(1)+4:a(2)+3);
    a2=str2num(a2);
    a3=tline1(a(2)+4:a(3)+3);
    a3=str2num(a3);
    a4=tline1(a(3)+4:a(4)+3);
    a4=str2num(a4);
    a5=tline1(a(4)+4:a(5)+3);
    a5=str2num(a5);

    tline2=fgetl(f1);
    b=strfind(tline2,'E');
    a6=tline2(1:b(1)+3);
    a6=str2num(a6);
    a7=tline2(b(1)+4:b(2)+3);
    a7=str2num(a7);

    %Extracting lower temperature coefficients
    a8=tline2(b(2)+4:b(3)+3);
    a8=str2num(a8);
    a9=tline2(b(3)+4:b(4)+3);
    a9=str2num(a9);
    a10=tline2(b(4)+4:b(5)+3);
    a10=str2num(a10);

    tline3=fgetl(f1);
    c=strfind(tline3,'E');
    a11=tline3(1:c(1)+3);
    a11=str2num(a11);
    a12=tline3(c(1)+4:c(2)+3);
    a12=str2num(a12);
    a13=tline3(c(2)+4:c(3)+3);
    a13=str2num(a13);
    a14=tline3(c(3)+4:c(4)+3);
    a14=str2num(a14);

    % calculation of specific heat
    cp=specific_heat(a1,a2,a3,a4,a5,a8,a9,a10,a11,a12,T,R,temp_mid);

    % calculation of entropy
    S=Entropy(a1,a2,a3,a4,a5,a7,a8,a9,a10,a11,a12,a14,T,R,temp_mid);

    % calculation of enthalpy
    H=Enthalpy(a1,a2,a3,a4,a5,a6,a8,a9,a10,a11,a12,a14,T,R,temp_mid);

    %calculation of molecular weight of species
    W=Molecular_weight(species);

    % writing molecular weight file
    MW_file=fopen('Molecular Weight.txt','w');
    fprintf(MW_file,'Molecular Weight of %s is %d',species,W);
    fclose(MW_file);

    % plotting cp, H, and S with Temperature
    % saving in folder
    cd('D:\MATLAB practice\Project 1')
    mkdir(species);
    cd(species);

    % cp vs T (plot 1)
    figure(1)
    plot(T,cp,'linewidth',3,'color','b');
    xlabel('\bf Temperature (k)');
    ylabel('\bf Specific Heat (KJ)');
    title(sprintf('Specific Heat vs Temperature range of %s',species));
    grid on
    saveas(figure(1),'Specific Heat.jpg');

    % S vs T (plot 2)
    figure(2)
    plot(T,S,'linewidth',3,'color','r');
    xlabel('\bf Temperature (k)');
    ylabel('\bf Entropy (KJ/mole-K)');
    title(sprintf('Entropy vs Temperature range of %s',species));
    grid on
    saveas(figure(2),'Entropy.jpg');

    %H vs T (plot 3)
    figure(3)
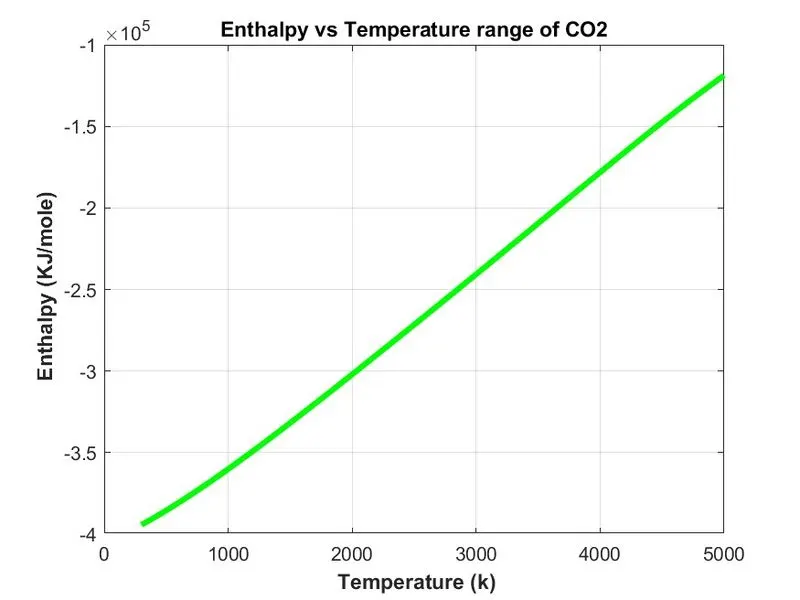
    plot(T,H,'linewidth',3,'color','g');
    xlabel('\bf Temperature (k)');
    ylabel('\bf Enthalpy (KJ/mole)');
    title(sprintf('Enthalpy vs Temperature range of %s',species));
    grid on
    saveas(figure(3),'Enthalpy.jpg');

    %To change current directory to main folder
    cd('D:\MATLAB practice')

end
Function to calculate Specific heat :-
function cp=specific_heat(a1,a2,a3,a4,a5,a8,a9,a10,a11,a12,T,R,temp_mid)

%Calculation of specific heat
if T<=temp_mid
    cp=R*(a8+(a9*T)+(a10*(T).^2)+(a11*(T).^3)+(a12*(T).^4));
else
    cp=R*(a1+(a2*T)+(a3*(T).^2)+(a4*(T).^3)+(a5*(T).^4));
end
Function to calculate Entropy :-
function S=Entropy(a1,a2,a3,a4,a5,a7,a8,a9,a10,a11,a12,a14,T,R,temp_mid)

%Calculation of Entropy

if (T<=temp_mid)
    S=R*(a8.*log(T)+(a9*T)+((a10*(T).^2)/2)+((a11*(T).^3)/3)+((a12*(T).^4)/4)+a14);
else
    S=R*(a1.*log(T)+(a2*T)+((a3*(T).^2)/2)+((a4*(T).^3)/3)+((a5*(T).^4)/4)+a7);
end
Function to calculate Enthalpy :-
function H=Enthalpy(a1,a2,a3,a4,a5,a6,a8,a9,a10,a11,a12,a14,T,R,temp_mid)
%calculation of enthalpy

if (T<=temp_mid)
    H=R*T.*(a8+((a9*T)/2)+((a10*(T).^2)/3)+((a11*(T).^3)/4)+((a12*(T).^4)/5)+((a13./T)));
else
     H=R*T.*(a1+((a2*T)/2)+((a3*(T).^2)/3)+((a4*(T).^3)/4)+((a5*(T).^4)/5)+((a6./T)));
end
Function to calculate Molecular weight :-
function W=Molecular_weight(species)

%Assigning the atomic name of the species
atomic_name=['H','C','O','N','Ar'];

%Assigning the atomic masses of the species
atomic_weight=[1.008 12.011 15.999 14.007 39.948];

W=0;

for i=1:length(species)
    for j=1:length(atomic_name)
        if strcmp(species(i),atomic_name(j))
        W=W+atomic_weight(j);
        position=j;
        end
    end

n=str2num(species(i));
if n>1
W=W+atomic_weight(position)*(n-1);
end
end
fprintf('\n\nMolecular weight of %s is \n = %f',species,W);
Explaination of code :-
The Program starts with basic commands clear all, close all, clc
clear all- It is used to clear the data stored in the workspace.
close all- It is used to close the plots and figures etc.
clc- It is used to clear the command window.
First of all THERMO.dat file is opened using fopen command. and 'r' is used in syntax to read this file then 'fgetl' command is used to read the data line by line.
To extract the temperature range from data it is required to covert the strings into number for that initially strings of temperature are splitted to string cell using 'strsplit' command then 'str2num' command is used to convert the character array or strings into numeric array.
Temperature array is defined by taking 1000 equally spaced values between 'temp_low' and 'temp_high' using 'linspace' command.
Universal gas constant value is assigned to the variable 'R'.
To skip next three comment lines in the data file 'for loop' is used.
To extract the data of all 53 gas species from the data file 'for loop' is used. species name and temperature in the species line is extracted.
'strfind' command is used to find strings within other strings, so location of string 'E' is found using 'strfind' command and it is stored in the variable 'a'.
First seven higher temperature coefficient and then seven lower temperature coefficient are extacted from data file and similarly they are converted into numeric array from strings using 'str2num' command.
Functions are called in the main program to calculate Specific heat, Enthalpy, Entropy and molecular weight using this 14 coefficients of lower and higher temperature. In each function lower and higher temperature condition is specified using 'if..else' command so coefficients are used for higher and lower temperature conditions accordingly in the specified formula.
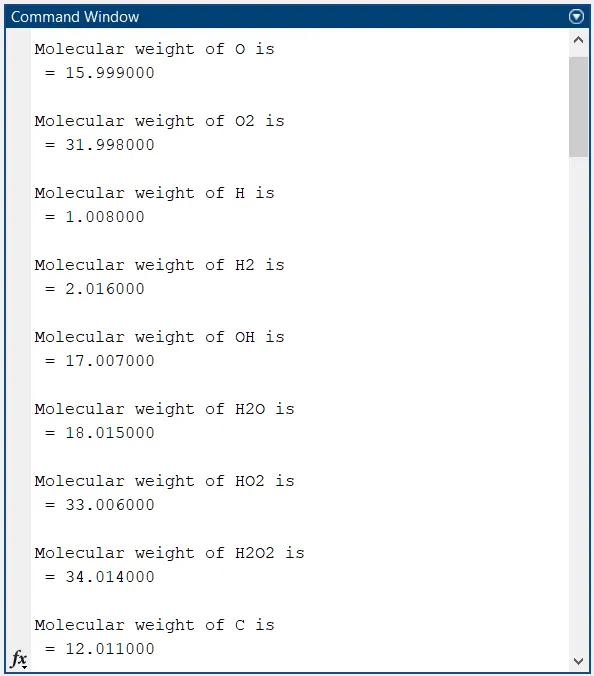
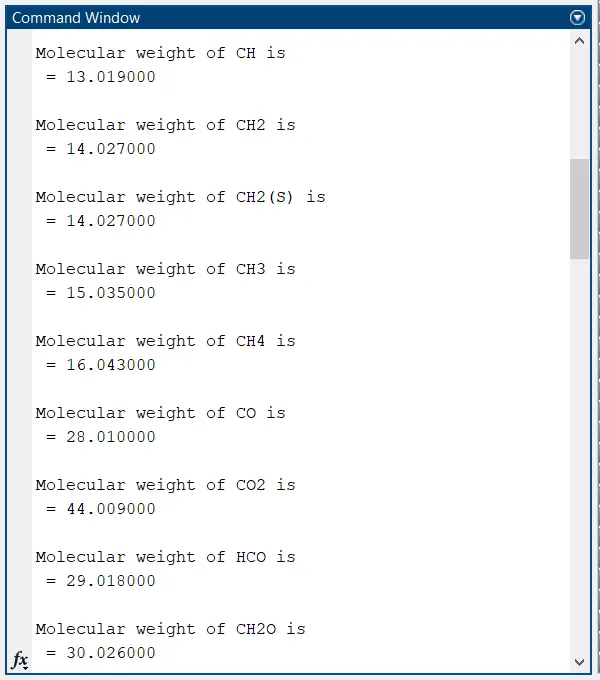
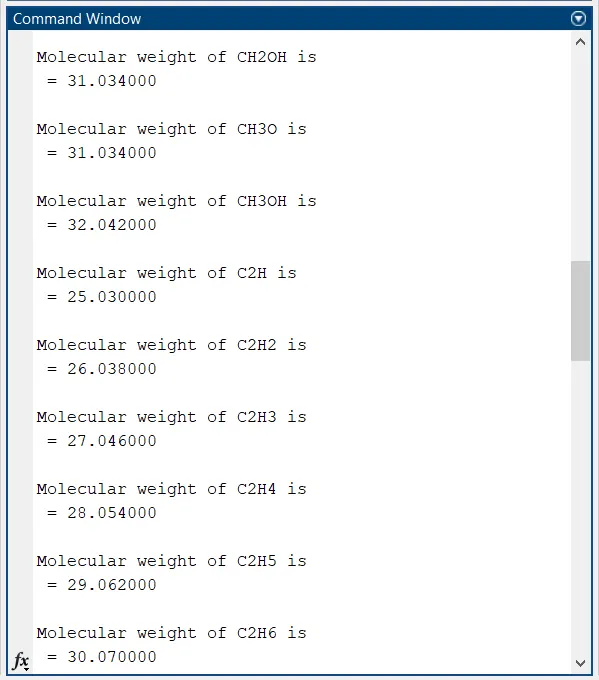
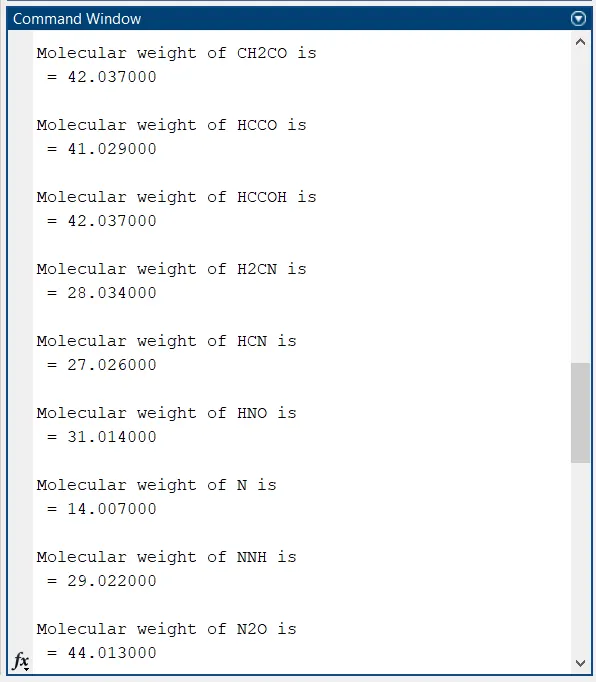
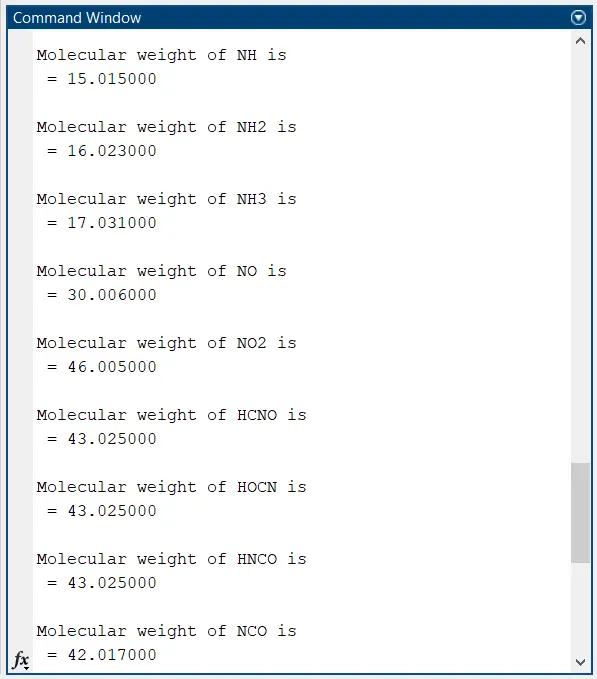
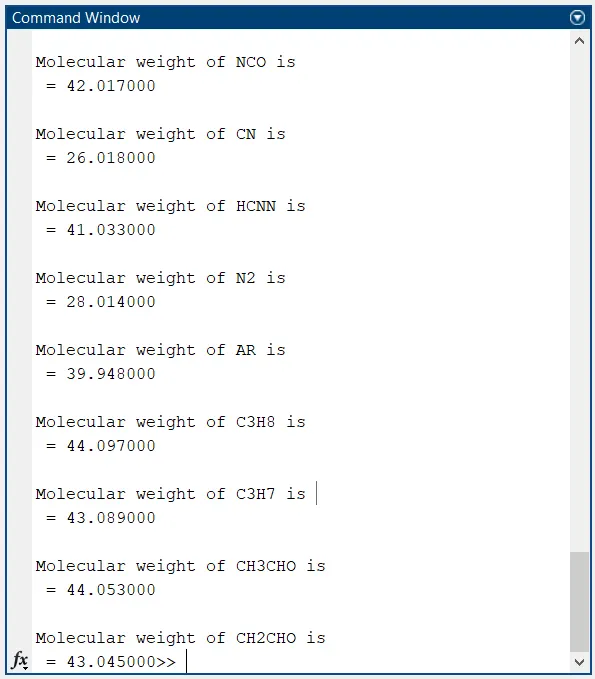
In order to calculate molecular weight of each gas species separate function is created. The calculated values of molecular weight of each gas is displayed in the command window.
Molecular weight of each species is written in the text file using 'fopen' and 'fprintf' commands.
'mkdir' command is used to create a new folder with the species name and 'cd' command is used to change the directory from main folder to newly created folder.
Graphs of cp vs T, S vs T and H vs T are plotted using plot command. Title is dispayed on each plot , sprintf is used to display the name of respective gas species. 'saveas' command is used to save the image of each plot in the given directory of computer. 'cd' command is used to change the directory from current folder to main folder.
Results (Molecular weight) :-
Molecular weight of O is
 = 15.999000

Molecular weight of O2 is
 = 31.998000

Molecular weight of H is
 = 1.008000

Molecular weight of H2 is
 = 2.016000

Molecular weight of OH is
 = 17.007000

Molecular weight of H2O is
 = 18.015000

Molecular weight of HO2 is
 = 33.006000

Molecular weight of H2O2 is
 = 34.014000

Molecular weight of C is
 = 12.011000

Molecular weight of CH is
 = 13.019000

Molecular weight of CH2 is
 = 14.027000

Molecular weight of CH2(S) is
 = 14.027000

Molecular weight of CH3 is
 = 15.035000

Molecular weight of CH4 is
 = 16.043000

Molecular weight of CO is
 = 28.010000

Molecular weight of CO2 is
 = 44.009000

Molecular weight of HCO is
 = 29.018000

Molecular weight of CH2O is
 = 30.026000

Molecular weight of CH2OH is
 = 31.034000

Molecular weight of CH3O is
 = 31.034000

Molecular weight of CH3OH is
 = 32.042000

Molecular weight of C2H is
 = 25.030000

Molecular weight of C2H2 is
 = 26.038000

Molecular weight of C2H3 is
 = 27.046000

Molecular weight of C2H4 is
 = 28.054000

Molecular weight of C2H5 is
 = 29.062000

Molecular weight of C2H6 is
 = 30.070000

Molecular weight of CH2CO is
 = 42.037000

Molecular weight of HCCO is
 = 41.029000

Molecular weight of HCCOH is
 = 42.037000

Molecular weight of H2CN is
 = 28.034000

Molecular weight of HCN is
 = 27.026000

Molecular weight of HNO is
 = 31.014000

Molecular weight of N is
 = 14.007000

Molecular weight of NNH is
 = 29.022000

Molecular weight of N2O is
 = 44.013000

Molecular weight of NH is
 = 15.015000

Molecular weight of NH2 is
 = 16.023000

Molecular weight of NH3 is
 = 17.031000

Molecular weight of NO is
 = 30.006000

Molecular weight of NO2 is
 = 46.005000

Molecular weight of HCNO is
 = 43.025000

Molecular weight of HOCN is
 = 43.025000

Molecular weight of HNCO is
 = 43.025000

Molecular weight of NCO is
 = 42.017000

Molecular weight of CN is
 = 26.018000

Molecular weight of HCNN is
 = 41.033000

Molecular weight of N2 is
 = 28.014000

Molecular weight of AR is
 = 39.948000

Molecular weight of C3H8 is
 = 44.097000

Molecular weight of C3H7 is
 = 43.089000

Molecular weight of CH3CHO is
 = 44.053000

Molecular weight of CH2CHO is
 = 43.045000>>
Screenshot of the window where all the folders are saved :-

Output Plots :-
Plots for O2
Plots for N2
Plots for Co2
Molecular weight of all species :-
Conclusion :-
Thus the specific heat, Enthalpy, Entropy for all the species has been calculated and plotted against the local temperature range. The Molecular weight has been calculated for all the species.
References :-
https://en.wikipedia.org/wiki/Parsing
https://www.mathworks.com/help/matlab/ref/fgetl.html
https://www.mathworks.com/help/matlab/ref/mkdir.html
https://www.mathworks.com/help/matlab/ref/cd.html