Project Transient simulation of flow over a throttle body
Aim : To study Flow through a throttle body (Transient case).
Objective : To study the changing pressure and velocity of a fluid flowing over a throttle in an elbow .
- Set up a transient case , where throttle rotates in different angles.
- To show mesh & results obtained different cases.
- Plot graphs for velocity, pressure and mass flow rate and compare the results. Formulate theoretical results and compare with simulations.
Abstract : A throttle is used in a channel to control the flow and increase the efficiency as the fluid flow.But as this fluid or air flow over throttle there is loss in pressure,velocity and overall mass flow rate. Changing throttle angle fluctuates pressure and flow rate and thereby affecting efficiency.
Formulae Used :
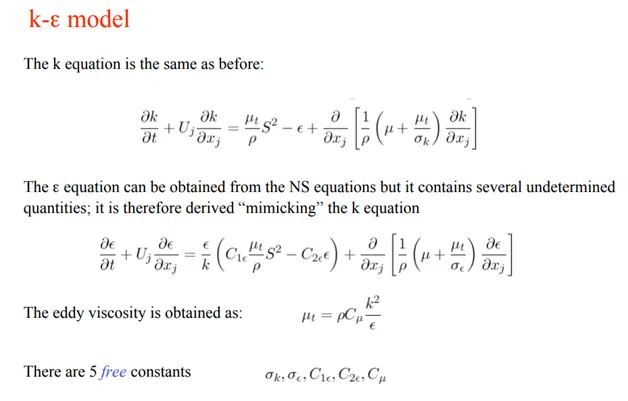
2) Reynolds Number : `ρμL/μ`
`ρ` = Density of fluid
`μ` = Flow Speed
L = Length of cross section area.
`μ`= Dynamic Viscosity
Some of the factors considered are:
Law of wall : In fluid dynamics, the law of the wall states that the average velocity of a turbulent flow at a certain point is proportional to the logarithm of the distance from that point to the wall.
Shear stress : F (tangential force) / Area
Static Pressure : Idle Pressure available in system. It is important to calculate static pressure in the system as it affects the changing pressure.
Kinetic Pressure : Equivalent pressure available in a moving fluid is kinetic pressure.
Total Pressure = Static Pressure + Kinetic Pressure
Problem Statement:
Q.) To find out average mass flow rate of a fluid flowing over throttle when throttle rotating by “25“degree having inlet pressure of 150000 and outlet of 10000pa. Define boundry conditions. Plot graphs representing flow change from input to output. Calculate avg mass flow rate.
Step 1 : Case Setup .
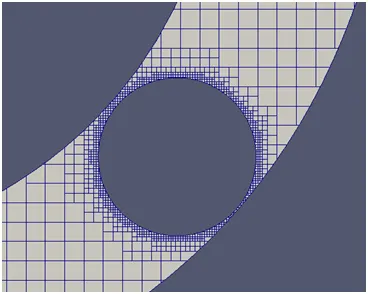
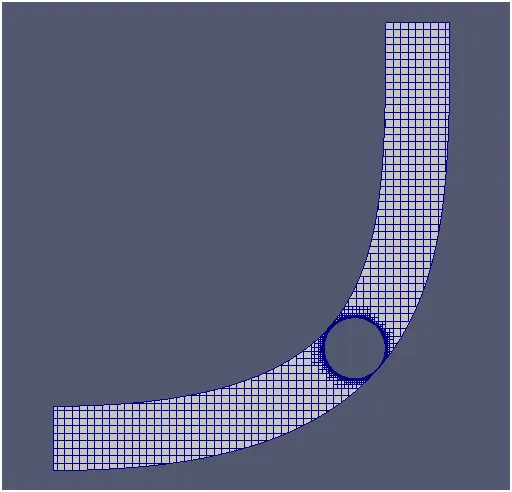
Step 2 : Defining Boundry conditions and mesh refinement to get required outputs.
Step 3 : Calculating End Time.
Max object length
End Time = ---------------------------------------------------
Avg Velocity at inlet
Step 4 : Mesh
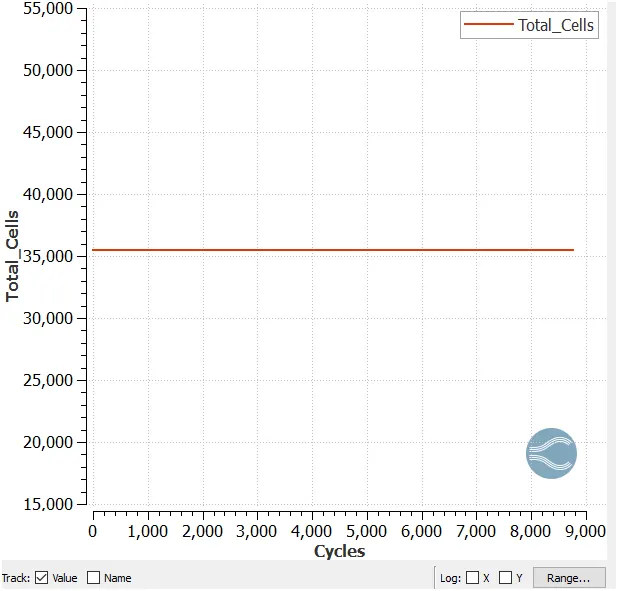
Total Cell Count :
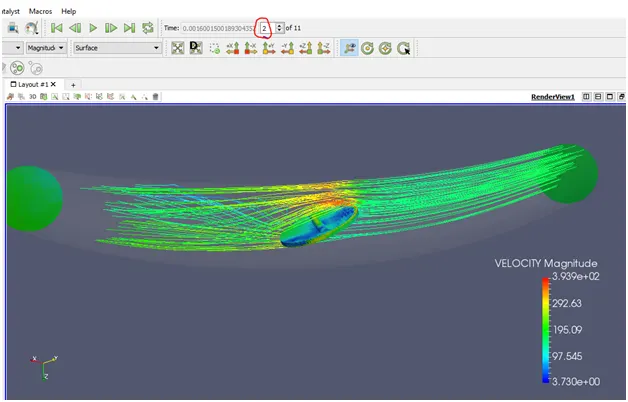
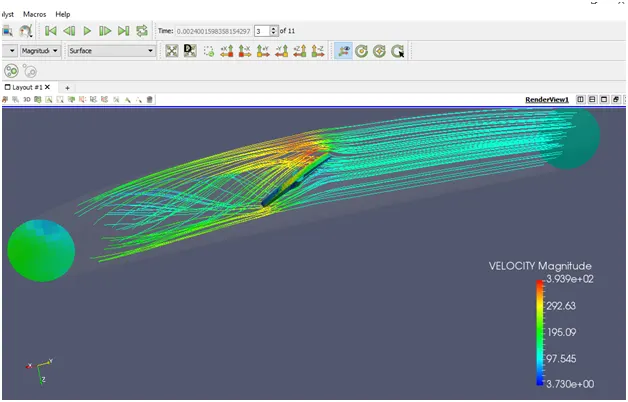
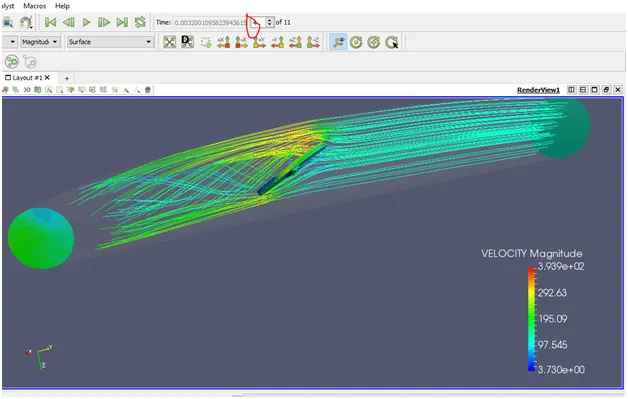
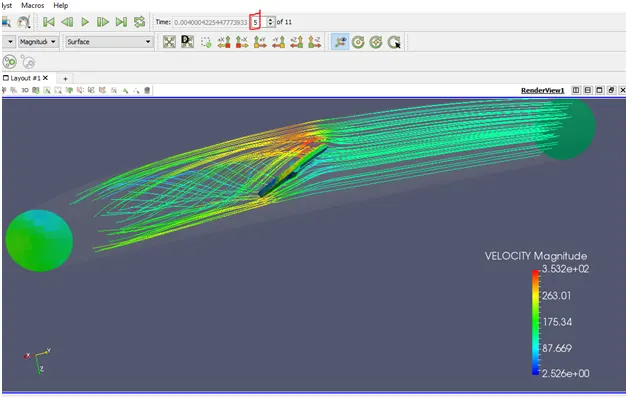
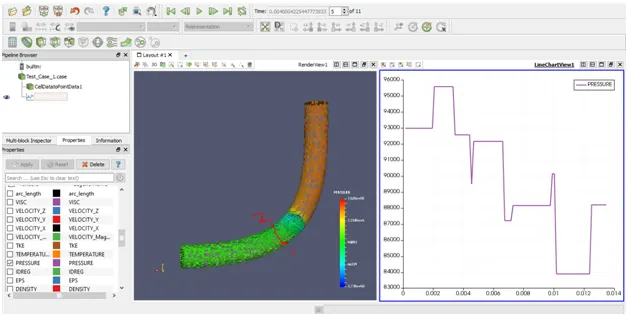
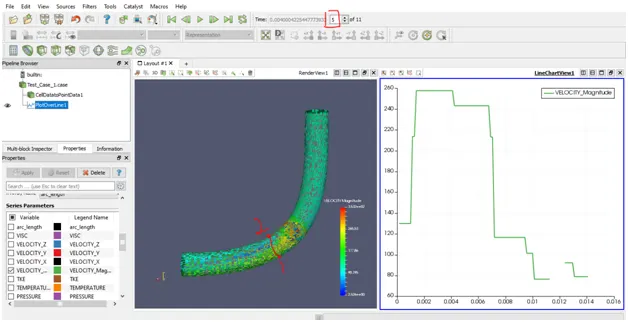
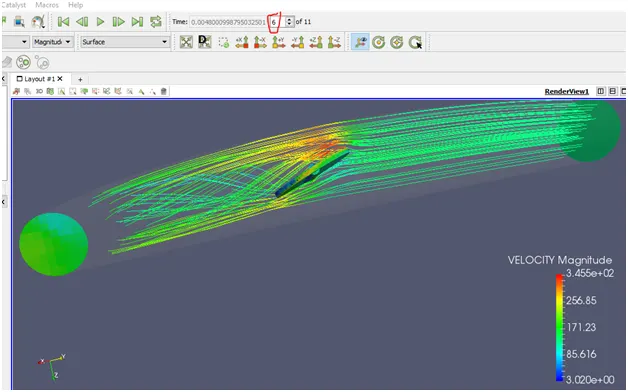
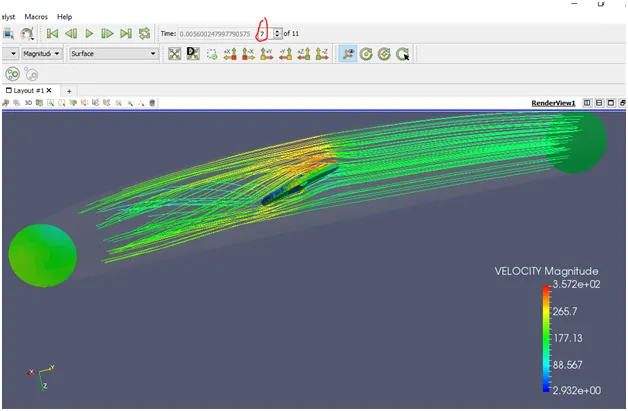
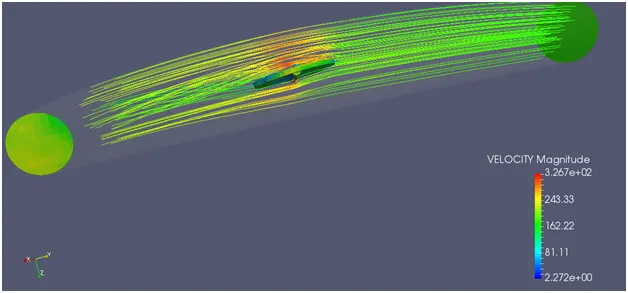
Transient FLow with moving Throttle at different Time Cycle :
Analysis Results and Conclusion :
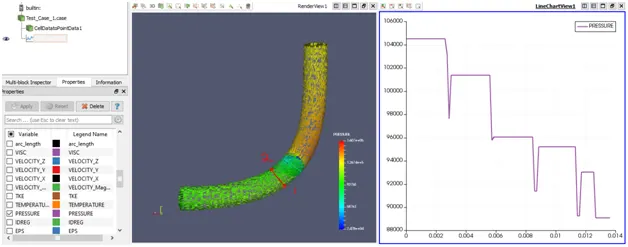
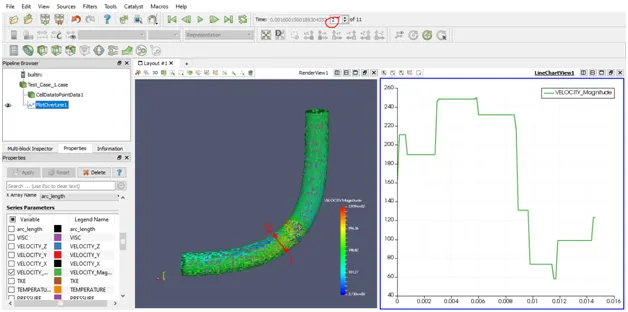
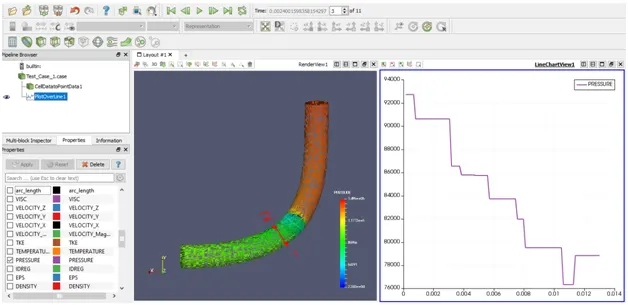
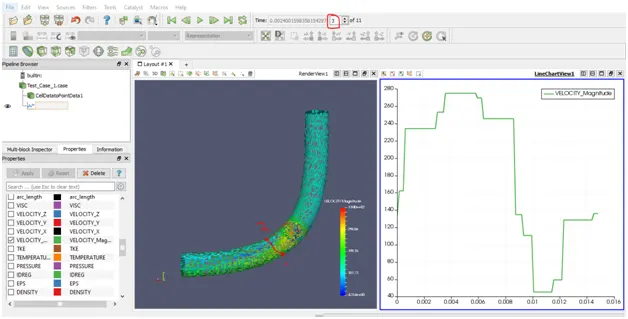
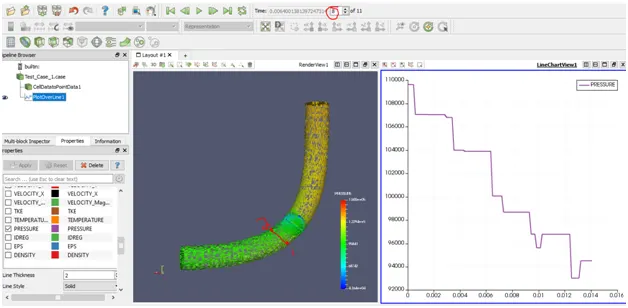
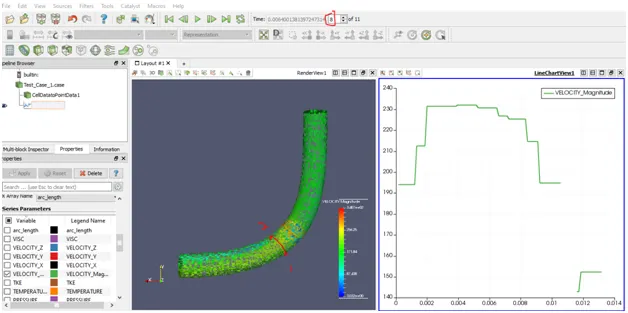
We plotted graphs for pressure and velocity at different time cycles when throttle rotated at different angles :
As we see in cycle 2 , pressure was 102000
cycle 3, pressure reduced to 94000
cycle 5, pressure kept reducing to 90000
cycle 8, pressure increased over 110000 as throttle plate angle reduced.
We conclude that pressure increased with increase in throttle angle. More the throttle rotated(closing) more was the pressure drop seen.
Similar was the case for velocity , velocity kept reducing while hitting the throttle surface but, increased away from.
When Fluid hit the throttle at closed possition the pressure becomes almost zero (stagnant).Fluid is pushed towards the elbow wall thereby converting static energy into kinetic energy and velocity increases.
Max deviation in Pressure and Velocity was seen near the wall of the tube and became stable as it moved away from throttle towards outlet.