Flow over a backward facing step
Aim : To study Flow over Backward-Facing Step with Different Turbulence Model.
Objective : To set-up 3 different case and run simulation for 3 different mesh size.
To show mesh & results obtained for 3 different cases.
Plot graphs for velocity, pressure and mass flow rate and compare the results.
Formulate theoretical results and compare with simulations.
Abstract : Flow over Backward-Step is a perfect example to understand the concept of recirculation of fluid flow, how vortices are generated/formed (vortex generation) due to change in cross section area.
Formulae Used :
Governing Laws used for this project are Conservation of mass & momentum
Reynolds Averaged Navier-Stokes (RANS):
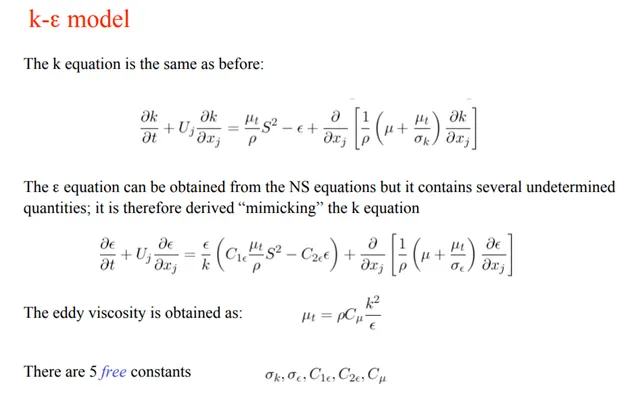
2) Reynolds Number : `ρμL/μ`
ρ= Density of fluid
μ = Flow Speed
L = Length of cross section area.
μ = Dynamic Viscosity
Some of the factors considered are:
Law of wall : In fluid dynamics, the law of the wall states that the average velocity of a turbulent flow at a certain point is proportional to the logarithm of the distance from that point to the wall.
Shear stress : F (tangential force) / Area
Static Pressure : Idle Pressure available in system. It is important to calculate static pressure in the system as it affects the changing pressure.
Kinetic Pressure : Equivalent pressure available in a moving fluid is kinetic pressure.
Total Pressure = Static Pressure + Kinetic Pressure
Problem Statement:
Q.) To find out average flow velocity and pressure of a fluid flowing over a backward facing step having inlet pressure of 110325.0 pa. Define boundry conditions. Plot graphs representing flow change from input to output. Calculate avg from 3 different mesh sizes 2.5e-3 m, 1.5e-3m, 1.2e-3m.
Case setup Process :
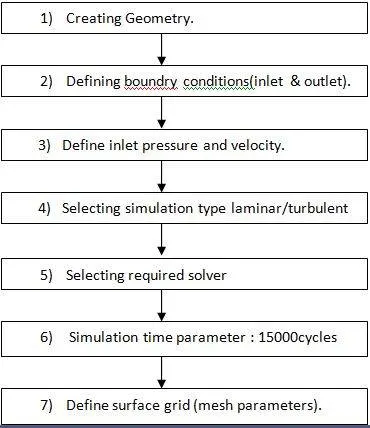
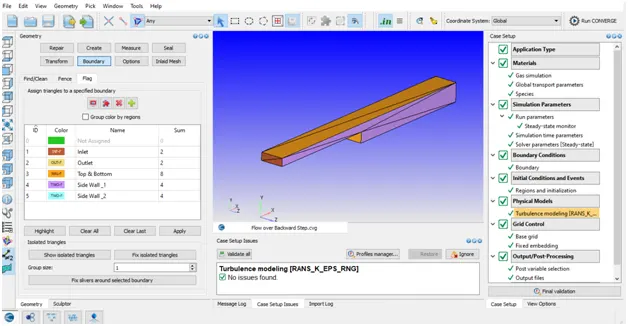
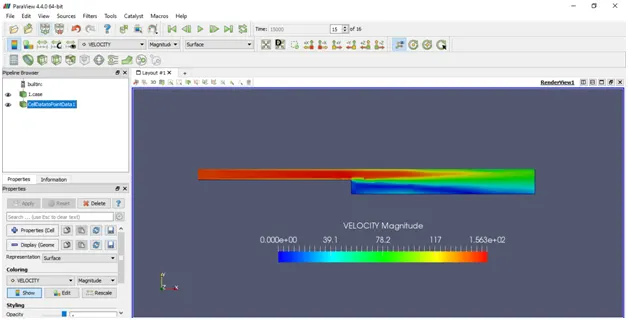
Case-1 : Base Mesh Size 2e-3m.
Case setup
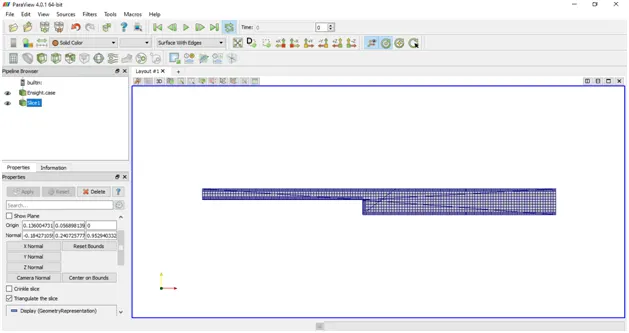
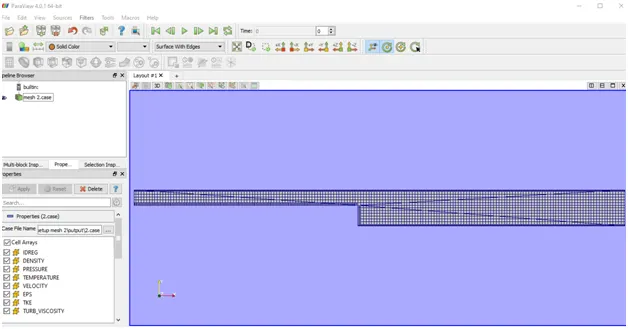
Surface mesh :
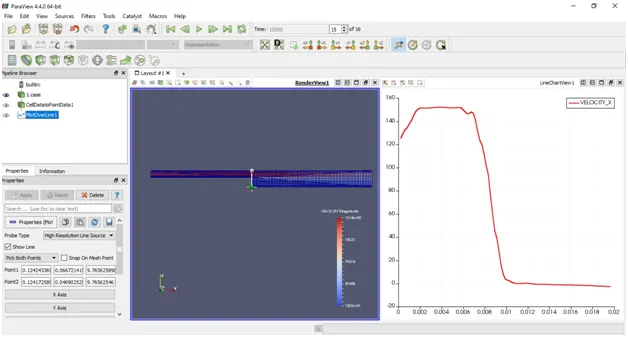
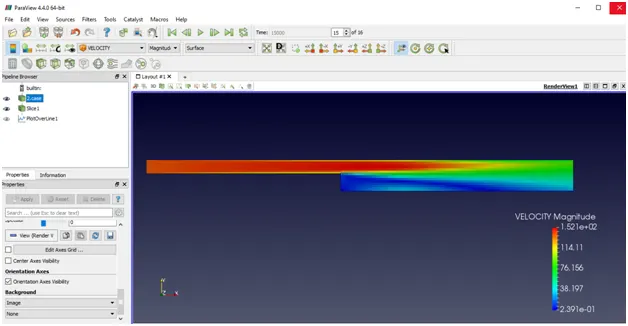
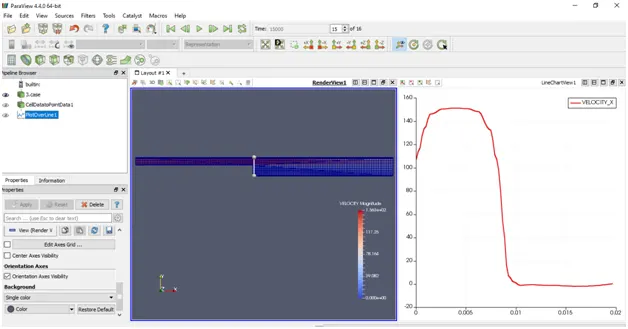
Area plot : Plot over line - Velocity along X-axis
Case-2 : Case for base mesh size 1.5e-3m
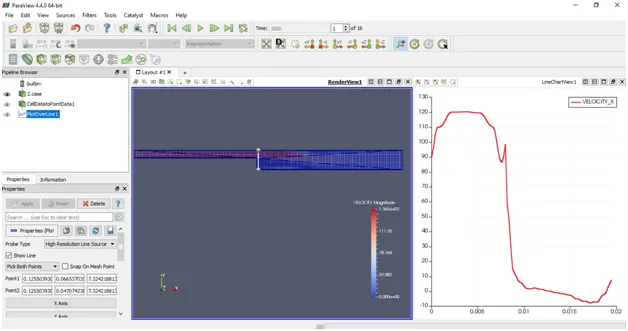
Area plot for mesh 2 :
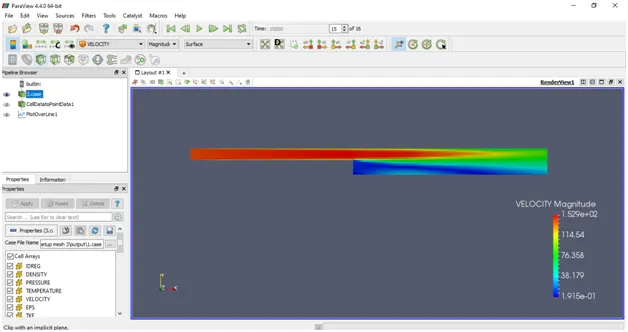
Case 3 : Surface mesh 1.2e-3m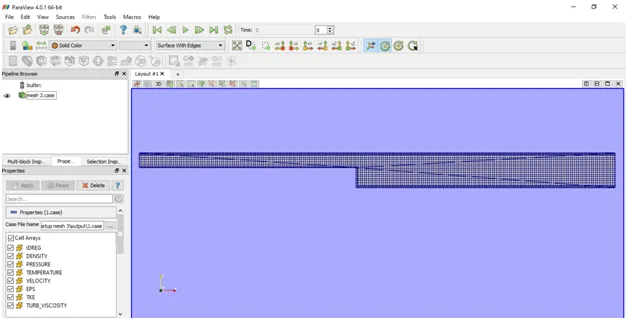
Area plot for velocity
Remarks & Conclusion:
From the plotted Graph along line we can see that velocity of flow is maximum at entrance but as cross-section area changes the flow seperates and the region at the bottom (behind the step) has back flow forming vortices and the velocity in that region becomes almost zero.As the fluid flows away from step it reaches steady state.If the length of pipe after the step is reduced the fluid will not flow outside, instead would just flow back.
Hence from this project we understand the concepts of Vortex , how they are generated and how the changing cross-sectional area might affect the pressure and velocity of a flowing fluid.