Project Steady state simulation of flow over a throttle body
Aim : To study Flow through a throttle body.
Objective : To study the change in pressure and velocity of a fluid flowing over a throttle in an elbow .
- Set up a steady state case, when throttle is open (throttle angle”0” degree).
- To show mesh & results obtained.
- Plot graphs for velocity, pressure and mass flow rate and compare the results. Formulate theoretical results and compare with simulations.
Abstract : Main purpose of using a throttle is to control the flow of liquid or air through a channel. But whenever fluid or air flowing inside a pipe or elbow encounters a trottle it tends to reduce some of its pressure ,velocity and eventually average mass flow rate.
Our aim is this project is to study these cha`μ`nges in mass flow rate and rectify ways to improve efficiency.
Formulae Used :
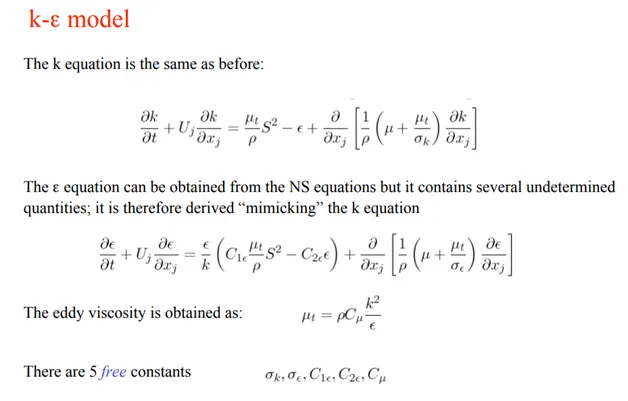
2) Reynolds Number : `ρμL/μ`
`ρ`= Density of fluid
`μ`= Flow Speed
L = Length of cross section area.
`μ`= Dynamic Viscosity
Some of the factors considered are:
Law of wall : In fluid dynamics, the law of the wall states that the average velocity of a turbulent flow at a certain point is proportional to the logarithm of the distance from that point to the wall.
Shear stress : F (tangential force) / Area
Static Pressure : Idle Pressure available in system. It is important to calculate static pressure in the system as it affects the changing pressure.
Kinetic Pressure : Equivalent pressure available in a moving fluid is kinetic pressure.
Total Pressure = Static Pressure + Kinetic Pressure
Problem Statement:
Q.) To find out average mass flow rate of a fluid flowing over throttle . Case 1 throttle fully open (throttle angle “0” degree) steady state condition having inlet pressure of 150000 and outlet of 10000pa. Define boundry conditions. Plot graphs representing flow change from input to output. Calculate avg mass flow rate.
Step 1 : Case Setup.
Step 2 : Defining Boundry conditions and mesh refinement to get required outputs.
Step 3 : Mesh.
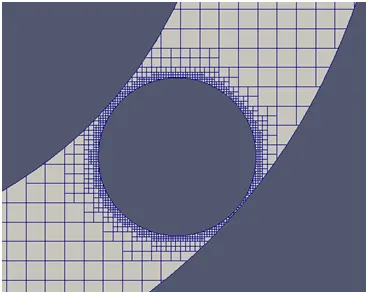
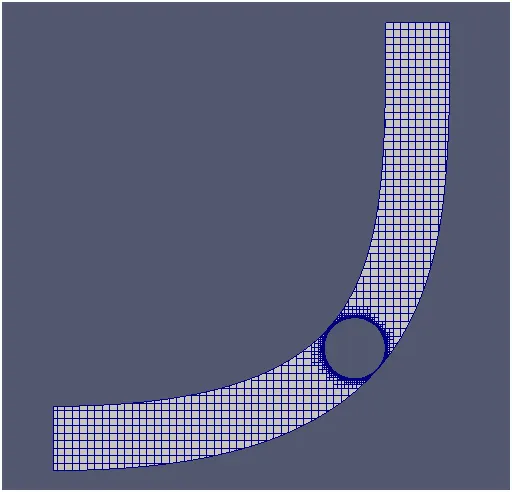
Total Cell Counts :
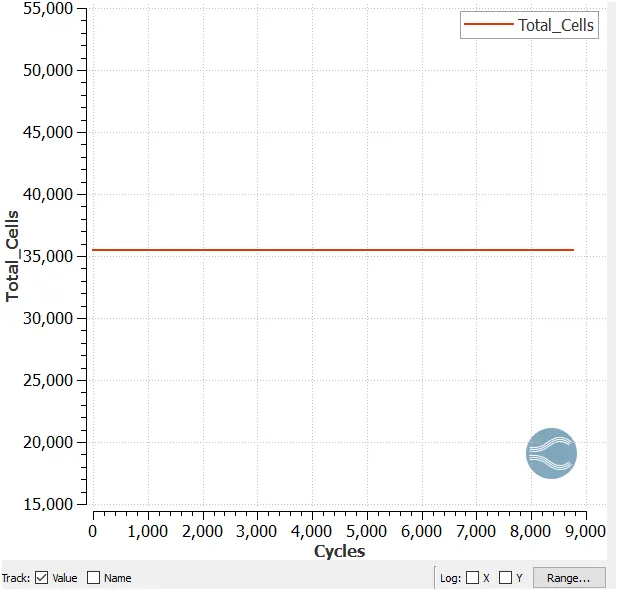
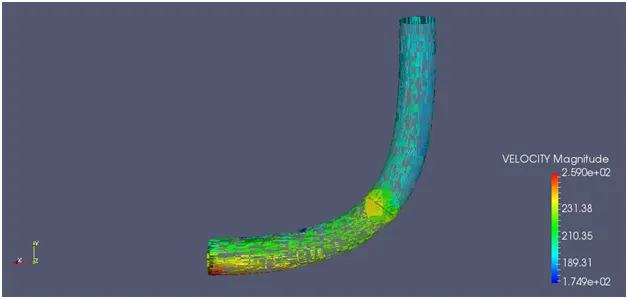
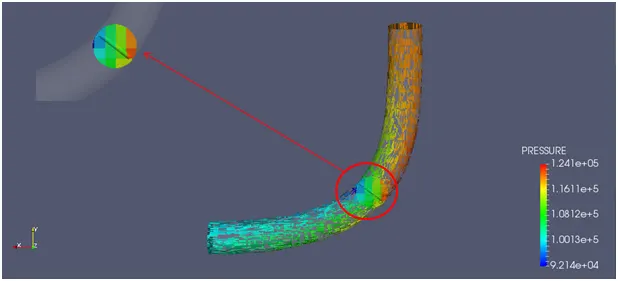
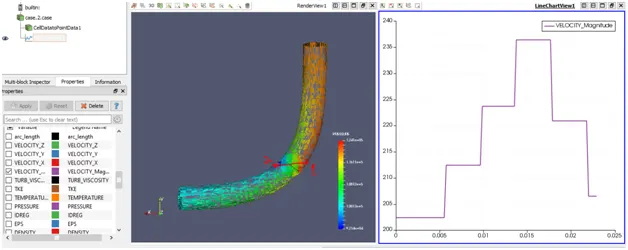
Velocity and Pressure Flow :
Plot over line 1:
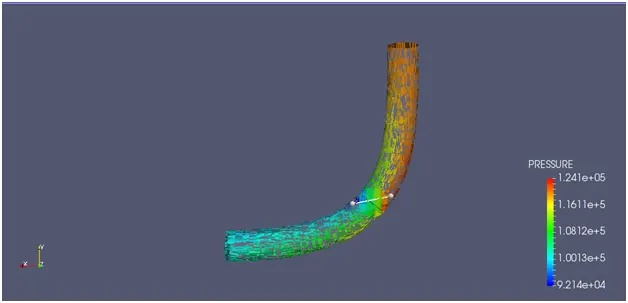
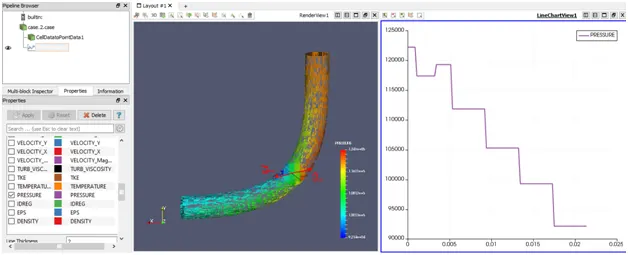
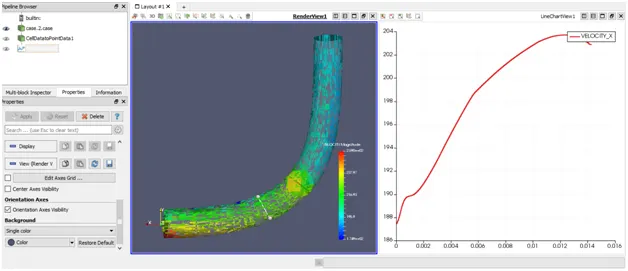
Plot over Line 2:
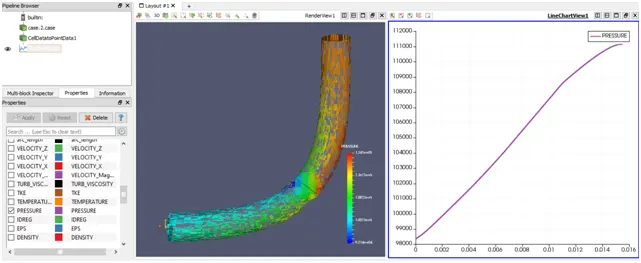
Results and conclusion:
After running Simulation we see :
- Pressure at inlet was maximum -> After hitting Throtle valve Pressure reduces and continues to flow out with lesser pressure value.
- Velocity at inlet was minimum -> And at oulet it increased.
- As fluid hits throttle the pressure becomes reduces and become stagnent, and as it moves out of its static energy is converted to kinetic energy thereby increasing velocity at outlet.
- By plotting graphs we concluded that pressure and velocity are inversely propertional to each other .