Project Transient simulation of flow over a throttle body
Transient Simulation of flow over a Throttle body
Aim:
To setup the given throttle body geometry and simulate with the Transient state flow over it by using Converge CFD.
Objectives:
- To setup the given Throttle body geometry case in Converge CFD.
- To simulate the Transient state flow of the Throttle body case by CYGWIN.
- To simulate the Throttle body case physically using PARAVIEW.
- To create and analyze the plots of the simulation results by Converge CFD.
Setting up the case in Converge CFD:
- Open Converge CFD and click New Project.
- Click and drag the given Throttle body geometry case.
- Check the scale of the geometry with respect to Converge CFD which is in meters. If it is in mm scale it to m.
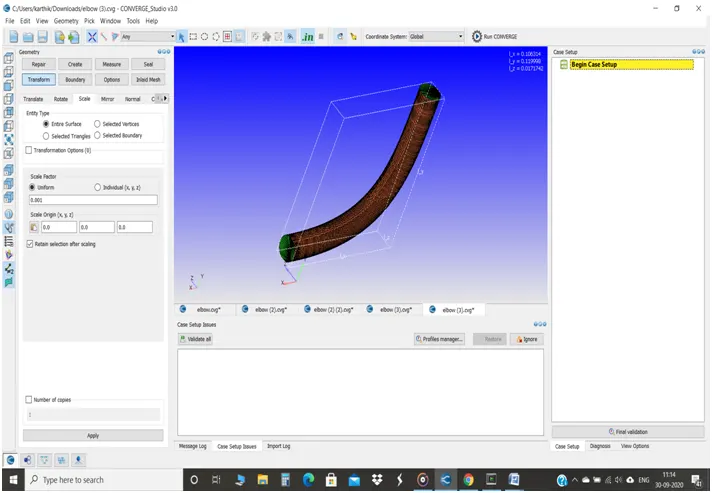
The entire throttle body geometry:
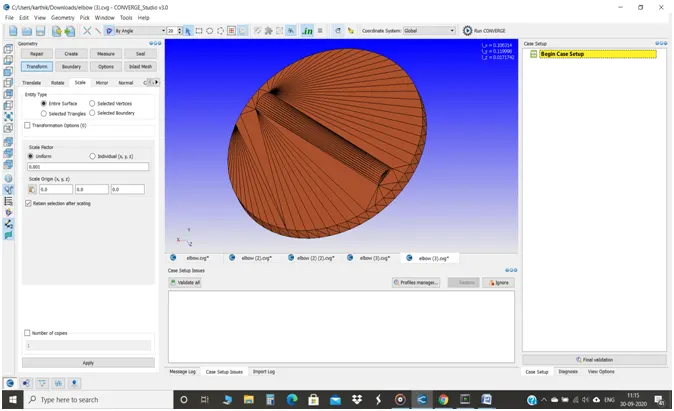
The throttle lever inside the geometry:
- The thickness of the geometry has been deleted since it is a normal Transient state simulation of a normal air flow and not a conjugate heat transfer simulation.
- The inlet and outlet of the pipe has been patched by Repair-->Patch-->Click Free edge loop-->Select the edge to be patched-->Ok.
- Make sure that all the normals have been oriented in the direction of flow that takes place.
- In the Diagnosis tab, click Find to check whether the geometry is perfect to simulate as the picture:
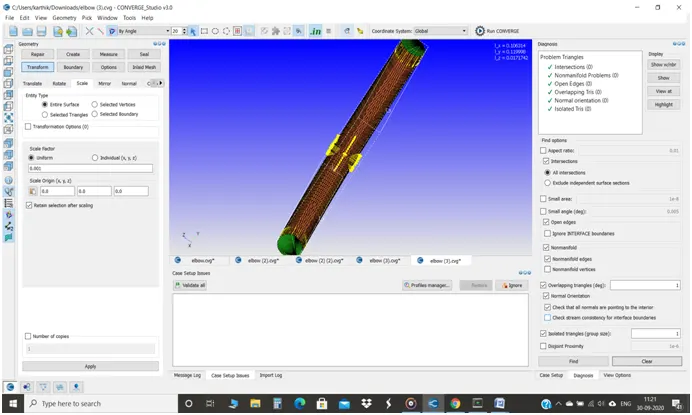
- The Boundaries that have flagged are Inlet, Outlet, Elbow wall and throttle.
- The Application type is Time-based.
- The pre-defined mixture is Air.
- In Run parameters, Transient solver is chosen, Time-Based type and the simulation mode is Full Hydrodynamic.
- Make sure to uncheck the shared memory flag and uncheck the steady state monitor too.
- In Boundary conditions, the boundary type of the Inlet as Inflow, Outlet as outflow, Throttle and Elbow as Wall
- At inlet, the pressure boundary condition is the specified value of 150000 Pa, the velocity as Neumann boundary condition and the Temperature as the specified value of 300K and the species as N2 of 0.77 and O2 of 0.23.
- At outlet, the pressure and temperature boundary condition as specified value of about 100000Pa and 300K and the species are N2 of 0.77 and O2 of 0.23.
- Both the throttle and the elbow boundary type as Wall with Law of Wall boundary condition since the turbulent flow of fluid gets involved.
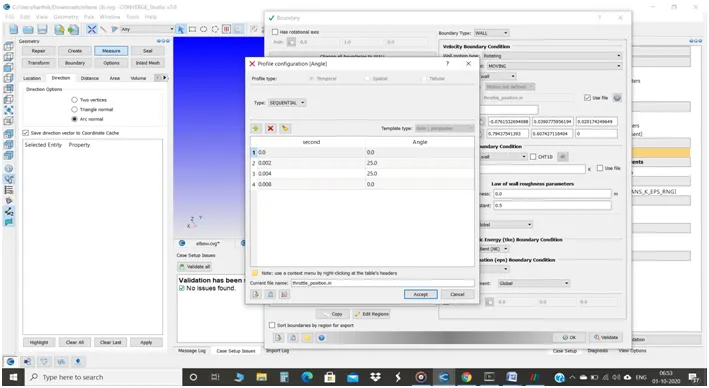
- In a Throttle boundary, in order to make the throttle to rotate, make the wall motion type as ROTATING and the surface movement as MOVING.
- To calculate the Rotation centre and Rotation axis of the Throttle to rotate, calculate the normal direction and centre point of the shaft of the throttle by Measure-->Direction-->Arc normal-->click any three vertices of the cylindrical face of the shaft-->Apply.
- The value of arc centre and arc normal has been copied and pasted from the message log as rotation centre and rotation axis because the direction of normal of the shaft of the throttle and the direction of the rotation axis and the rotation centre is same.
- For Rotation rate of the throttle, Use file and click + to add the constraints and at second 0, the angle is 0 and at 002 sec, the angle is 25deg, at 0.004 sec, the angle is 25 deg and at 0.008 sec, the angle is 0 and name the file as throttle_position.in since it’s an input file.
- Make sure that the Turbulent kinetic energy (tke) boundary condition is in Neumann boundary condition.
- The Region0 has been created by Regions and Initialization with the atmospheric pressure of 101325Pa and temperature as 300K and it’s been assigned to all the boundaries.
- In Simulation time parameters, the start time is 0 sec, the end time is 0096 sec.
- Calculation of End time of simulation:
The characteristic length of the given geometry is approximately taken as 0.2m.
The average velocity of the given geometry is 104m/s.
The Flow through time = characteristic length / average velocity.
The Flow through time = 0.2/104=0.001923sec.
And roughly, 5 times of it, eventually 0.0096 seconds.
- The initial and minimum time step is 1e-9 sec. and the maximum time step is 1 sec.
- In Turbulence Modelling, the RANS RNG k-epsilon model has been used.
- The base grid of 2e-03m and with the default base grid, the fixed embedding type has also been enabled since the gap between the throttle plate and the throttle body wall is small or in order to get possible finer results around the throttle since the variables like pressure and velocity will be varying widely.
- In fixed embedding, Click Add and Entity type as Boundary and Boundary ID as throttle in Permanent mode with a scale of 3 and embed layers of 2.
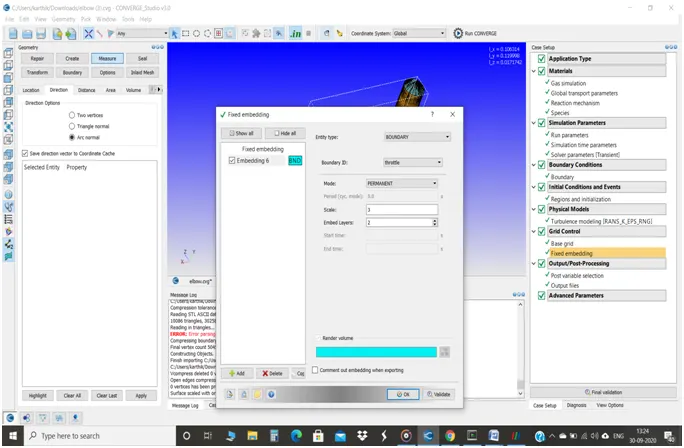
- It is also important to note that neither the base mesh size should be smaller nor the embedded mesh size should be larger or Vice versa.
- Specify the Mass fraction of N2 and O2 in Post variable selection in order to get a finer simulation results in PARAVIEW and the flow or presence of N2 and O2.
- In Output files, Time interval for writing 3D output data files, text output, restarting output is 0.00096sec.
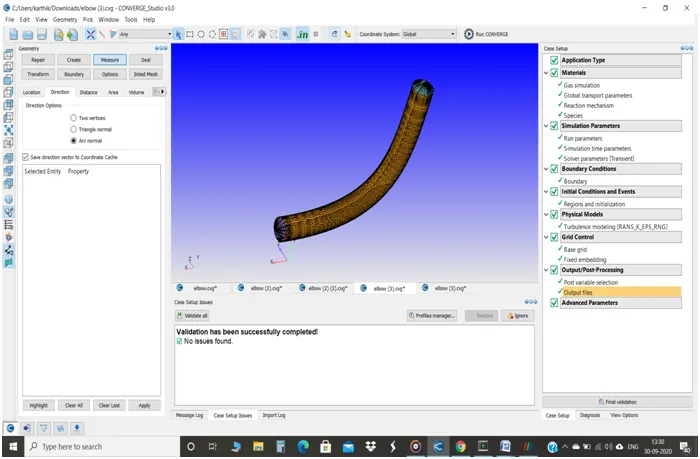
Simulation by CYGWIN:
- Once the case setup is ready, the input files has been exported to the particular location and the copy and paste the exe file in that location.
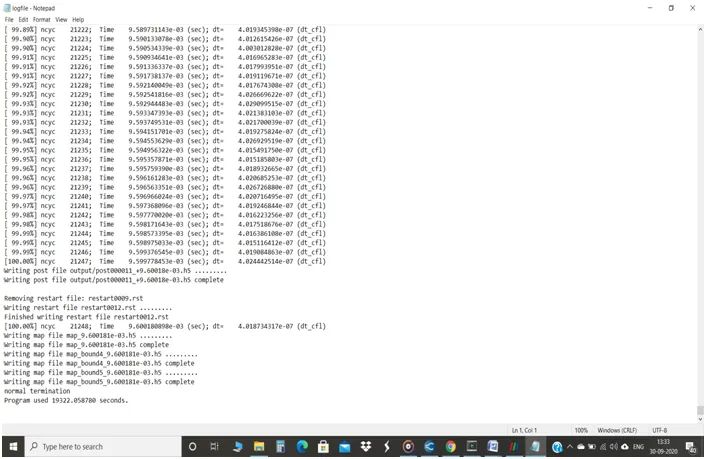
- Then, the input files have been simulated in CYGWIN and we can see the total time taken for the simulation is 19322 seconds and terminated at 21247 cycles.
Surface of the mesh:
Throttle body mesh:
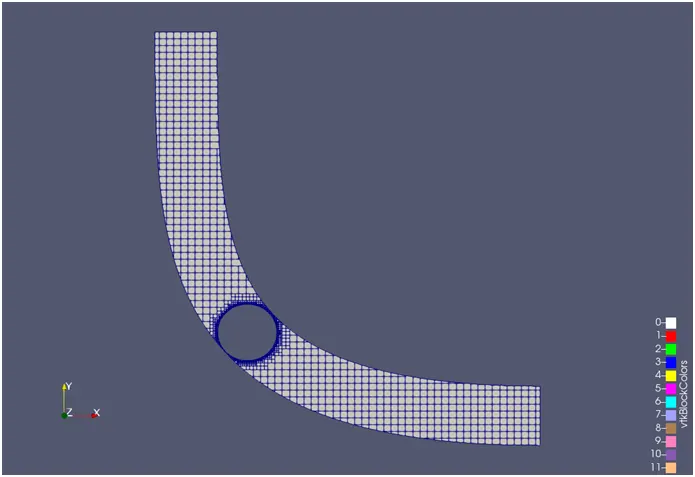
Throttle valve mesh at 0sec:
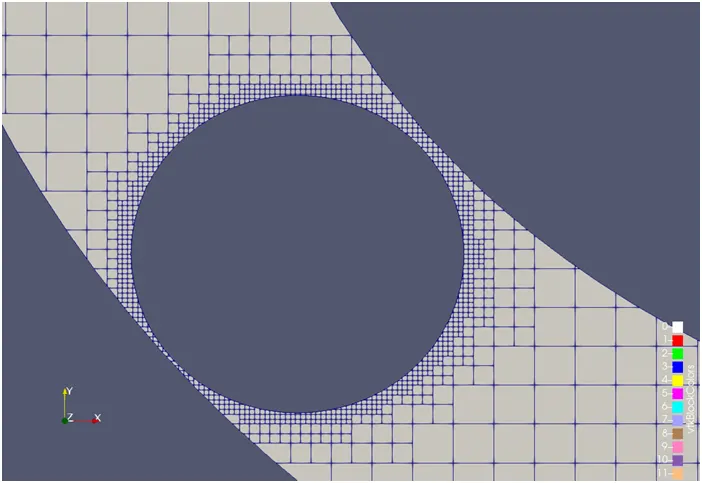
- The initial mesh with fixed embedding at time 0 sec.
Throttle mesh at 0-0.002-0.004 sec:
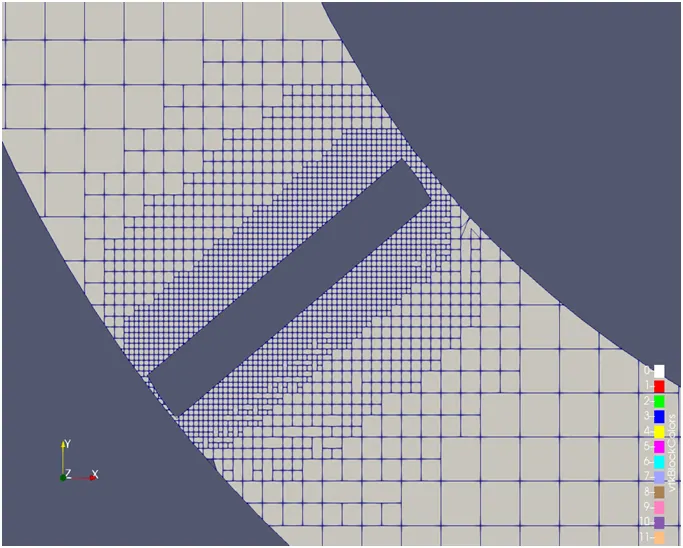
- It is the formation of mesh from 0-0.002sec since the throttle is rotating and it stays up to 004 sec and due to the given constraints, the mesh starts to deform to its original position after 0.004 sec, since the throttle valve is taking up its original position.
Throttle mesh at 0.008 sec:
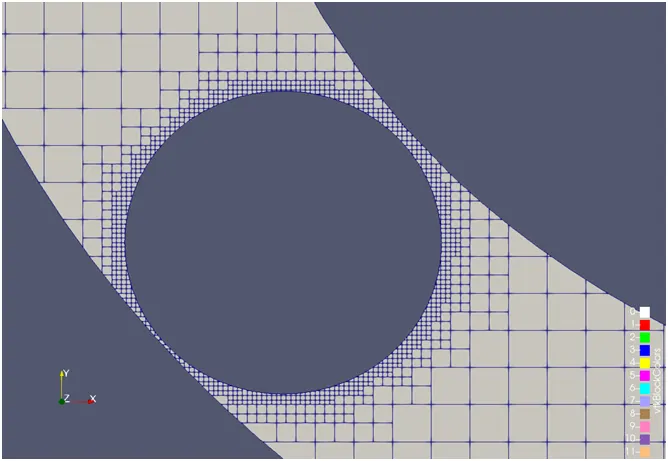
- The formation of mesh at 0.008 sec after which back to its original position.
- We can check only the mesh generation process by giving No hydrodynamic simulation mode.
Plots:
Velocity:
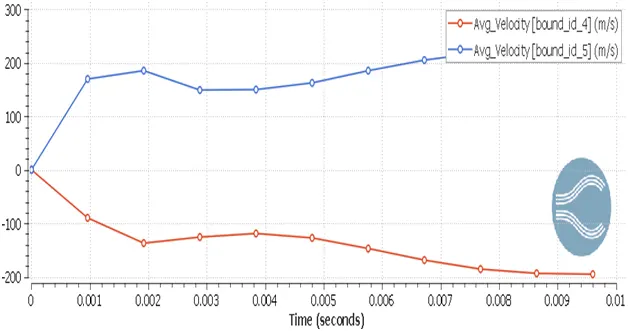
- From the graph, at both inlet and outlet, it starts increasing quiet good, but since the throttle plate continues to rotate at 0.001 sec, the velocity starts to decrease than before.
- After 0.002 sec, once the throttle plate is fixed it decreases faster than before 0.002 sec and up to 0.004 sec, the throttle stays at 25 deg.
- After that, once it begins to back to its original position within 0.008 sec, the velocity seems to increase gradually.
- And finally, the velocity at inlet is 195m/s and the velocity at outlet is 224m/s.
Pressure:
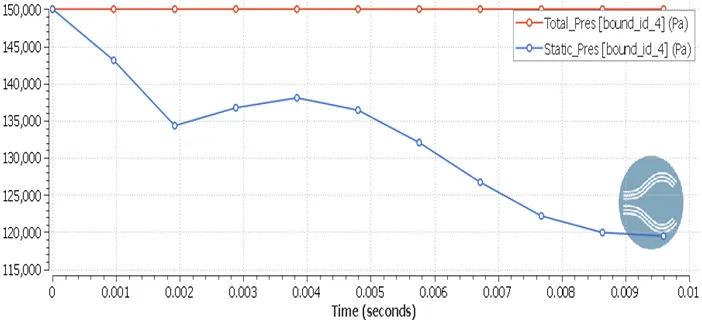
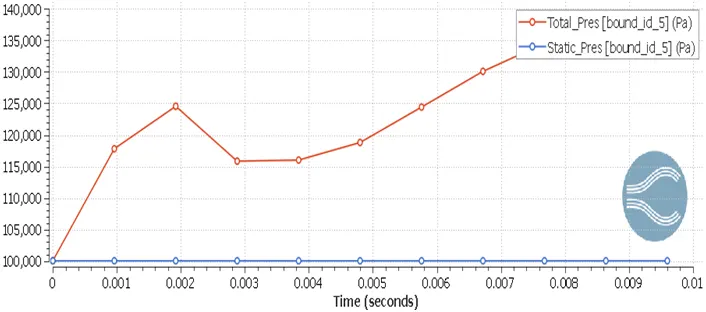
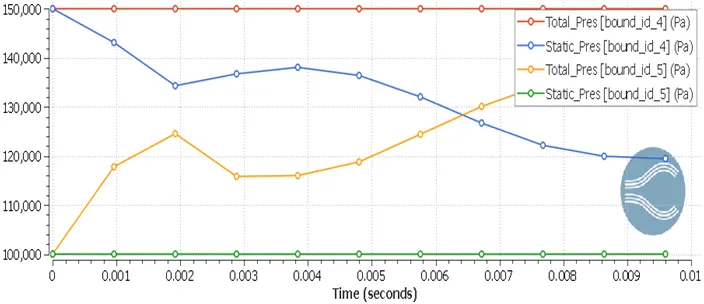
- At inlet, initially the static pressure is high at 150000Pa, as the cycles are going, the dynamic pressure(due to the opening of throttle valve) and velocity is increasing, simultaneously, the static pressure is decreasing up to 0.002 sec.
- Since the throttle plate is fixed at 25 degree angle from 0.002-0.004 seconds, it affects the static pressure to increase (about from 134000Pa to 138000Pa) and total pressure (static pressure + dynamic pressure) (from 124000Pa to 115000Pa) decrease at outlet.
- After 0.004 seconds, the throttle begins to move to its original position at an angle 0 degree in 0.008 seconds, so that the velocity and dynamic pressure begins to increase at outlet.
- Eventually, the total pressure at the outlet is 136605Pa and Static pressure at inlet is 119000Pa.
Mass Flow rate:
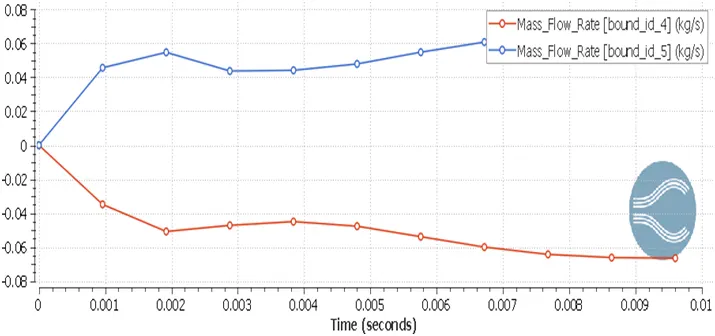
- Mass flow rate is defined as the mass of a substance which passes per unit time.
- It has to be noted that the structure of the plots of mass flow rate seems to be as same as the structure of velocity plots.
- From the plot, it seems to be that, from 0-0.002 secs the mass flow rate increases from 0-0.05 kg/s at both inlet and outlet.
- After the throttle valve has been fixed at 25 degree angle, the mass flow rate, at both the inlet and outlet, decreases to 0.04 kg/s.
- Then eventually, it again increases to 0.06kg/s due to the movement of the throttle to it’s original position.
Total cell counts:
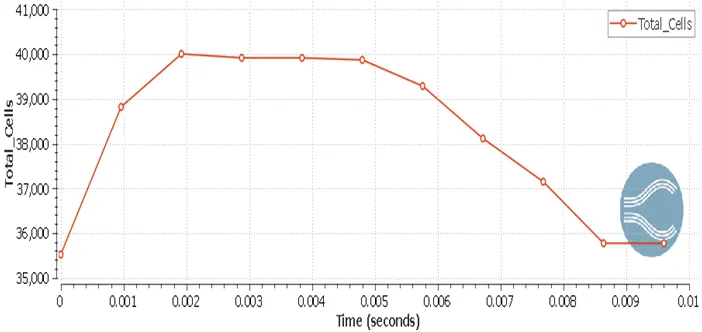
- From the time 0-0.002 seconds, the total cell count is from 35500-40000 cells due to the movement of the throttle from 0-25 degree angle.
- Then, the total cell count is about 40000 cells from 0.002 – 0.004 secs since the throttle valve is fixed in that time interval.
- Then the total cell count begins to decrease from 40000-35800 cells because of the throttle which moves to its original position.
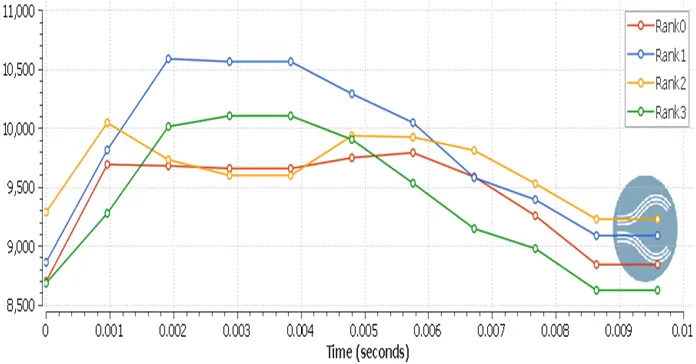
- This plot shows us that the total number of cells that has been taken by each individual four processors.
Fluid flow in Throttle body:
Velocity:
At Elbow wall:
From 0 – 0.002seconds:
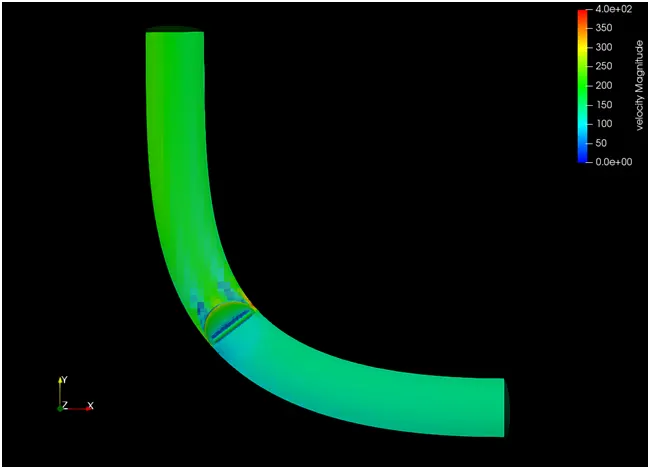
- At inlet, the velocity is low due to high static pressure and due to the little resistance of the throttle valve by turning 25 degree angle, it causes low velocity in inlet area of the throttle body.
- At outlet the velocity is higher than the inlet but the velocity at the outlet would have been reached the red region, if the throttle fully open.
At throttle:
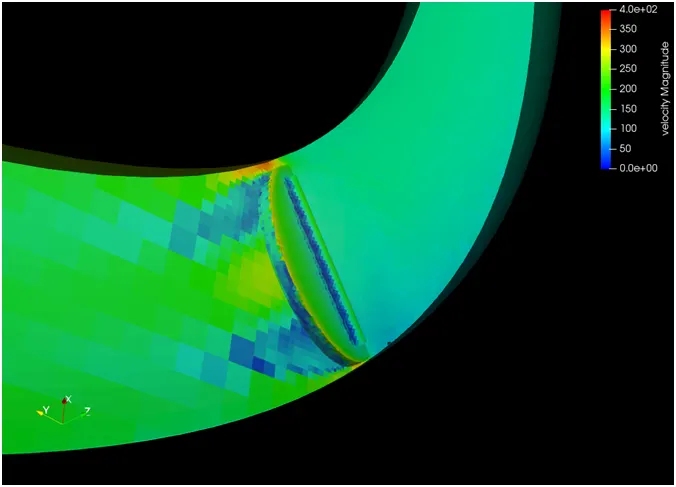
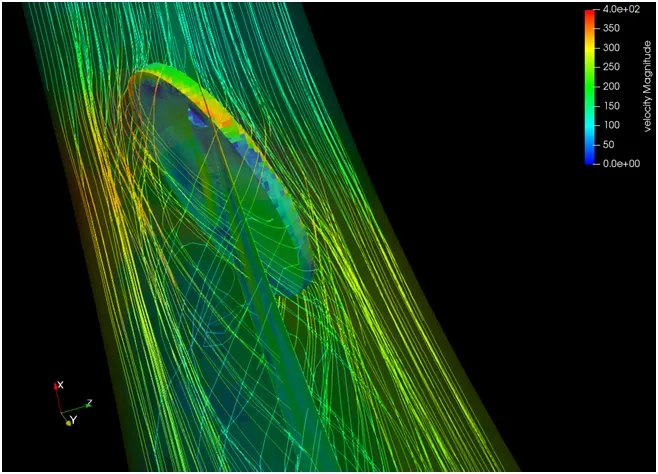
- From the time 0 - 0.002 seconds is the time interval in which the throttle begins to open for about 25 degrees.
- When it opens, near the edge of the both the sides of the throttle valve, the area becomes smaller. Since, the pressure is inversely proportional to velocity, the velocity becomes higher at the both sides of the throttle body and reaches between 300 – 400 m/s.
- It also happens at the top and bottom gap of the throttle valve in a very smaller area, since the gap has not been sealed to the throttle body.
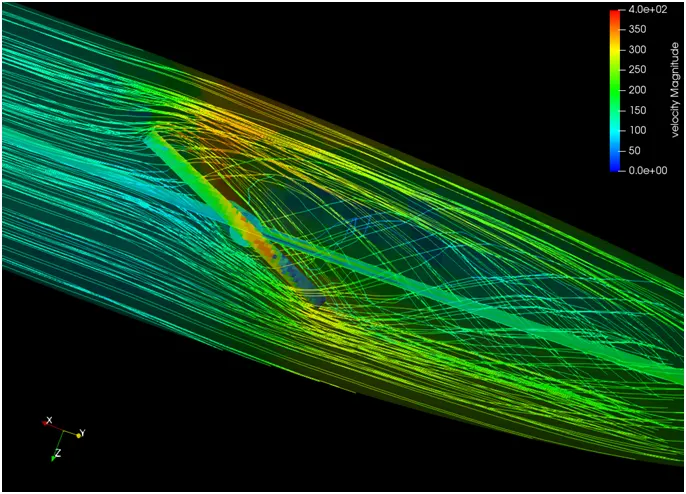
- In the top and bottom area of the throttle valve, the region of re-circulating flow has been created which known as the wake region.
- It is due to the flow of viscous air around the throttle plate surface. The medium is displaced once it leaves the surface of throttle shaft which results in turbulent eddies. This presence of eddies only make flow through the wake region.
- So, Lesser the restriction of the throttle shaft across the flow, lower is the loss of energy. This will increase the velocity at the outlet.
From 0.002 – 0.004 seconds:
At elbow wall:
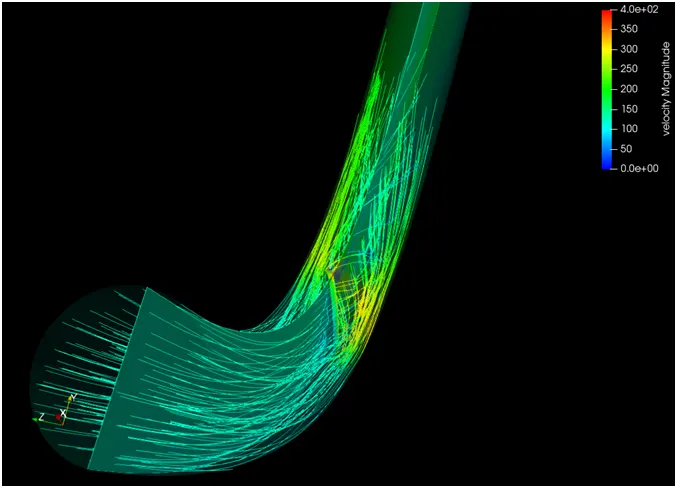
- From 0.002 – 0.004 seconds, since the throttle valve is fixed at 25 degree angle, the restriction for the flow of air is high.
- So that the distance reached by Re-circulation flow at the outlet is high than the previous case.
At throttle:
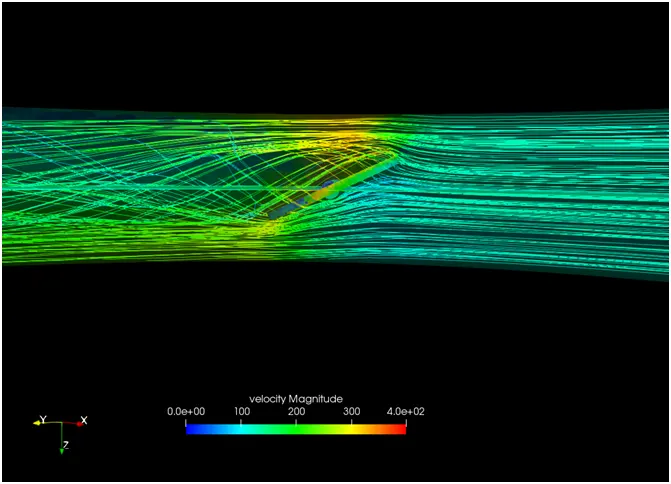
- As the time passes on, the velocity on the edges of the throttle is becoming low due to the increase in area of wake region and some of the high velocity flow on the edges of the valve detaches and become turbulent eddies.
- So that velocity at the outlet becomes low around 250m/s.
From 0.004 – 0.01seconds:
At elbow wall:
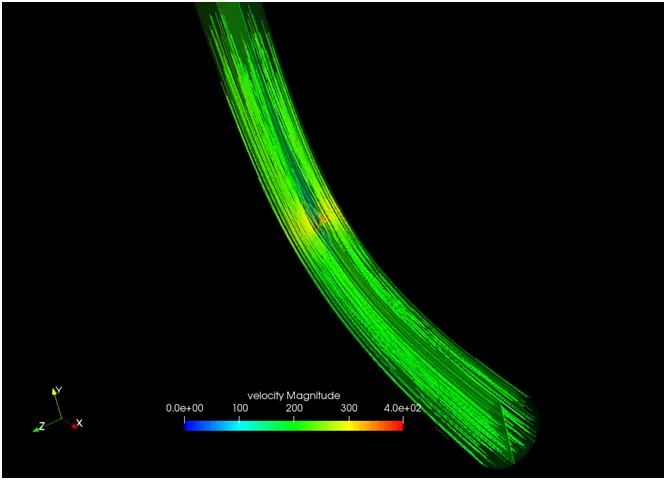
- Here, the inlet and outlet velocity is higher than the previous cases because of very less restriction created by the throttle valve.
- Therefore, high mass flow rate and velocity can be achieved at the outlet with less restriction by throttle valve.
- It can be used in case for the need of full acceleration of an engine.
At throttle:
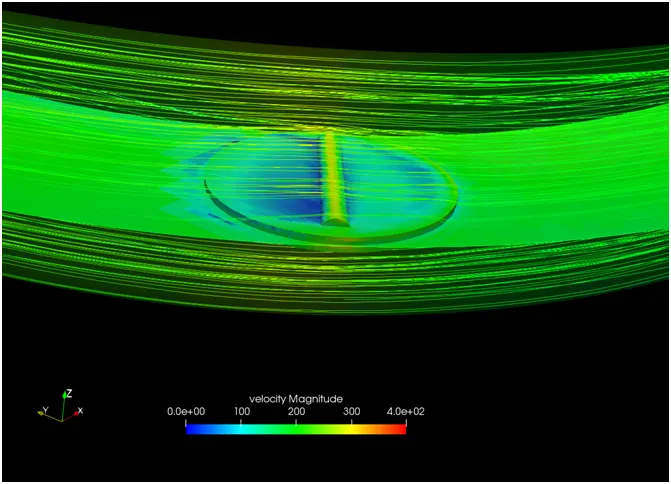
- Here the flow is divided by the throttle valve and it flows over the shaft of the throttle by creating high velocity there and low velocity over the throttle plate.
- And then maintains the average velocity at the outlet of the throttle body.
Pressure:
From 0 – 0.002 seconds:
At elbow:
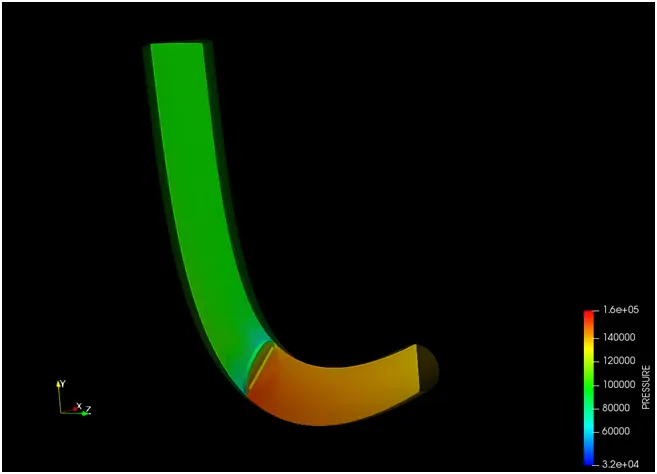
- At the inlet area, from 0- 0.002 secs, the inlet area of pressure is high due to the throttle opening of 25 degree angle.
- At the outlet, the pressure is quite low than the inlet.
At throttle:
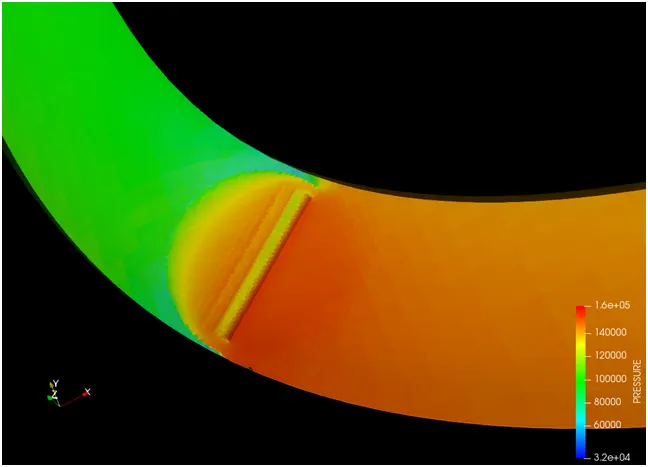
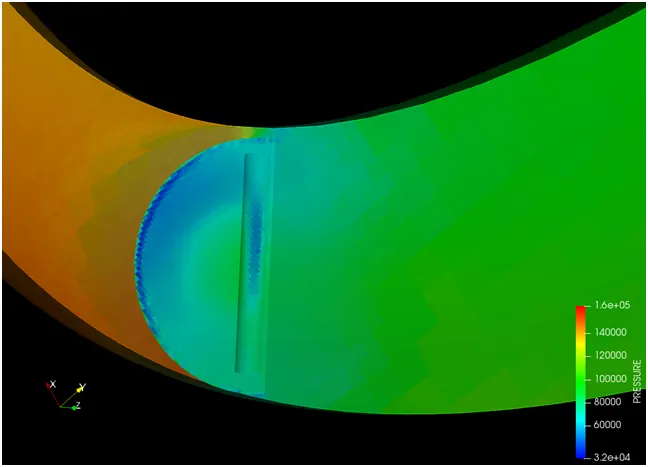
- At the inlet facing side of the throttle, the pressure quite high due to the strike of high pressure air of 150000Pa from the inlet.
- At the area of wake region, due to the turbulent eddies, the pressure is low at the area of the other side of the throttle.
From 0.002 – 0.004 seconds:
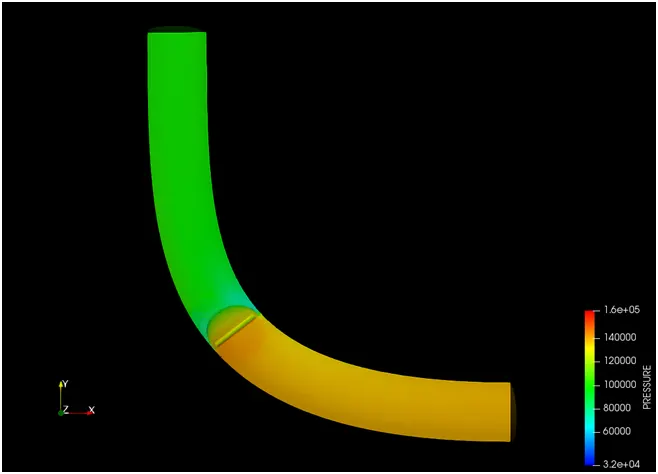
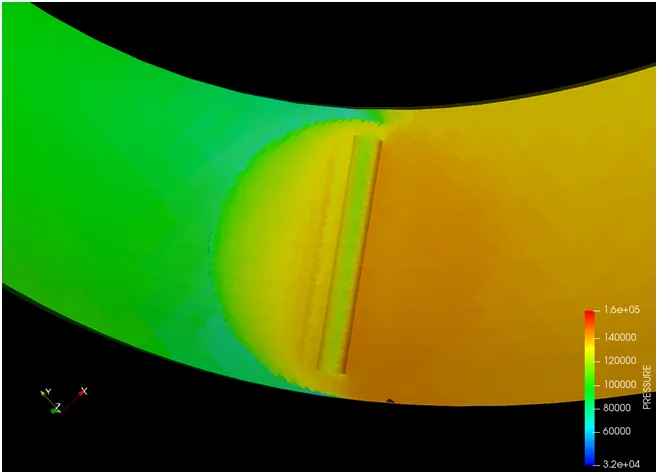
- At both the throttle body and throttle valve, the static pressure gets low than the previous case because of the dynamic pressure and velocity is increasing since the throttle plate is fixed at 25 degree angle.
From 0.004 – 0.01seconds:
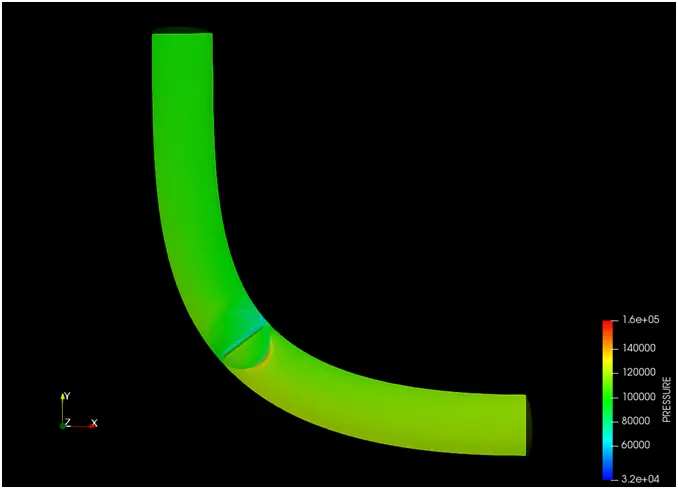
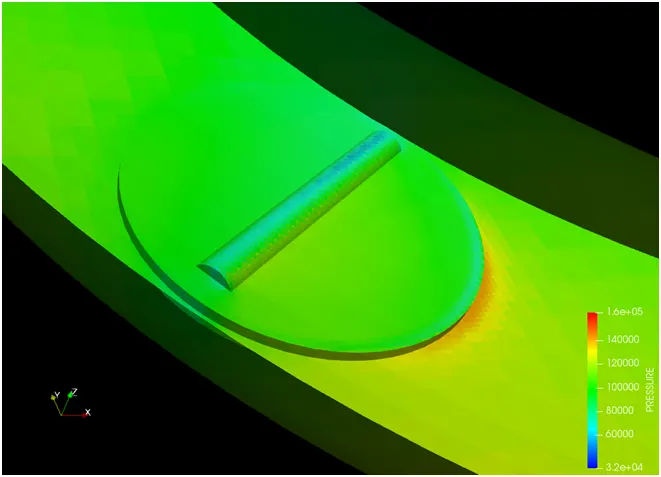
- Here, at both the inlet and outlet pressure of the throttle elbow is very low, lies between 80000 – 130000Pa.
- At the area of the throttle valve, the pressure at inlet edge of the throttle is high nearer to 140000Pa because of the strike of the inlet fluid pressure.
Conclusion:
- The pressure and velocity variation over different turning angle of throttle valve were analysed.
- From the analysis of air flow across throttle valve opened at different angle shows that the mass flow rate will be higher at high throttle opening angles and the wake region decreases as the throttle opening decreases.
- The plots of mass flow rate, pressure, velocity and total cell counts have been analysed.
Animation of Transient flow over a throttle body:
Velocity animation of throttle body: https://youtu.be/J9mQ1K_luC8
Velocity animation of Throttle valve: https://youtu.be/wVv_Vx6_0io
Pressure animation of throttle body: https://youtu.be/FcVkF_Glze4
Pressure animation of throttle valve: https://youtu.be/UGBkq3aPyy4