Project Steady state simulation of flow over a throttle body
AIM: Steady state simulation of flow over a throttle body using converge studio.
OBJECTIVE
- To perform Steady-state simulation of fluid flow over a throttle body.
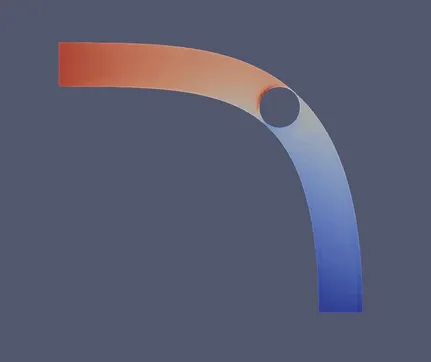
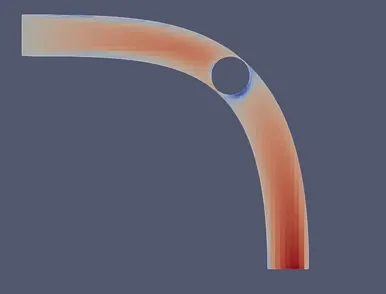
- To post-process results and show pressure and velocity contours for both the cases.
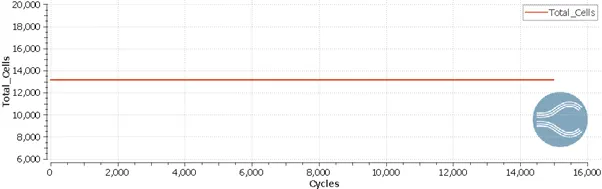
- To show the plots for pressure, velocity, mass flow rate and total cell count.
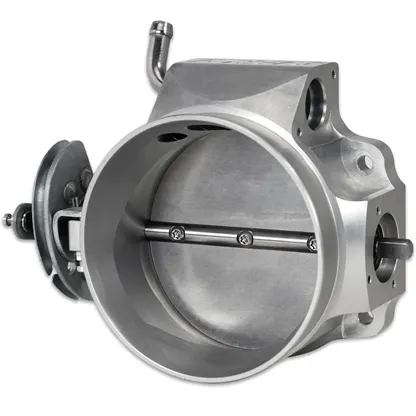
Throttle body
The throttle body is the part of the air intake system that controls the amount of air flowing into the engine, in response to driver accelerator pedal input in the main. The throttle body is usually located between the air filter, box and intake manifold, and it is usually attached to, or near, the mass airflow sensor.
Steady-state Simulation:
A steady-state simulation is used to investigate the steady-state behavior of a system, where the simulation continues until the system reaches a steady-state. Otherwise the simulation results can be significantly different from the true results.
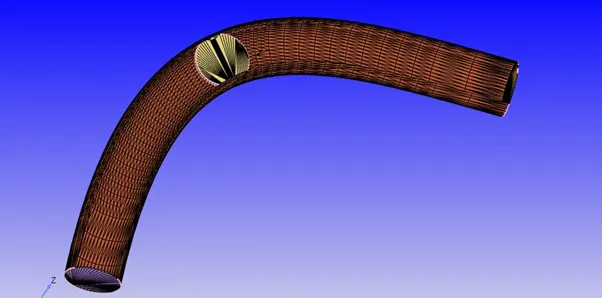
GEOMETRY
Dx=0.10(m)
Dy=0.11(m)
Dz=0.01(m)
Meshing
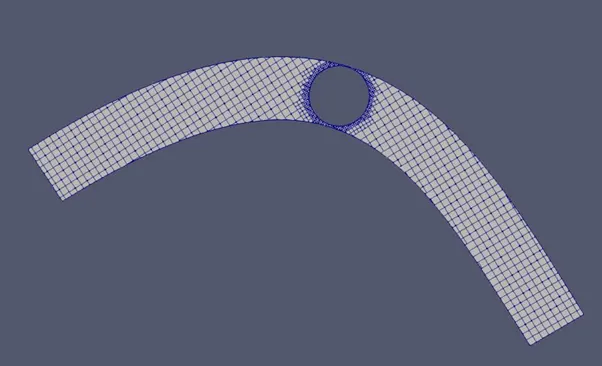
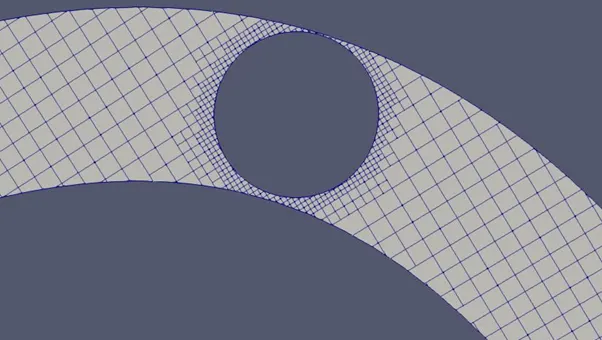
Converge CFD uses a cut-cell cartesian method. One of the most obvious benefits of the cut-cell Cartesian approach is the fact that you have a body-fitted mesh.
CASE SETUP
Case Set-up: General Flow
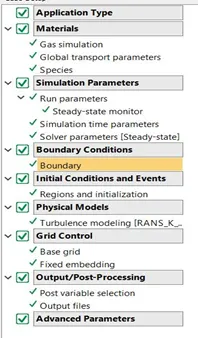
Materials:Predefined Mixtures: Air(Gas Simulation)
Simulation Parameters
Solver: Pressure-based steady solver
Mode: Full hydro dynamics
Start time: 0 cyclesEnd time: 15000 cycles
Initial time-step: 1e-9 s
Minimum time step: 1e-9 s
Maximum time step: 1.0 s
Regions and Initialization
Added Region (Air)
Pressure: 101325 Pa
Species: Air - O2 = 0.23, N2 = 0.77
Boundary Conditions
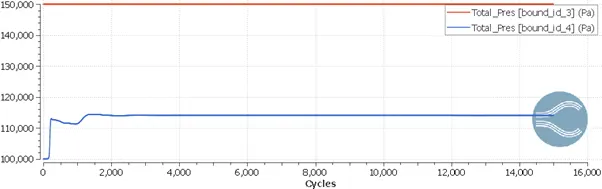
Inlet: Inflow 150000 Pa Air
Outlet: Outflow 101325 Pa Air
Throttle and Elbow wall: Wall
Velocity boundary conditions: Law of wall
Wall motion type: Stationary
Surface Movement: Fixed
Temperature boundary conditions: Law of wall (300K)
Base Grid:
Mesh in dx, dy and dz directions = 0.002
Fixed Embedding
Fixed embedding is used to refine the mesh around the desired regions. In this case, the regions of interest are the inner walls of the channel. Therefore, the fixed embedding is applied with a scale of 3 and 2 embedded layers.
Output files:
Time interval to write 3D output data files- 1000.0 cycles
RESULT
Pressure Contour
Velocity Contour
Plot 1.1: Total cell count
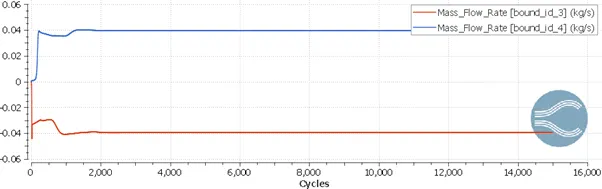
Plot 1.2: Mass flow rate at inlet and outlet
Plot 1.3: Pressure at inlet and outlet
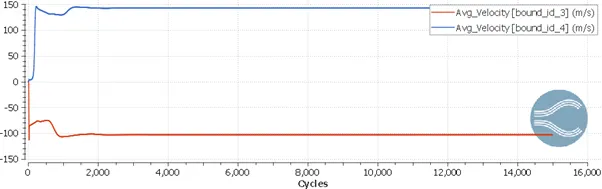
Plot 1.4: Velocity at inlet and outlet
Animation
1.Pressure flow : https://youtu.be/NA87fLd6pnM
2.Velocity flow: https://youtu.be/sPfJVSP3m1k
Conclusion
Steady state simulation of flow over a throttle body helps us to get an overview of how the flow profile varies over the given case. rom the above plot it observed that after some intial cycles the mass flow rate at inlet and the mass flow rate at outlet remains constant and achieves a steady state as it obeys the Law of Conservation. From the above plot it is observed that the average inlet velocity and average outlet velocity reaches a steady state around 2000 cycles and since the throttle is not rotating steady state is achieved easily.