Project 1 - Parsing NASA thermodynamic data
AIM
1.Writing a function that extracts the 14 coefficients and calculates the enthalpy, entropy and specific heats for all the species in the data file.
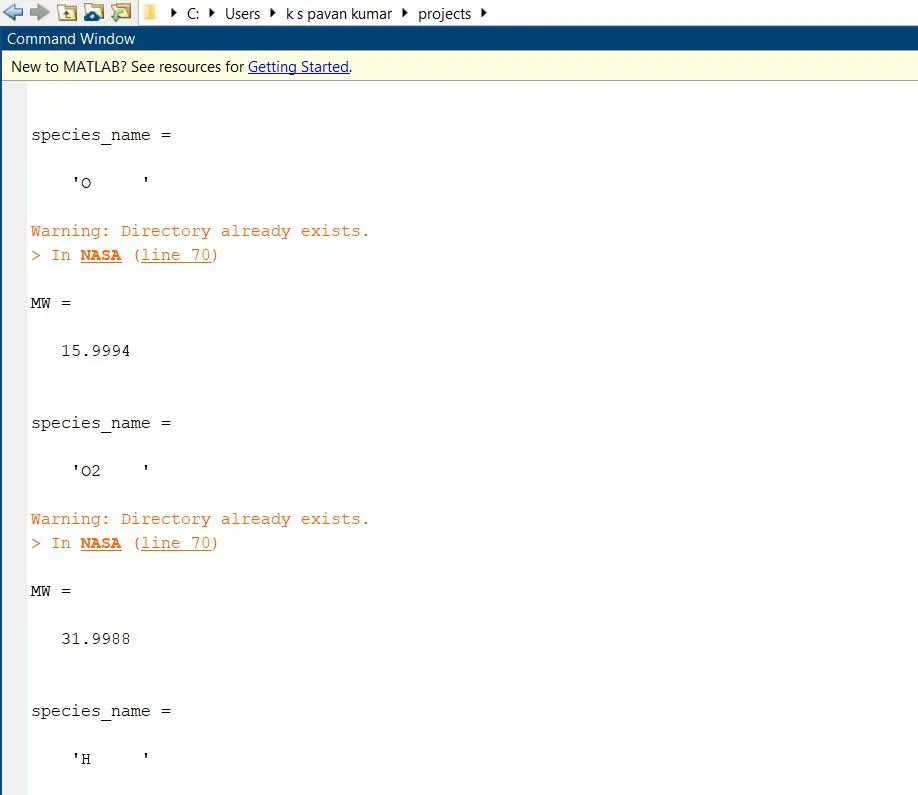
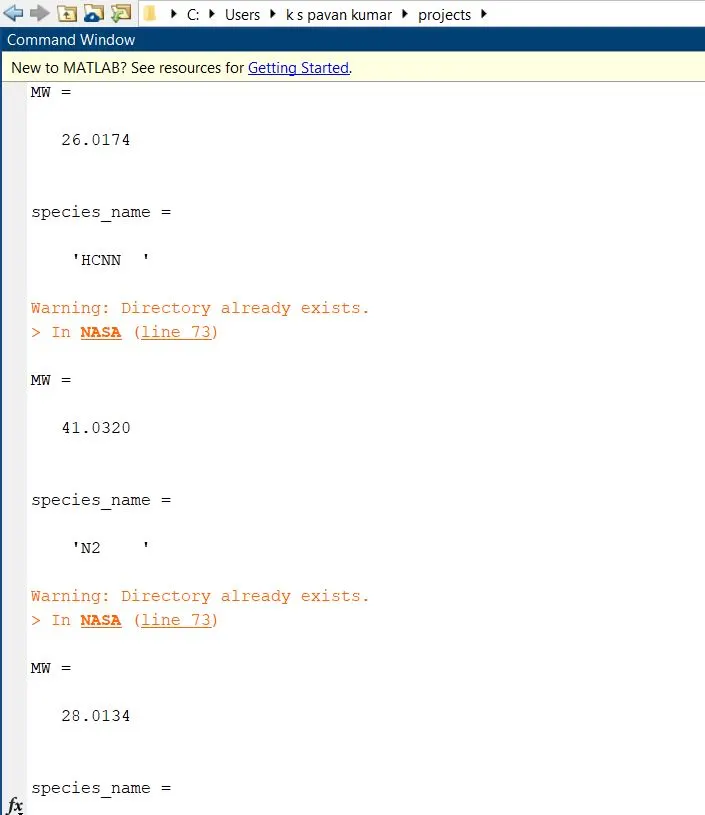
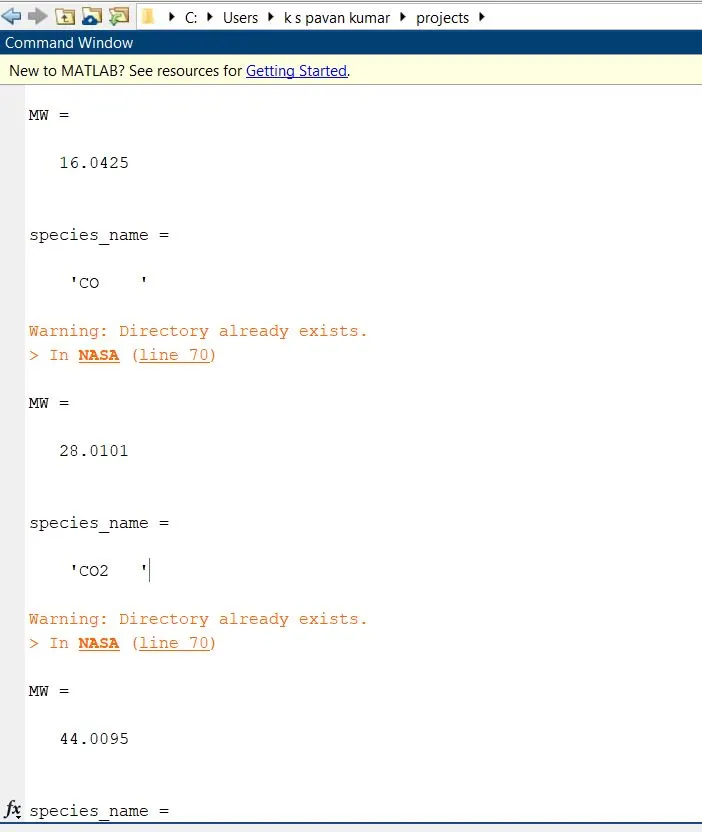
- Calculating the molecular weight of each species
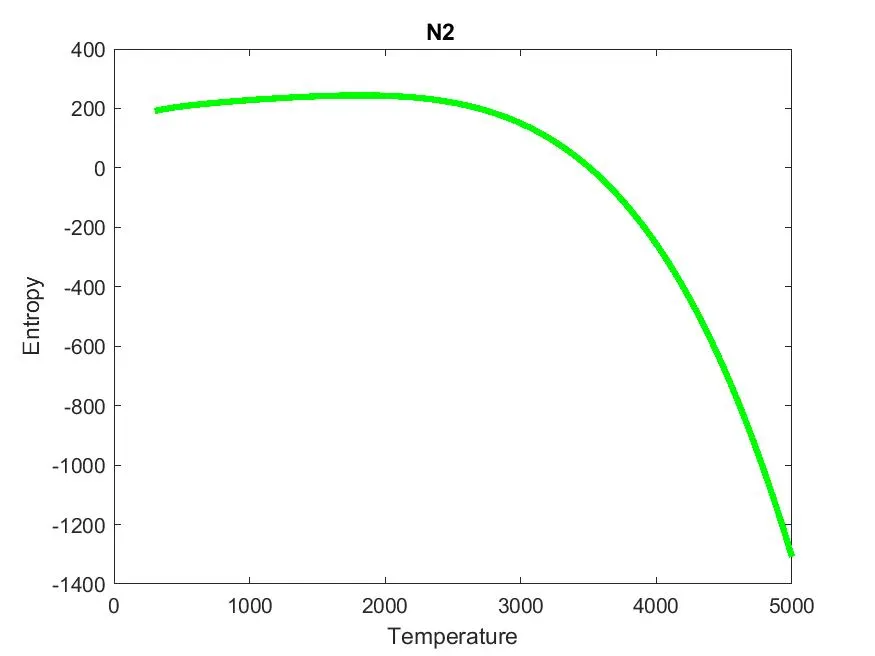
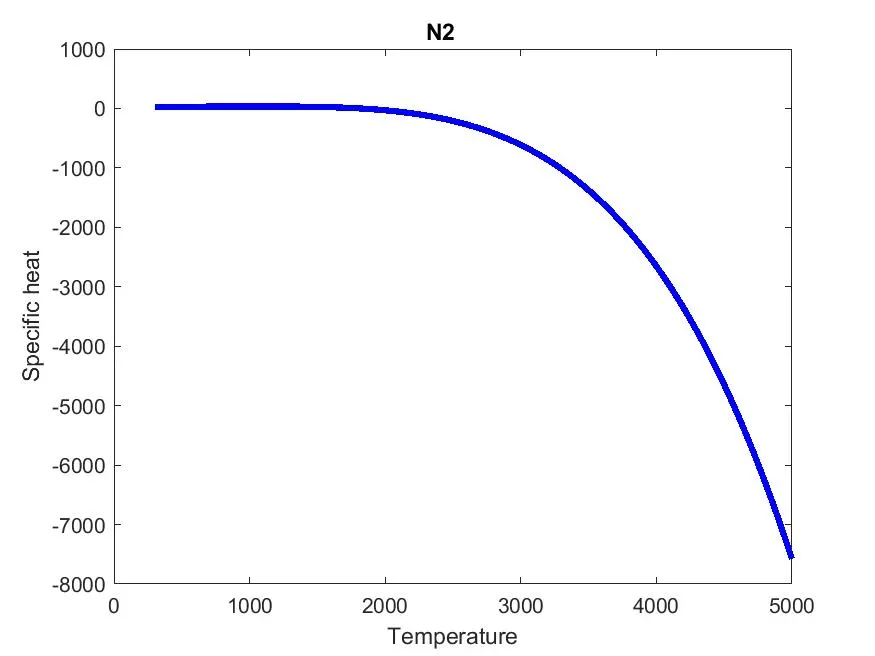
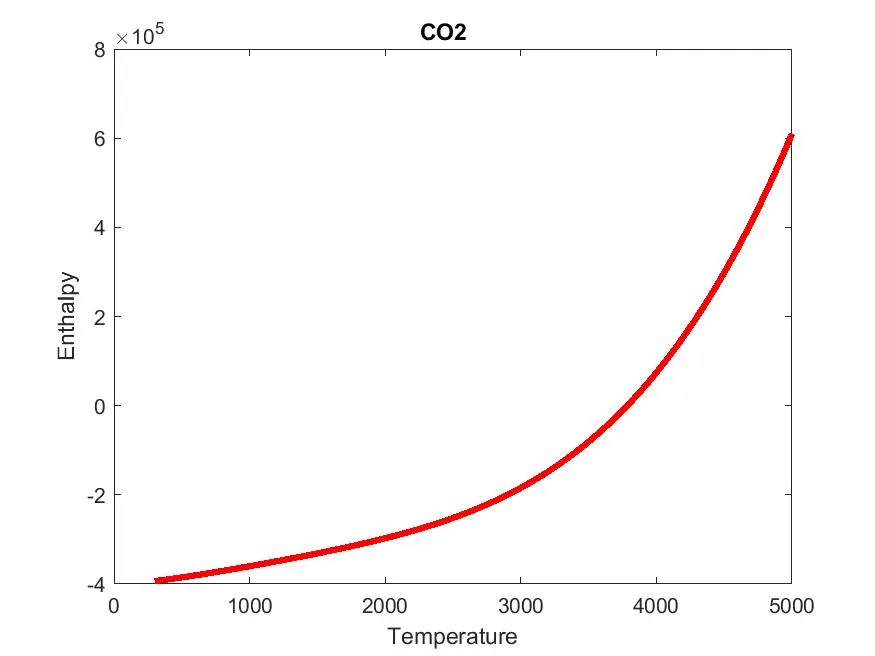
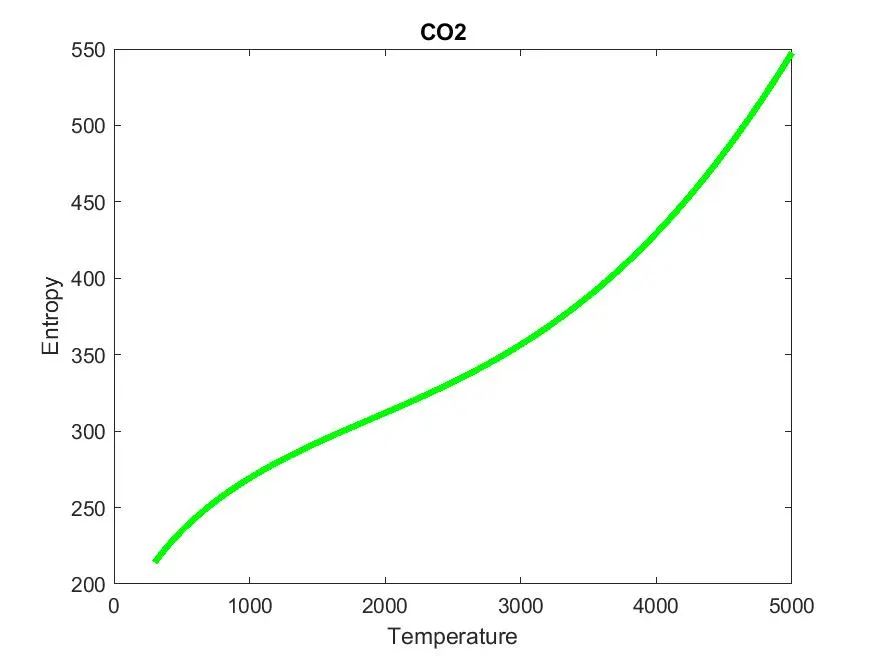
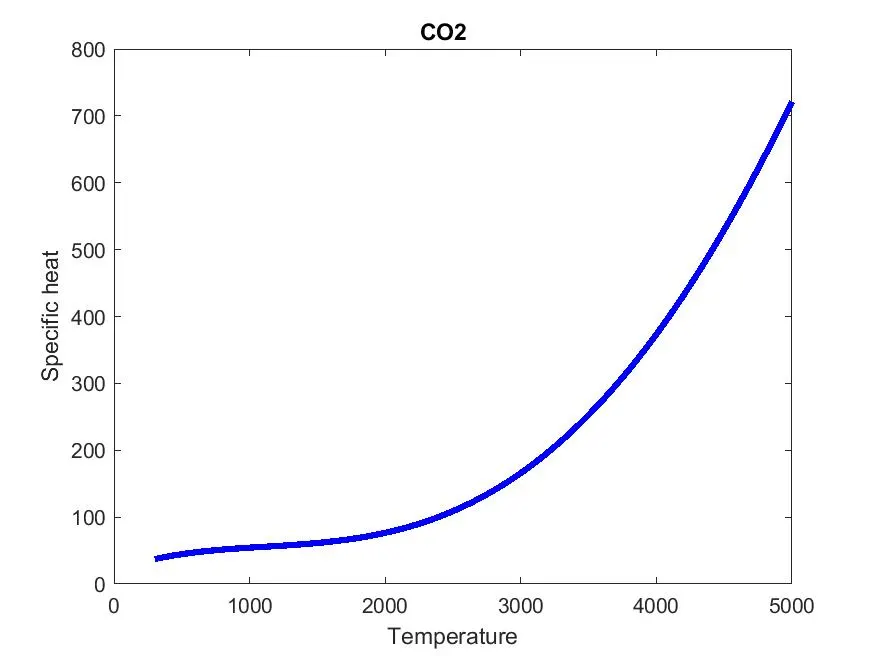
3.Plotting the Cp, Enthalpy and Entropy for the local temperature range.
Procedure
- The program uses the following commands 'fopen'command opens the thermodynamic data file [therm.dat]and stores it to a file Id called 'f1'.
- The second line indicates global temperature value stored in THERMO file
- The given temperature range is with 500 between lower and high temperature.
- In data file each species have 14 coefficients
- By using for loop each coefficients are calculated
- By using strfind() command, find out the number of exponential in first line, by which we can find out the number of coefficient in first line.
- Once you find out, then convert the coefficient from string form to number form by using str2num() command.
- By doing the above steps for line two and three, we can calculate the 14 coefficients for all the species.
- After finding the coefficients calculate the enthalpy, entropy and specific heat of the species.
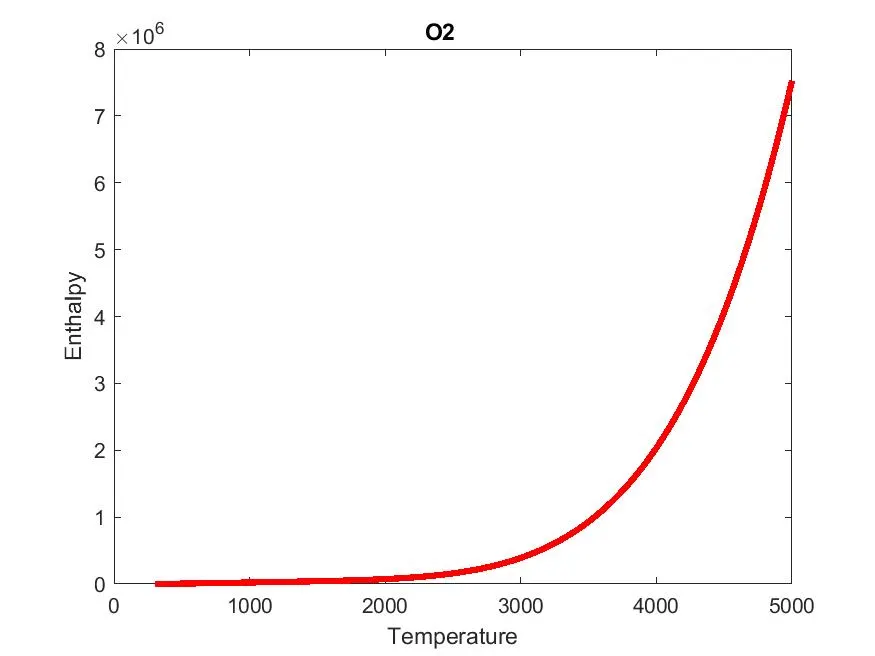
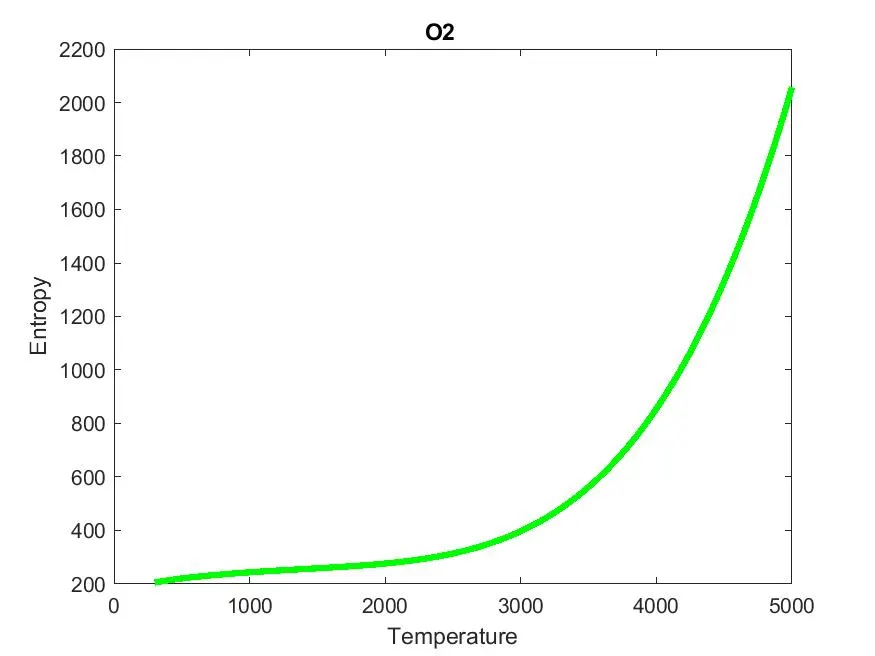
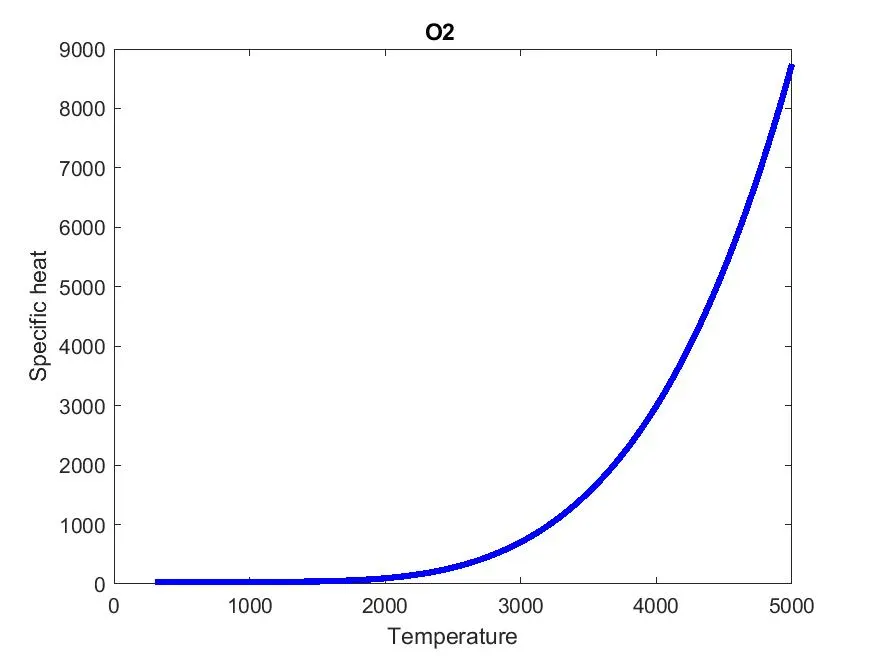
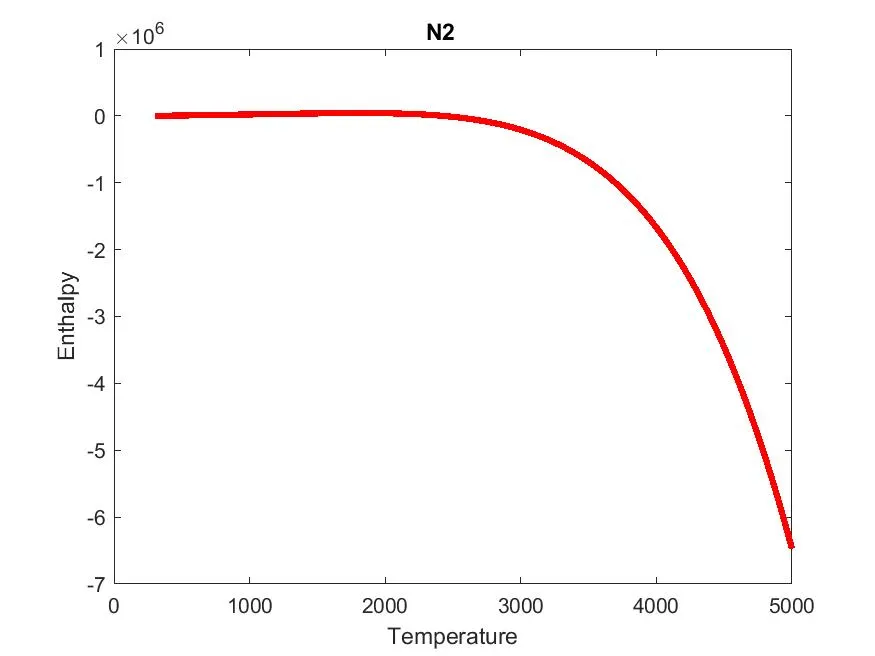
- Plot the graph of cp ,H ,S, with respect to temperature range.
- Store all the graphs in the specific folder
Formulae
Cp/R = a1+a2 T+a3 T^2+a4 T^3+a5 T^4
H/R = a1+a2 T/2+a3 T^2/3+a4 T^3/4+a5 T^4/5+a6/T
S/R=a1 ln+a2 T/2+a3 T^2/3+a4 T^3/4+a5 T^4/5+a7 T
Where,
Cp=specific heat[J/kg K]
H=enthalpy[J]
S=entropy[J/K]
MATLAB CODE
close all
clear all
clc
%rearing the thermo file
file = fopen('THERMO.dat','r')

%Universal gas constant value
R =8.314;

%header
line1 = fgetl(file)

%temperature values
line2 = fgetl(file)

%comments for obtaining file
des_1 = fgetl(file)
des_2 = fgetl(file)
des_3 = fgetl(file)
A = strsplit(line2,' ');
Global_low_temperature = str2num(A{2})
Global_mid_temperature = str2num(A{3})
Global_high_temperature = str2num(A{4})

%information fo the species
%using for loop
for i=1:53

    species= fgetl(file);
    species_name = species(1:6)

Line_1 = fgetl(file);

L1 = strfind(Line_1,'E');

c1 = str2num(Line_1(1:(L1(1)+3)));

c2 = str2num(Line_1((L1(1)+4):(L1(2)+3)));

c3 = str2num(Line_1((L1(2)+4):(L1(3)+3)));

c4 = str2num(Line_1((L1(3)+4):(L1(4)+3)));

c5 = str2num(Line_1((L1(4)+4):(L1(5)+3)));

Line_2 = fgetl(file);

L2 = strfind(Line_2,'E');

c6 = str2num(Line_2(1:(L2(1)+3)));

c7 = str2num(Line_2((L2(1)+4):(L2(2)+3)));

c8 = str2num(Line_2((L2(2)+4):(L2(3)+3)));

c9 = str2num(Line_2((L2(3)+4):(L2(4)+3)));

c10 = str2num(Line_2((L2(4)+4):(L2(5)+3)));

Line_3 = fgetl(file);

L3 = strfind(Line_3,'E');

c11 = str2num(Line_3(1:(L3(1)+3)));

c12 = str2num(Line_3((L3(1)+4):(L3(2)+3)));

c13 = str2num(Line_3((L3(2)+4):(L3(3)+3)));

c14 = str2num(Line_3((L3(3)+4):(L3(4)+3)));

%creating new folder for species
mkdir(['C:\Users\k s pavan kumar\projects\Species\',species_name]);

%Temperature ranges assumed
Temperature = linspace(300,5000,100);

%calculation of properties based on lower and higher temperatures
for j = 1:length(Temperature)
    if Temperature(j)<3000
Cp = (c1+c2.*Temperature+c3.*Temperature.^2+c4.*Temperature.^3+c5.*Temperature.^4).*R;
H = (c1+(c2.*Temperature)./2+(c3.*Temperature.^2)/3+(c4.*Temperature.^3)/4+(c5.*Temperature.^4/5)+c6./Temperature).*Temperature.*R;
S = (c1*log(Temperature)+c2.*Temperature+(c3.*Temperature.^2)/2+(c4.*Temperature.^3)/3+(c5.*Temperature.^4)/4+c7).*R;
    else
Cp = (c8+c9.*Temperature+c10.*Temperature.^2+c11.*Temperature.^3+c12.*Temperature.^4).*R;
H = (c8+(c9.*Temperature)/2+(c10.*Temperature.^2)/3+(c11.*Temperature.^3)/4+(c12.*Temperature.^4/5)+c13./Temperature).*Temperature.*R;
S = (c8.*log(Temperature)+c9.*Temperature+(c10.*Temperature.^2)/2+(c11.*Temperature.^3)/3+(c12.*Temperature.^4)/4+c14).*R;
    end
end

%plotting graph
%Temperature vs Entropy
figure(1)
plot(Temperature,S,'linewidth',3,'color','g')
title(species_name)
xlabel('Temperature')
ylabel('Entropy')

%Temperature vs Enthalpy
figure(2)
plot(Temperature,H,'linewidth',3,'color','r')
title(species_name)
xlabel('Temperature')
ylabel('Enthalpy')

%Temperature vs Specific heat
figure(3)
plot(Temperature,Cp,'linewidth',3,'color','b')
title(species_name)
xlabel('Temperature')
ylabel('Specific heat')

directory = (['C:\Users\k s pavan kumar\projects\Species\',species_name]);   %changing the filepath to save the plots
cd(directory)

%saving the plots

saveas(1,'Entropy.jpg');
saveas(2,'Enthalpy.jpg');
saveas(3,'Specific heat.jpg');

cd('C:\Users\k s pavan kumar\projects\')       %switching the directory back to read thermodat file for molecular mass calculation

MW = molecular_weight(species_name)

end

fclose(file)
Mlecular weight calculation
%function definig
function MW = molecular_weight(species_name)

species = upper(species_name);

Constituents = ['H', 'C', 'N', 'O', 'A'];

Atomic_weight = [1.00794 12.0107 14.0067 15.9994 39.948];

MW = 0; %initial

for i=1:length(species)
    for j=1:length(Constituents)
        if strcmp(species(i),Constituents(j))
           MW = MW + Atomic_weight(j);
           u = j;
        end
    end
    n = str2num(species(i));
    if n>1
        MW = MW + Atomic_weight(u)*(n-1);
    end
end
end
RESULT

ERRORS
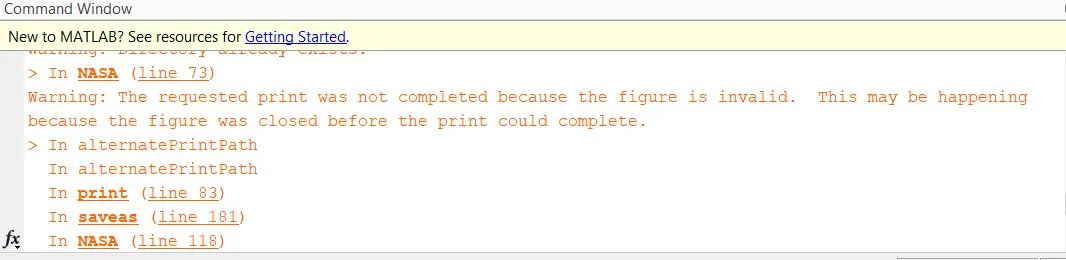
following error is occurred because the function name was 'molecular_weights' and the file name was 'molecular_weight'
so I corrected the function name as 'molecular_weight'.
References
https://www.mathworks.com/help/matlab/ref/fgetl.html
http://chemcollective.org/activities/tutorials/stoich/calculating_molecular_weight