Flow over a backward facing step
AIM: To simulate Flow over a backward facing step using converge studio.
INTRODUCTION
Backward-Facing Step (BFS) flow is one representative model for separation flows, which can be widely seen in aerodynamic flows (airfoil, spoiler, high attack angle process), engine flows, condensers, vehicles (cars, boat), heat transfer systems, and even the flow around buildings, etc. The flow separation after a simple stage will introduce separation bubble formation, evolution and re-attachment process, which is dependent on the BFS geometric design, the inlet and outlet conditions, turbulent intensity, as well as heat transfer conditions. In the past decades, it has been widely studied by various theoretical, experimental and numerical methods.
GEOMETRY
X= 0.27 metres
Y= 0.02 metres
Z= 0.025 metres
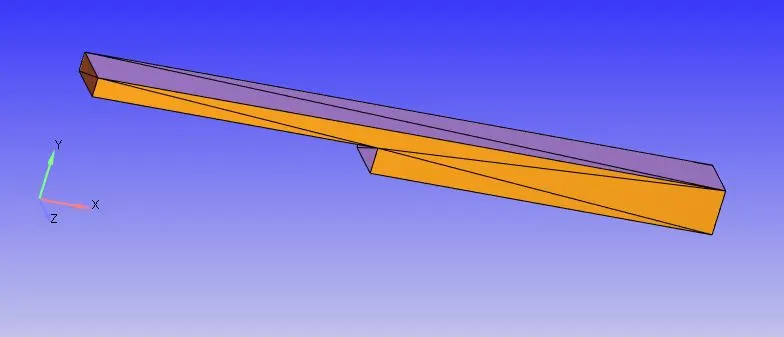
Simulation was carried out with different mesh sizes:
- dx= 2e-3 m, dy= 2e-3 m, dz= 2e-3 m
- dx= 1.5e-3 m, dy= 1.5e-3 m, dz= 1.5e-3 m
- dx= 1.2e-3 m, dy= 1.2e-3 m, dz= 1.2e-3m
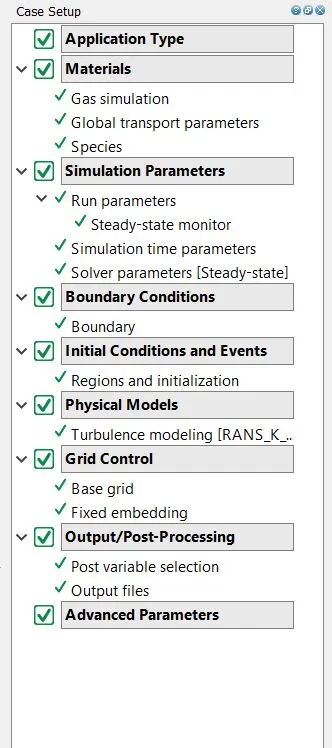
The process was carried out using converge studio software initially we create geometry using given dimensions then we do the case setup.
once we done the case setup we simulate it using cygwin.After simulation the post processing can be done either in cygwin or converge.
finally the post proceesing files will be accessed in paraview and the flow can be visualised.
CASE SETUP
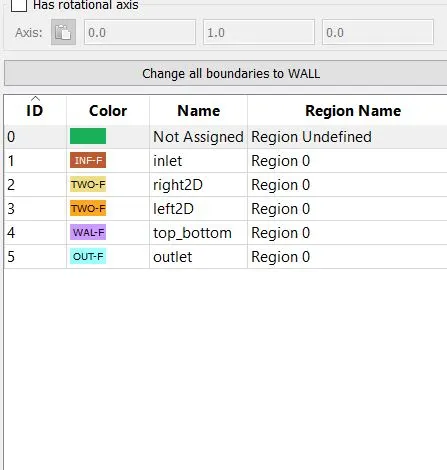
Simulation parameters
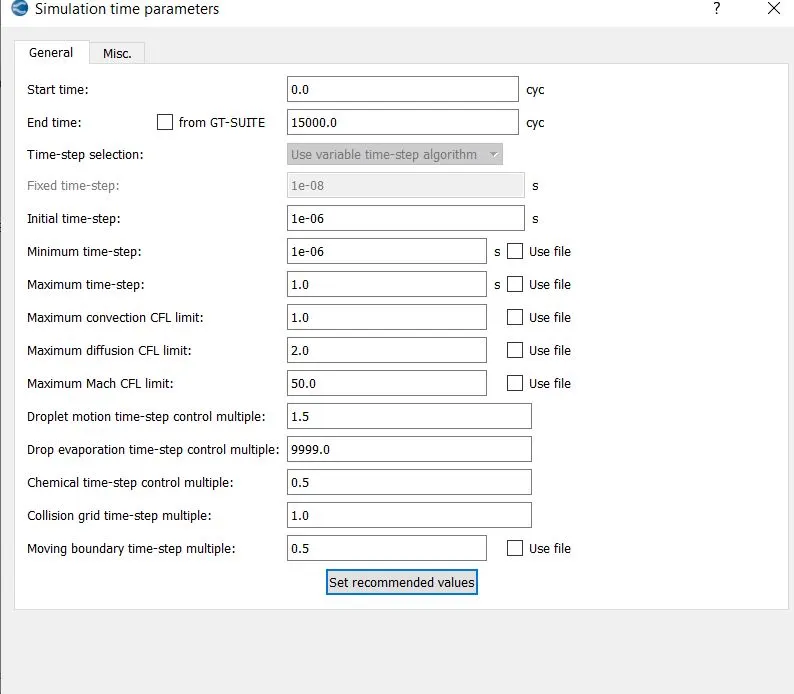
Final diagnosis
CASE 1
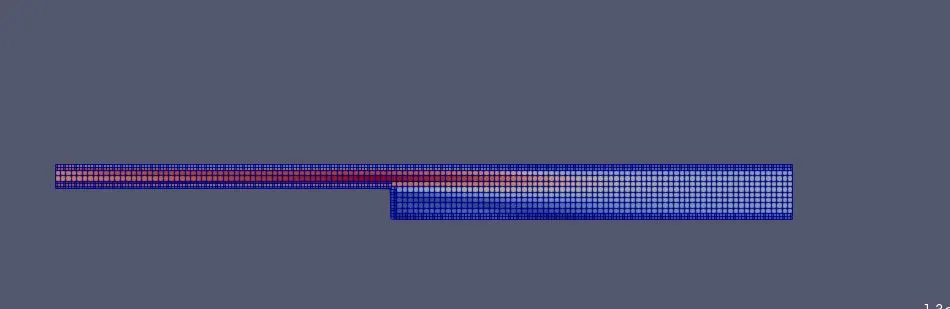
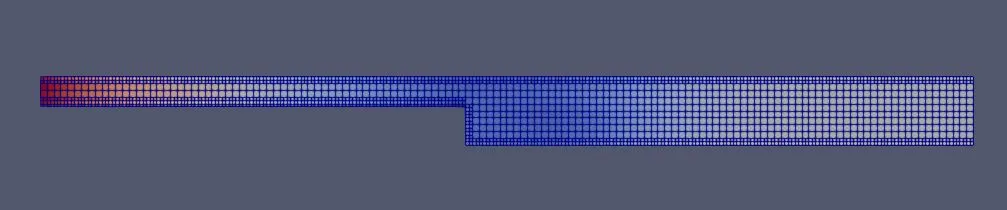
Mesh Size:dx= 2e-3 m, dy= 2e-3 m, dz= 2e-3 m
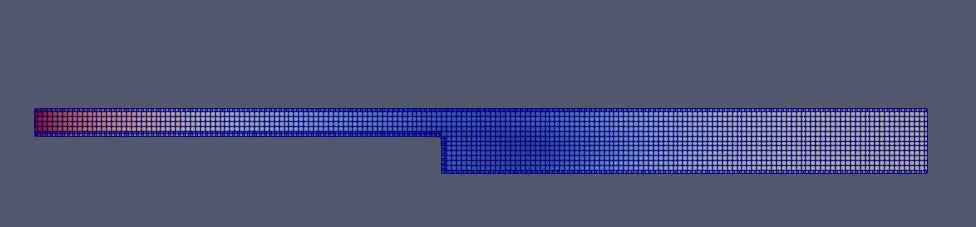
Mesh

Velocity Contour
Pressure Contour
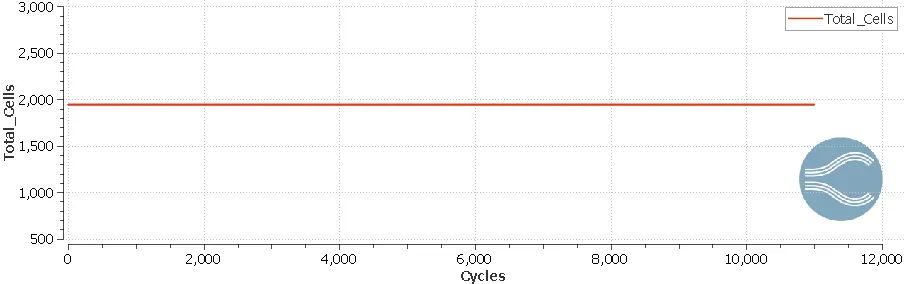
Plot 1.1: Cell count
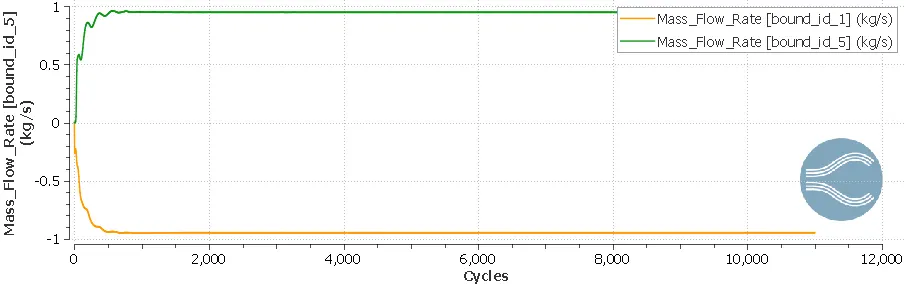
Plot 1.2: Mass flow rate at inlet and outlet
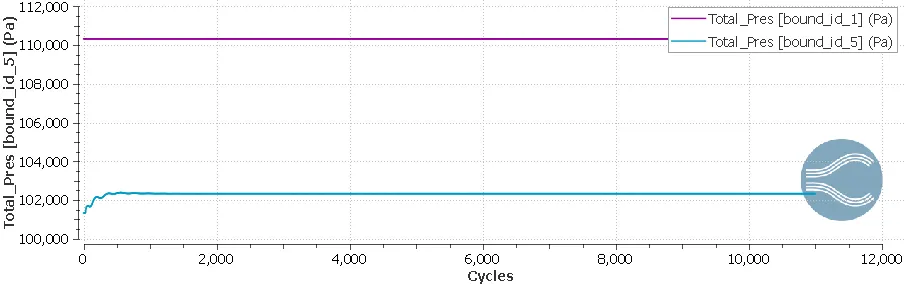
Plot 1.3: Pressure at inlet and outlet
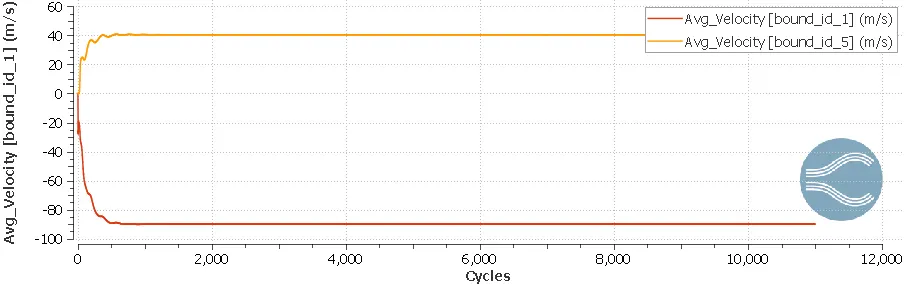
Plot 1.4:Velocity at inlet and outlet
Animated yotube link
1.velocity flow:https://youtu.be/Gz7Lvw1BTWs
2.Pressure flow:https://youtu.be/RdAE-tX83IU
CASE 2
Mesh Size:dx= 1.5e-3 m, dy= 1.5e-3 m, dz= 1.5e-3 m
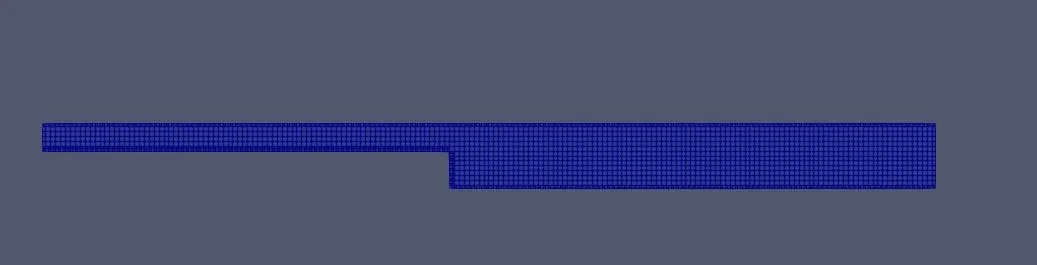
Velocity Contour
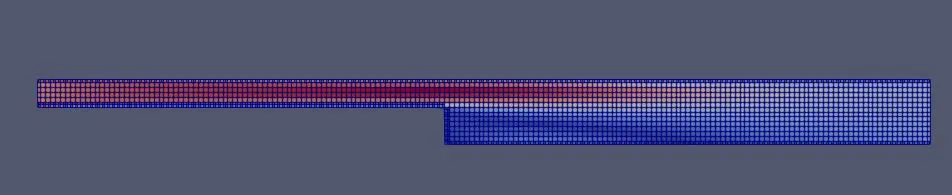
Pressure Contour
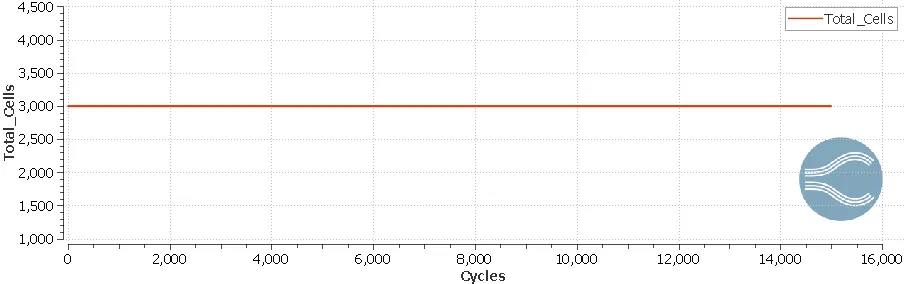
Plot 2.1:Total cell count
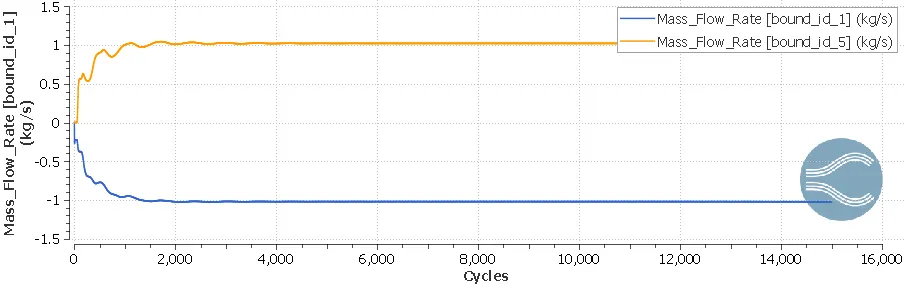
Plot 2.2:Mass flow rate at inlet and outlet
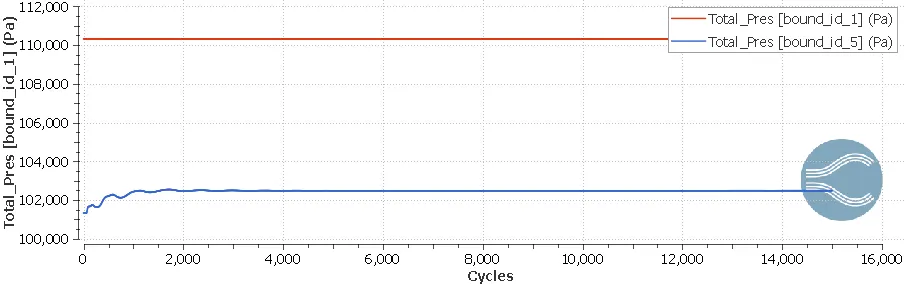
Plot 2.3:Pressure at inlet and outlet
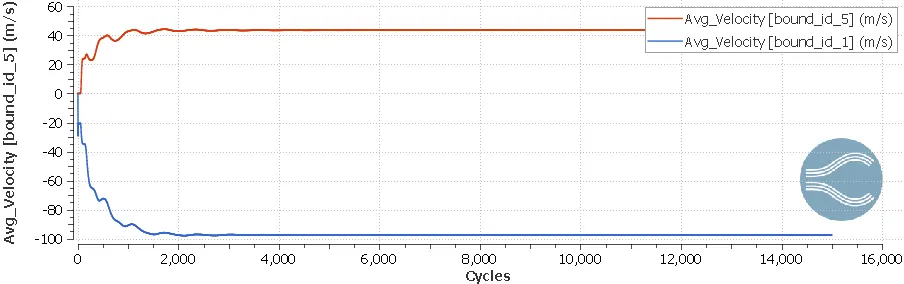
Plot 2.4:Velocity at inlet and outlet
Animated yotube link
1.Velocity flow:https://youtu.be/hmwI1CGLas4
2.Pressure flow:https://youtu.be/FV1rqVeBiq0
CASE 3
Mesh Size:dx= 1.2e-3 m, dy= 1.2e-3 m, dz= 1.2e-3 m
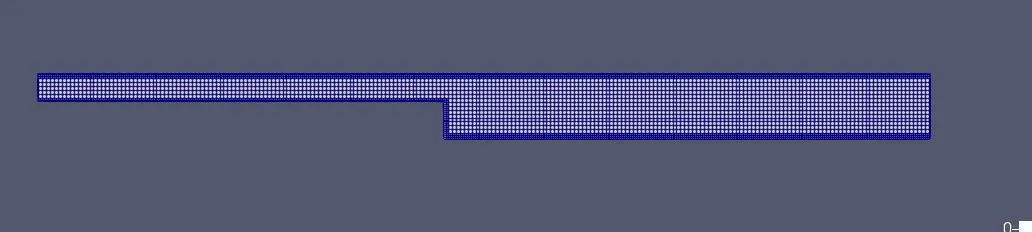
Velocity Contour
Pressure Contour
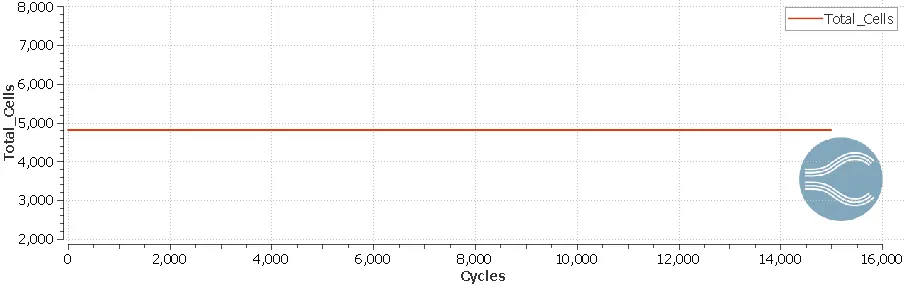
Plot 3.1:Total cell count
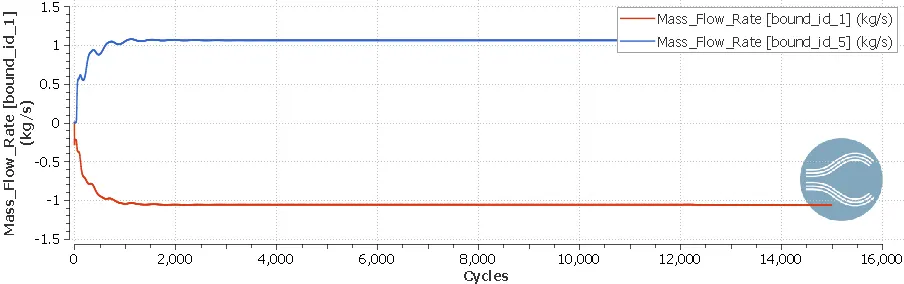
Plot 3.2:Mass flow rate at inlet and outlet
Plot 3.3:Pressure at inlet and outlet
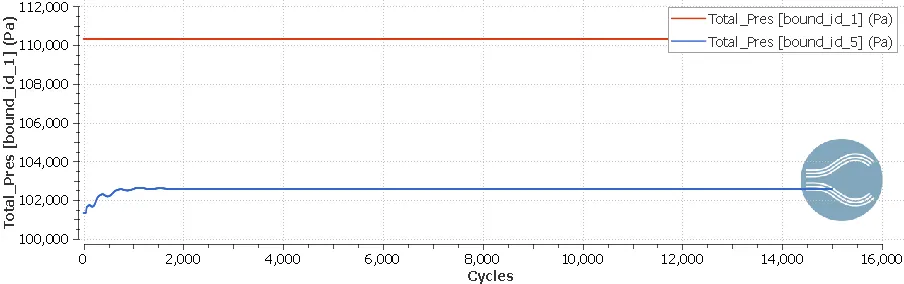
Plot 3.4:Velocity at inlet and outlet
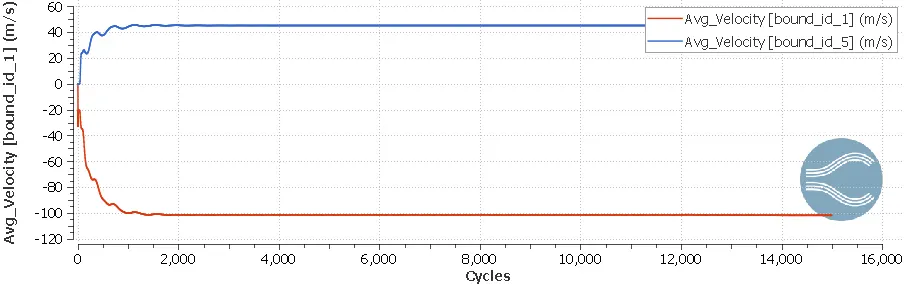
Animated yotube link
1.Velocity flow:https://youtu.be/nbklLl04U-o
2.Pressure flow:https://youtu.be/jX5CnITVSTQ
Flow separation
The area where separation takes place is at the step section(bottom). This happens due to the step shape , where the flow fails to attach and flows continues to take place along the path of the smaller section, leaving a wake region below it, where the flow becomes unstable.
Conclusions
- As the size of the grid is reduced, the total output cells increase with the geometry surface becoming more refined and detailed.
- The computational time got increased to an extent with refinement of mesh size from 2e-3 metres to 1.2e-3 metres