project -Rankine cycle Simulator
AIM - Create a Rankine cycle simulator using matlab
OBJECTIVE:-
Calculate each state point of the Rankine Cycle based on user inputs
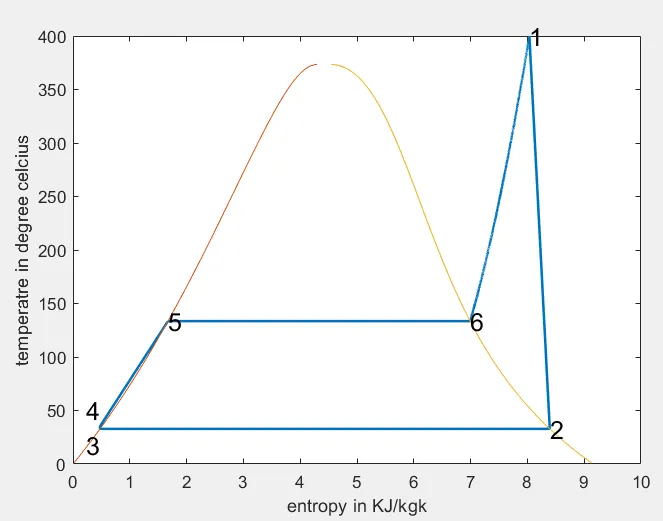
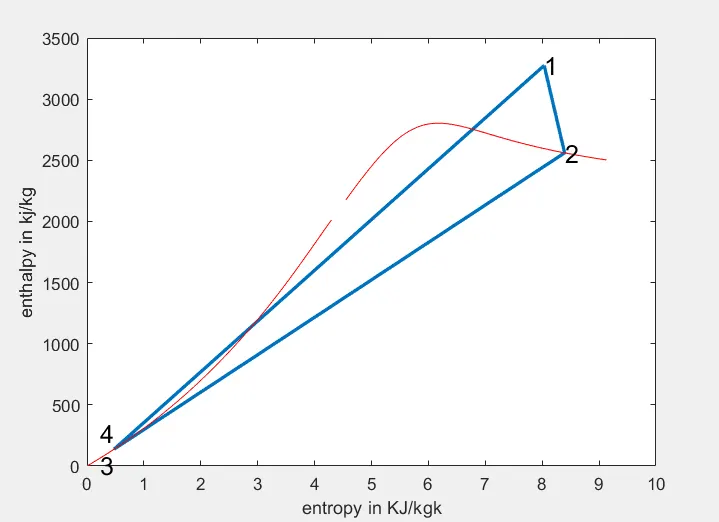
Plot the corresponding T-s and h-s plots for the given sets of inputs .
Calculate Efficiency
THEORY:
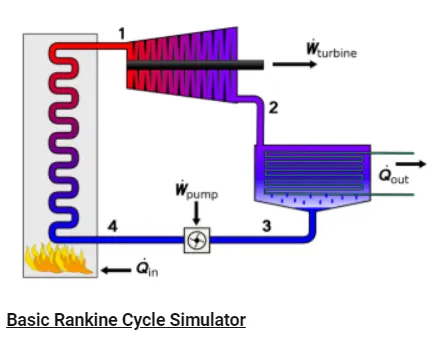
The Rankine cycle is the fundamental operating cycle of all power plants where an operating fluid is continuously evaporated and condensed .The selection of operating fluid depends mainly on the available temperature range. Figure 1 shows the idealize Rankine cycle .The Rankine cycle operates in the following steps .
1-2 Isentropic Expansion .The vapor is expanded in the turbine ,thus producing work which may be converted to elelctricity .In the practice ,the expansion is limited by the temperature of the cooling medium and by the erosion of the turbine blades by liquid entrainment in the vapor steams as the process moves further into into two-phase region .Exit vapor qualties should be greater than 90% to increase the life of turbine blade .
2-3 Isobaric Heat Rejection .The vapor -liquid mixture leaving the tubine (2) is condensed at low pressure ,usually in a surface condenser using cooling water .In well designed and maintained condesnser ,the pressure of the vapor is well below atomsperic pressure ,approaching the saturation pressure of the operating fluid at the cooling water temperature
3-4 Isentropic Compression .The pressure of the condensate is raised in the feed pump. Because of the low specific volume of liquids ,the pump work is relatively small and often neglected in the thermodynamic calculations.
4-1 Isobaric Heat Transfer .High pressure liquid enters the boiler from the feed pimp (4) and is heated to the saturation tempertaure .Further addition of the energy causes evaportaion of the liquid until it is fully converted to saturated steam (10.
1-2 Isentropic Expansion
Turbine (1-2) : Superheated steam entes into the Turbine and expands isentropically resulting resulting in the production of work . The shaft of the turbine is connected to the generator .This results in the production of electrivcty i.e Mechanical energy gets converted into electricity energy .Work produced by the turbine.
WT=M(h1-h2)K
2-3 : Constant pressure heat rejection
Condenser (2-3) : The expanded vapour is then passed through a condenser ,where it gets condensed and converts into liquid again. This liquid again pumped to the boiler .
Qr = m(h2-h3)K
3-4 :Isentropic compression by the pump
pump (3-4) : The water enters into the pump in saturated state . Then liquid is compressed isentropically until it meets the boiler pressure .Work done by the pump is
WP = m(h3-h4)K
4-1 :Constant pressure Heat addition
Boiler (4-1) : The water into the boiler as compressed and leaves the boiler as superheated from the boiler . Thus the phase change form the liquid to vapour. The heat supplied by the boiler is
Qb = m(h1-h4)K
Here we takes mass flow rate m = 1 for this code
The efficiency of the steam cell is given by
Efficiency = WnQ1 = WT-WPQ1
Applying the steady flow energy equation to all the process ,neglecting the friction lossses and changes in Kinetic and potential energy
Q1 = h1-h4 @boiler
Wt =h1 - h2 @turbine
Q2 = h2 - h3 @ condenser
Wp = h4 - h3 @pump
The capacity of the steam plant is often expressed interns of steam rate or specific steam consumption
S.S.C. = 3600 WnkgkWh
Required inputs
Turbine inlet temperature = 400 degree celcius
Turbine Inlet pressure = 30 bars
Turbine Outlet Pressure = 0.05 bars = Condenser Inlet Pressure .
MATLAB CODE
clear all
close all
clc

% print process description
fprintf('1-2 Isobaric heat transfer')
fprintf('2-3 Isentropic expansion')
fprintf('3-4 Isobaric heat rejection')
fprintf('4-1 Isentropic Compression ')

% step 1 : Enter Inputs
p1 = 3 %Enter the pressure at the turbine inlet(in bar)
T1 = 400 %Enter the temperature at the turbine inlet ( in degree celcius
p2 = 0.05 % Enter the pressure at the condenser (in bar)
% input values

% step -2 calculate each state point values
% state point 1
h1 = XSteam('h_pt',p1,T1);
s1 = XSteam('s_pt',p1,T1);

% step 3 state point 2
s2=s1
sf2= XSteam ('sL_p',p2);
sg2 = XSteam('sV_p',p2);
hf2 = XSteam('hL_p',p2);
hg2 =XSteam('hV_p',p2);  % x2 = (s2 -sf2)/(sg2-sf2);
s2 = sg2;
h2 = hg2;         % hf2 +(x2*(hg2-hf2));
T2 = XSteam('T_hs',h2,s2);

% step 4
T3=T2;
p3 =p2;
s3 = XSteam('sl_T',T3);
h3 = XSteam('hl_T',T3);
v3 = XSteam('vl_p',p2);

% step 5 : state point 4
p4 = p1
s4 = s3
Cp4 = XSteam('Cp_ps',p4,s4);
Cv4 =XSteam('Cv_ps',p4,s4);
gamma = Cp4/Cv4;
r = (gamma-1)/gamma;
T4 = T3*(p4/p3)^r;

% step 6 Calculate the other outpit values
Wt = h1 - h2 ;  %Turbine Work
Wp = v3*(p1-p2)*100;  %pump work
h4 = Wp +h3 ;
W_net = Wt-Wp  % net Work unit in Kj/kg
Qs = h1-h4 ; %heat supplied
N_per = (W_net/Qs)*100  ;  % efficiency
steam_rate = 3600/(Wt -Wp ); % steam rate per second
BWR = (h1-h4)/(h2-h3);

% step 7 :state point 5 and 6 which help in plotting
T5 = XSteam ('Tsat_p',p1);
T6 =T5 ;
s5 = XSteam('sL_p',p1);
s6 = XSteam('sV_p',p1);
h5 = XSteam('hL_p',p1);
h6 = XSteam('hV_p',p1);

% step 8 : print all state point values to show .
fprintf('n ------------------RESULT------------n')
fprintf('At State point 1:nP1 is  : %4 2f BarnT1 is: %4.2f Degree CelciusnH1 is : %4.2f KJ/KGnS1 is : %4.2f KJ/kgknn',p1,T1,h1,s1)
fprintf('At state point 2:nP2 is :%4.2f BarnT2 is: %4.2f Degree CelciusnH2 is : %4.2f KJ/KGnS2 is : %4.2f KJ/kgknn',p2,T2,h2,s2)
fprintf('At state point 3:nP3 is :%4.2f BarnT3 is: %4.2f Degree CelciusnH3 is : %4.2f KJ/KGnS2 is : %4.2f KJ/kgknn',p3,T3,h3,s3)
fprintf('At state point 4:nP3 is :%4.2f BarnT4 is: %4.2f Degree CelciusnH4 is : %4.2f KJ/KGnS2 is : %4.2f KJ/kgknn',p4,T4,h4,s4)
 fprintf('Wt is : %4 . 2f Kj/kgnWp is : %4.2f Kj/kgWnet is : %4.2f kj/kgNtherm is :% 4 .2f percentnS.S.C is : %4.2f kg/KWhnBWR is : %4.2f',Wt,Wp,W_net,N_per,steam_rate,BWR)

 % step 9: plot T-S diagram
 subplot (1,2,1)
 T_rankine = linspace(T5,T1,5000);
 for i = 1:length(T_rankine)
     s_rankine(i) = XSteam ('s_pT',p1,T_rankine(i));
 end
 plot([s1 s2 s3 s4 s5 s6 s_rankine],[T1 T2 T3 T4 T5 T6 T_rankine],'linewidth',1.5);
 hold on
 T_curve = linspace(1,400,500)
 for i = 1:length (T_curve)
     s_l(i) = XSteam ('sl_T',T_curve(i));
     s_v(i) = XSteam('sV_T',T_curve(i));
     h_l(i) = XSteam('hl_T',T_curve(i));
     h_v(i) = XSteam('hv_T',T_curve(i));
 end
 plot(s_l,T_curve);
 plot(s_v,T_curve);
 text(s1,T1,'1','FontSize',15)
 text(s2,T2,'2','FontSize',15)
 text(s3,T3,'3','FontSize',15,'HorizontalAlignment','right','VerticalAlignment','top')
 text(s4,T4,'4','FontSize',15,'HorizontalAlignment','right','VerticalAlignment','bottom')
 text(s5,T5,'5','FontSize',15)
 text(s6,T6,'6','FontSize',15)
 xlabel('entropy in KJ/kgk')
 ylabel('temperatre in degree celcius')

 % step 10 : plot H-S diagrem
 subplot(1,2,2)
 plot([s1 s2 s3 s4 s1],[h1 h2 h3 h4 h1],'linewidth',2)
 hold on
 plot(s_v,h_v,'color','r')
 plot(s_l,h_l,'color','r')
 text(s1,h1,'1','FontSize',15)
 text(s2,h2,'2','FontSize',15)
 text(s3,h3,'3','FontSize',15,'HorizontalAlignment','right','VerticalAlignment','top')
 text(s4,h4,'4','FontSize',15,'HorizontalAlignment','right','VerticalAlignment','bottom')
 xlabel('entropy in KJ/kgk')
 ylabel('enthalpy in kj/kg')
EXPLANATION
1 XSteam data is used to extract steam and water properties pf enthalpy ,entropy at a specific pressure and temperature for sat liquid ,sat vapour conditions etc.
2. The program requires the input of pressure (in bar) at state point 1 (turbine inlet) ,Temperature at same point (deg celcius ) and Temp at condenser inlet (point 2)
3. With the help of these inlets & from Xsteam data ,the program calculates all the sate point s of the Rankine cycle .
4. The XSteam data works as,
5.h1 = XSteam ('h_pT',p1,T1); (Returns the enthalpy of water at given pressure and temperature in bar and degC resp .)
6. As we extract the data ,we use thermodynamic relation to further find state points and extract their data from XSteam .
7. Sf and sg ,hf and hg ,where f and g stands for saturated liquid and saturated vapour respectively
8.The net work ,work done by turbine,work done to run the pump,Heat in and heat out are calculated using standard thermodynamic relation
9. Efficiency and specific steam consumption (s.s.c) of the Rankine cycle is calculated .
10. T,s and h are extracted at vapor amd liquid line for plotting purpose ,after 4th point for the variation you observe in the plot .
11. Saturation curve is plotted in red for saturated liquid and saturated gas.
12. Plot of Tvs s and h vs s is created from all the points obtained from the program .
13. The plot changes are the user input changes for the above mentioned inputs .
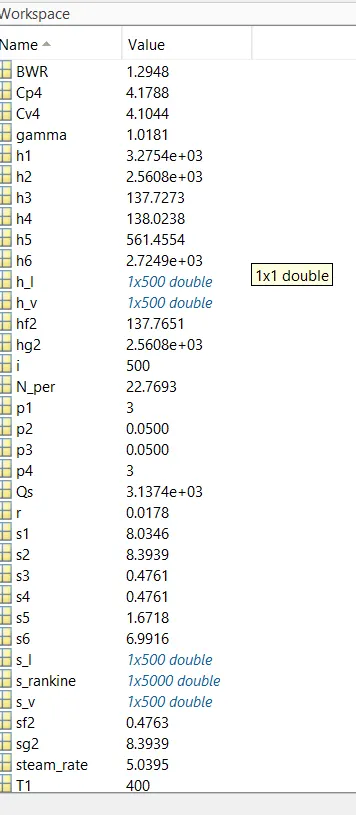
14. Results are displayed in command window.
OUTPUT GRAPHS
1-GRAPH
GRAPH -2
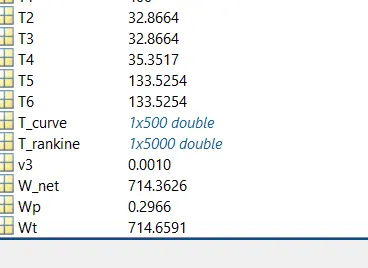
WORKSPACE VALUES
CONCLUSION
1 - Rankine cycle is a power generating cycle
2- Superheating increases the thermal efficiency of cycle
3- It is the most practical cycle .