Project - Data Handling and Interpolation
Project :
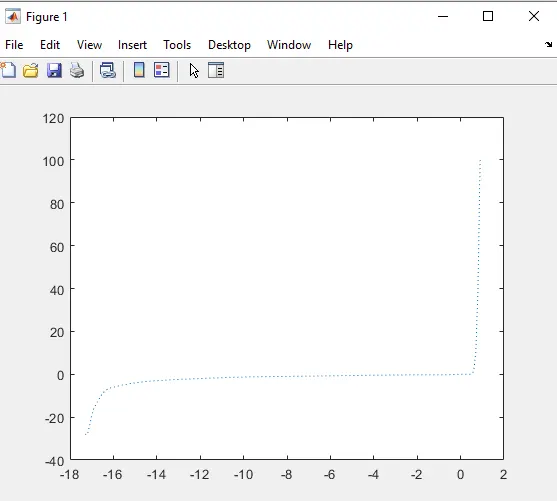
In a laboratory experiment, data of voltage and current has been recorded and the same is attached in an excel file ( Click on this link VI.xlsx ). Read the excel file in the Matlab program and perform the interpolation in the range of -17.3:0.1:0.9. Generate the interactive plot for the interpolated data and store them in a text file.
Key Highlights:
- Graphical solutions are more visual and appealing
- Interpolation of data
- Read excel file
- Write to text file
Deliverables:
- Find missing data and save it in text
- Interpolate the data set
- Save your program and attach the same.
- Save txt file and upload in attachment.
SOLUTION:
clc;
clear all;
data = readtable('VI.xlsx');% extraxcting data from the XL file
%format compact;
V =table2array(data(:,1)); % storing the voltage value in the V variable
I =table2array(data(:,2)); %storing the current value in the I variable
v =[-17.3:0.1:0.9]; % setting the interpolation limit
z= v'; % transpose the limit valuesfromrow to column
interpolation_result = interp1(V,I,z,'spline'); % spline interpolation
figure(1);
plot(v,interpolation_result,':'); % result:
% Saving all the volatge current, interpolation limits
filename=fopen(' project ','w'); % creating the text file to store the prime numbers
fprintf(filename,' V \t, I \t, z \n');
fprintf(filename,'%.2f \t,%.2f \t,%.2f \n',V,I,z); % printing the primenumbers in the text file
%disp(" the data was stored");
fclose(filename); % closing the textfile
%disp(" completed ");
% interpolation result:
filename1=fopen(' interpolation result ','w'); % creating the text file to store the prime numbers
fprintf(filename1,'%.2f \n',interpolation_result); % printing the primenumbers in the text file
%disp(" the data was stored");
fclose(filename1); % closing the textfile
%disp(" completed ");
RESULT: