Project - Data Handling and Interpolation
CODE
% Performing interpolation in given data.
V = xlsread ('VI.xlsx', 'A:A'); % Reading voltage data from A column of excel file.
I = xlsread ('VI.xlsx', 'B:B'); % Reading current data from B column of excel file.
format compact; % Specifying compact format for data.
x = -17.3 : 0.1 : 0.9; % Interpolation range.
y = interp1 (V,I,x,'spline'); % Interpolating withing given range using interp1, with spline method.
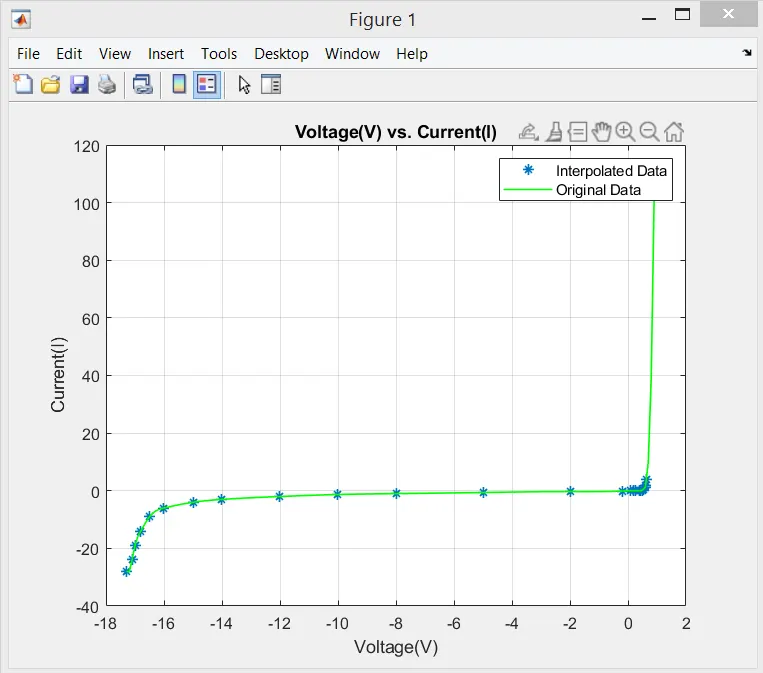
plot (V,I,'*',x,y, 'g', 'LineWidth', 1); % Plotting the Original Data & Interpolated data.
grid on; % Adding grid to plot.
xlabel ('Voltage(V)'); % Labelling X axis.
ylabel ('Current(I)'); % Labelling Y axis.
title ('Voltage(V) vs. Current(I)'); % Title of the plot.
legend ('Interpolated Data', 'Original Data'); % Legends in the plot.
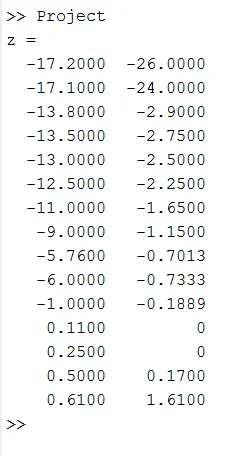
VV = [-17.2;-17.1;-13.8;-13.5;-13.0;-12.5;-11;-9;-5.76;-6;-1;0.11;0.25;0.5;0.61]; % Given Data.
II = interp1 (V, I, VV); % Interpolating for II.
z = [VV II] % z vector with values of VV & II.
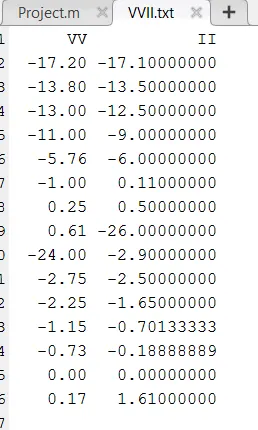
fid = fopen ('VVII.txt','w'); % File pointer to write in 'VVII.txt'.
fprintf (fid,'%6s %12s\n','VV','II'); % Printing in file 'VV' & 'II'.
fprintf (fid,'%6.2f %12.8f\n',z); % Printing values of z vector.
fclose (fid); % Closing txt file.
OUTPUT