Project - Data Handling and Interpolation
Data Handling and Interpolation
Project Statement
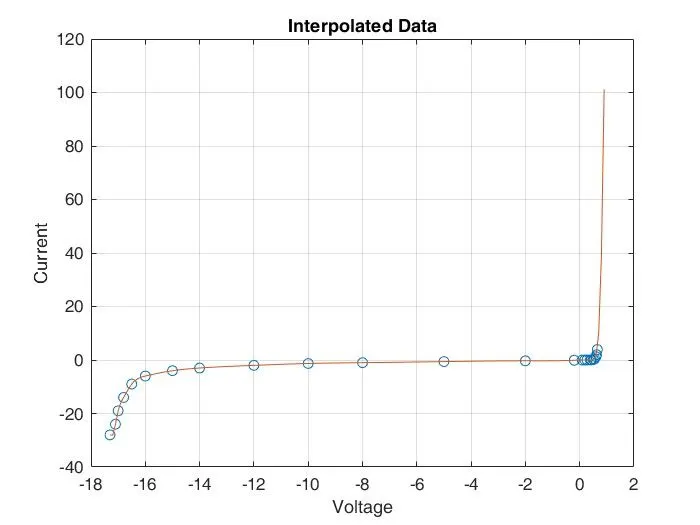
In a laboratory experiment, data on voltage and current has been recorded and the same is attached in an excel file. Read the excel file in the Matlab program and perform the interpolation in the range of -17.3:0.1:0.9. Generate the interactive plot for the interpolated data and store them in a text file.
Expected Results
- Find missing data and save it in the text file
- Interpolate the data set
- Save your program and attach the same.
- Save the .txt file and upload it in the attachment.
MATLAB CODE:
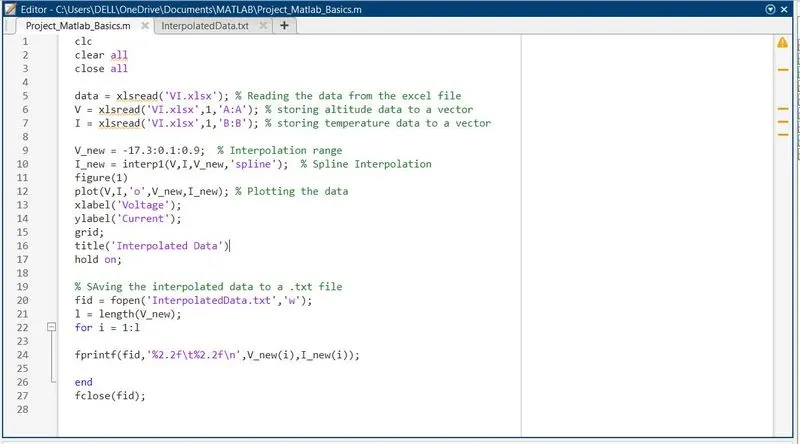
clc
clear all
close all

data = xlsread('VI.xlsx'); % Reading the data from the excel file
V = xlsread('VI.xlsx',1,'A:A'); % storing voltage data to a vector
I = xlsread('VI.xlsx',1,'B:B'); % storing current data to a vector

V_new = -17.3:0.1:0.9;  % Interpolation range
I_new = interp1(V,I,V_new,'spline');  % Spline Interpolation
figure(1)
plot(V,I,'o',V_new,I_new); % Plotting the data
xlabel('Voltage');
ylabel('Current');
grid;
title('Interpolated Data')
hold on;

% Saving the interpolated data to a .txt file
fid = fopen('InterpolatedData.txt','w');
l = length(V_new);
for i = 1:l

fprintf(fid,'%2.2f\t%2.2f\n',V_new(i),I_new(i));

end
fclose(fid);
PLOTS:
CONCLUSION:
- The data was read from the given excel file.
- Missing data were interpolated with the help of the spline function.
- Plot was generated from the interpolated data.
- The generated data was stored in a .txt file.