Project - Data Handling and Interpolation
Assignment 4
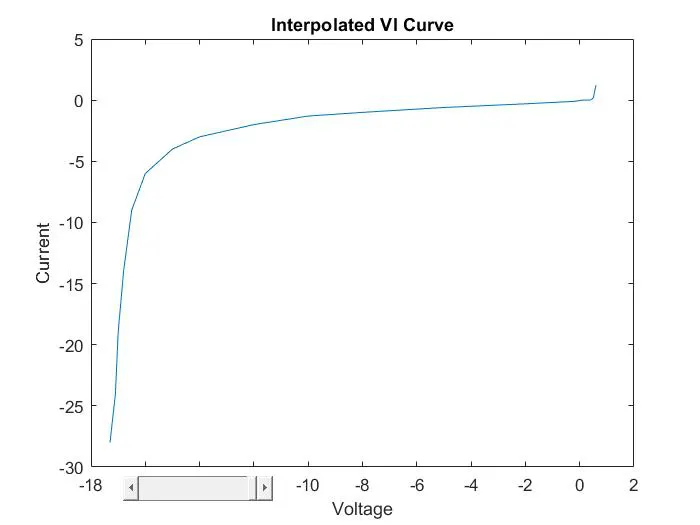
Q. In a laboratory experiment, data of voltage and current has been recorded and the same is attached in an excel file ( Click on this link VI.xlsx ). Read the excel file in the Matlab program and perform the interpolation in the range of -17.3:0.1:0.9. Generate the interactive plot for the interpolated data and store them in a text file.
Ans:
MATLAB CODE:
clear all
close all
clc

%% Read excel file
data = xlsread('VI.xlsx');

%% Extract voltage and current data
voltage = data(:,1);
current = data(:,2);

%% Define interpolation range
new_voltage = -17.3:0.1:0.9;

%% Perform interpolation
new_current = interp1(voltage,current,new_voltage,'linear');

%% Generate interactive plot
fig = figure();
figure;
plot(new_voltage,new_current);
xlabel('Voltage');
ylabel('Current');
title('Interpolated VI Curve');

slider = uicontrol('Style', 'slider', 'Min', 0, 'Max', 10, 'Value', 10, 'Position', [100 20 120 20]);

set(slider, 'Callback', {@updatePlot, voltage, current});

%% Save interpolated data in a text file
fileID = fopen('interpolated_data.txt','w');
fprintf(fileID,'Voltage\tCurrent\n');
for i = 1:length(new_voltage)
    fprintf(fileID,'%f\t%f\n',new_voltage(i),new_current(i));
end
fclose(fileID);
function updatePlot(source, ~, voltage, current)
    xlim([0 get(source, 'voltage')]);
    plot(voltage, current);
    title('Interactive Plot');
    xlabel('Voltage');
    ylabel('Current');
    legend('voltage vs current');
end
Code Explaination:
To interpolate the data, you can use the "interp1" function in Matlab. Assuming that the voltage data is in the first column of the "data" matrix and the current data is in the second column, the code to interpolate the data would look like this:
%% Extract voltage and current data
voltage = data(:,1);
current = data(:,2);
%% Define interpolation range
new_voltage = -17.3:0.1:0.9;
%% Perform interpolation
new_current = interp1(voltage,current,new_voltage,'linear');
To generate an interactive plot in Matlab, you can use the "plot" function. Assuming that you want to plot the interpolated data, the code to generate an interactive plot would look like this:
%% Generate interactive plot
figure;
plot(new_voltage,new_current);
xlabel('Voltage');
ylabel('Current');
title('Interpolated VI Curve');
Interactive plot and it's function
function updatePlot(source, ~, voltage, current)
xlim([0 get(source, 'Value')]);
plot(voltage, current);
title('Interactive Plot');
xlabel('Voltage');
ylabel('Current');
legend('voltage vs current');
end
Use the "uicontrol" function to add user controls to the GUI figure. For example, you can add a slider to control the range of the x-axis:
slider = uicontrol('Style', 'slider', 'Min', 0, 'Max', 10, 'Value', 10, 'Position', [100 20 120 20]);
set(slider, 'Callback', {@updatePlot, voltage, current});
To store the interpolated data in a text file, you can use the "fprintf" function. Assuming that you want to store the interpolated voltage and current values in a text file named "interpolated_data.txt", the code to store the data would look like this:
%% Save interpolated data in a text file
fileID = fopen('interpolated_data.txt','w');
fprintf(fileID,'Voltage\tCurrent\n');
for i = 1:length(new_voltage)
fprintf(fileID,'%f\t%f\n',new_voltage(i),new_current(i));
end
fclose(fileID);
Output: