Project - Data Handling and Interpolation
Q: In a laboratory experiment, data of voltage and current has been recorded and the same is attached in an excel file ( Click on this link VI.xlsx ). Read the excel file in the Matlab program and perform the interpolation in the range of -17.3:0.1:0.9. Generate the interactive plot for the interpolated data and store them in a text file.
Matlab code:
% Read the Excel file
data = readtable('VI.xlsx', 'VariableNamingRule', 'preserve');
% Check for missing data and save it to a text file
missing_data = data(isnan(data.Voltage) | isnan(data.Current), :);
if ~isempty(missing_data)
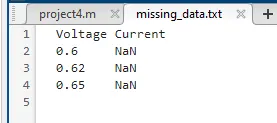
writetable(missing_data, 'missing_data.txt', 'delimiter', '\t');
end
% Interpolate the data set
V = data{:,1}; % Extract voltage values
I = data{:,2}; % Extract current values
Vq = -17.3:0.1:0.9; % Define the range of interpolated voltage values
Iq = interp1(V, I, Vq); % Interpolate the current values for the new voltage values
% Generate the interactive plot
figure
plot(V, I, 'o', Vq, Iq, '-')
xlabel('Voltage (V)')
ylabel('Current (A)')
title('VI Curve')
legend('Measured Data', 'Interpolated Data')
% Save the interpolated data to a text file
interpolated_data = [Vq' Iq'];
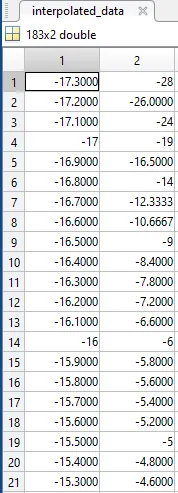
dlmwrite('interpolated_data.txt', interpolated_data, 'delimiter', '\t', 'precision', 4);
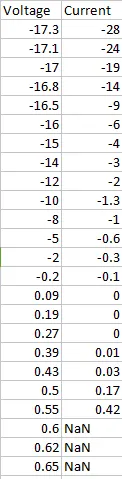
Result: by changing last three numbers in VI excel file to 'NaN' we can get missing numbers. The code checks for missing data by using the isnan() function, which checks if the value is NaN (not a number). If there are no missing values, then the missing_data variable will be empty, and the code inside the if statement will not be executed.
This code loads the data directly into Matlab, interpolates the data using the interp1 function with the original voltage and current data and the range of interpolated voltage values, and generates an interactive plot of the measured data and the interpolated data. The interpolated data is saved to a text file 'interpolated_data.txt' using the dlmwrite function.
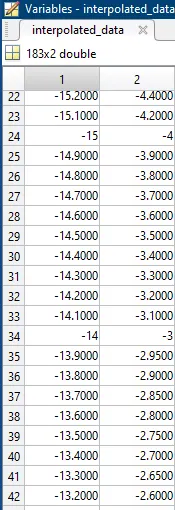
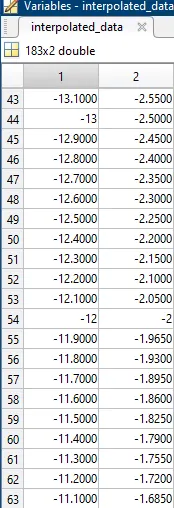
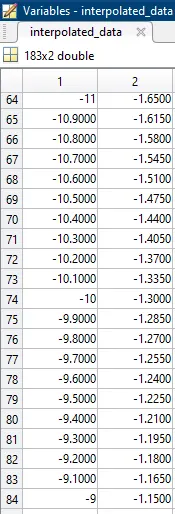
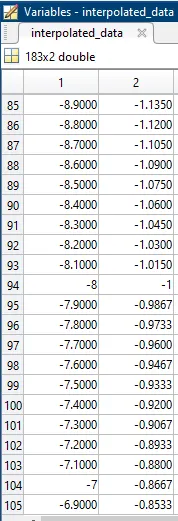
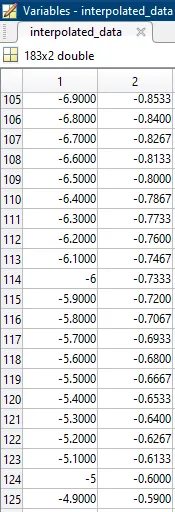
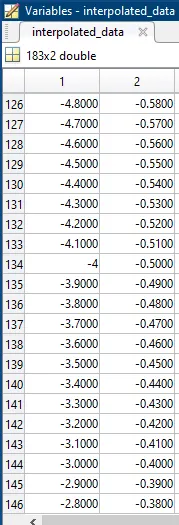
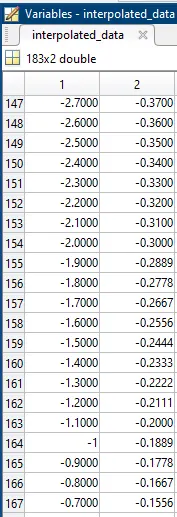
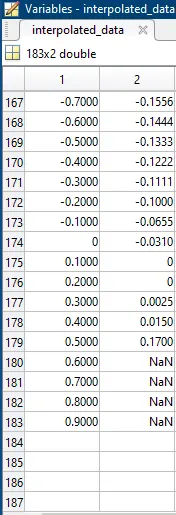
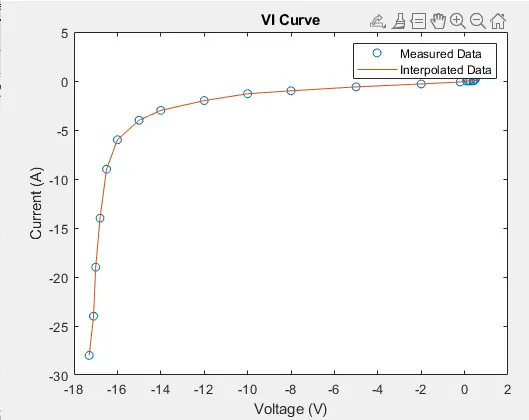
Conclusion: This code reads the Excel file 'VI.xlsx' and extracts the voltage and current values. It then defines the range of interpolated voltage values and uses the 'interp1' function to interpolate the current values for the new voltage values. The interpolated data is then plotted in an interactive plot with the measured data, and finally, the interpolated data is saved to a text file 'interpolated_data.txt' using the 'dlmwrite' function.