Project - Data Handling and Interpolation
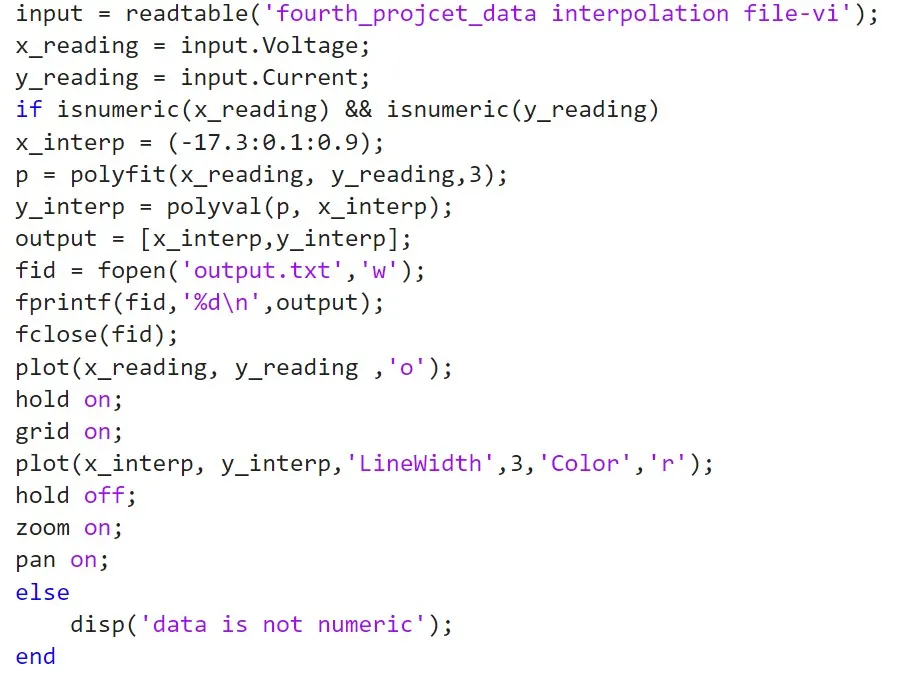
steps:
Steps:
1. Taken data of voltage and current provided
2. Use readtable cmd to read data which is in the form of xlsx format
3. Used input.Voltage and input.Current to load data column wise (x_reading and y_reading)
4. Used if statement for numeric data isnumeric data and else if its not numeric data.
5. Put given condition for which is range from -17.3 :0.1:0.9 for range form -17.3 to 0.9 at 0.1 interval by x_interep
6. P is for polyfit gave (x_reading ,y_reading,3) at degree three.
7. Y_interp for polyval(p ,x_interp) is for polyfit and x_interp
8. Then show output which is (x_interp,y_interp) sorted values of voltage and current.
9. fid =fopen(‘output.txt’,'w’) to store this values in txt format
10. fprintf(fid,'%d\n’,output) this is to prient this sorted values
11. Fclose(fid) this is for to close writable program
12. Used plot cmd to plot x_reading against y_reading
13. Hold on; grid on;
14. Used plot cmd once again to draw a plot of x_interp and y_interp wih linewidth 3 at read colour.
15. Hold off ;zoom on ;panon;
16. Else to close if statement
17. End to end program .
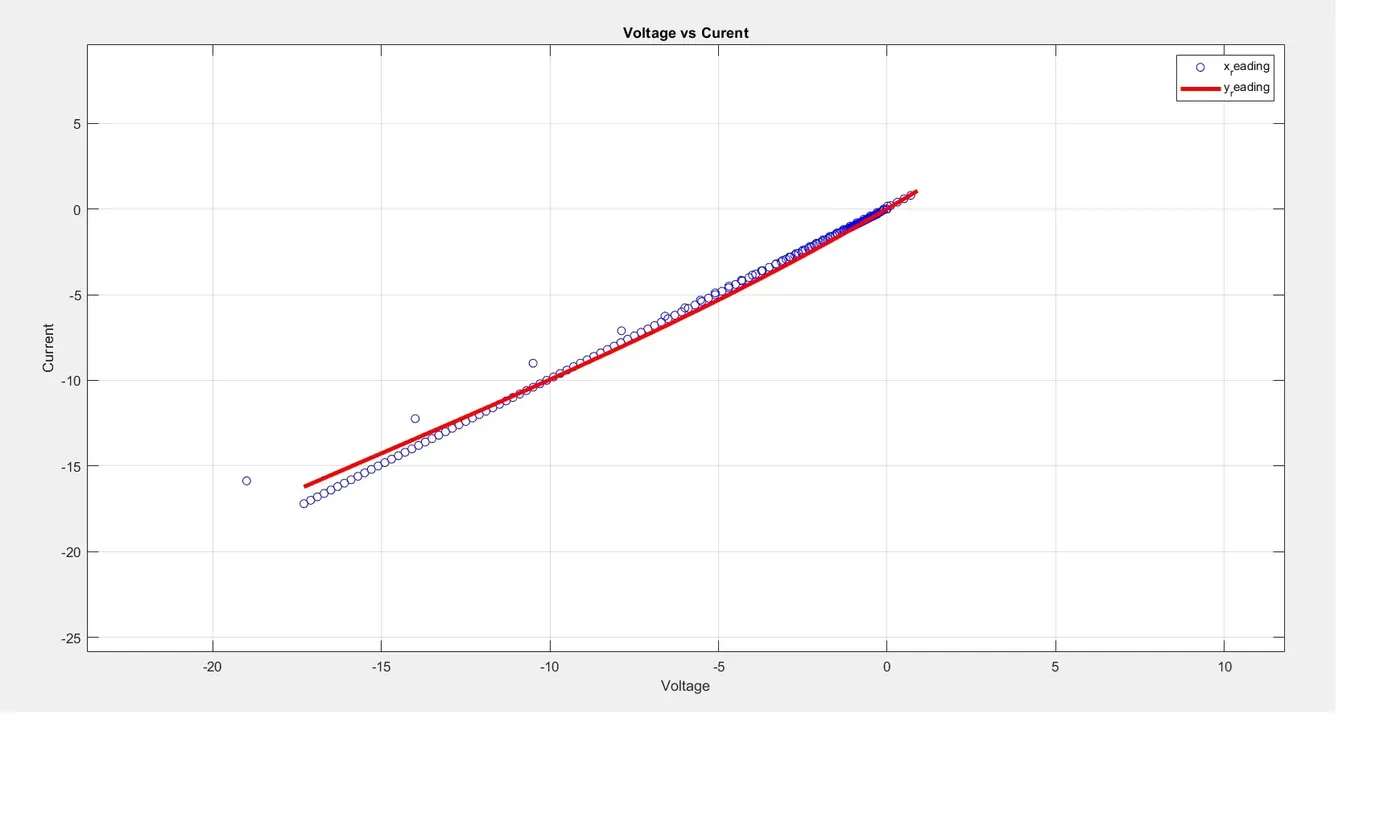
Result : It is visible from plot that
this is graph of voltage to current at - 15 voltage current also at -15 at 0 voltage current also at 0
means there is no current where is no voltage.
x_reading curve and y_reading curve matching at -10,-5 and 0 co-ordinates
have attached text file with this to show sorted current volage plot.