Project - Data Handling and Interpolation
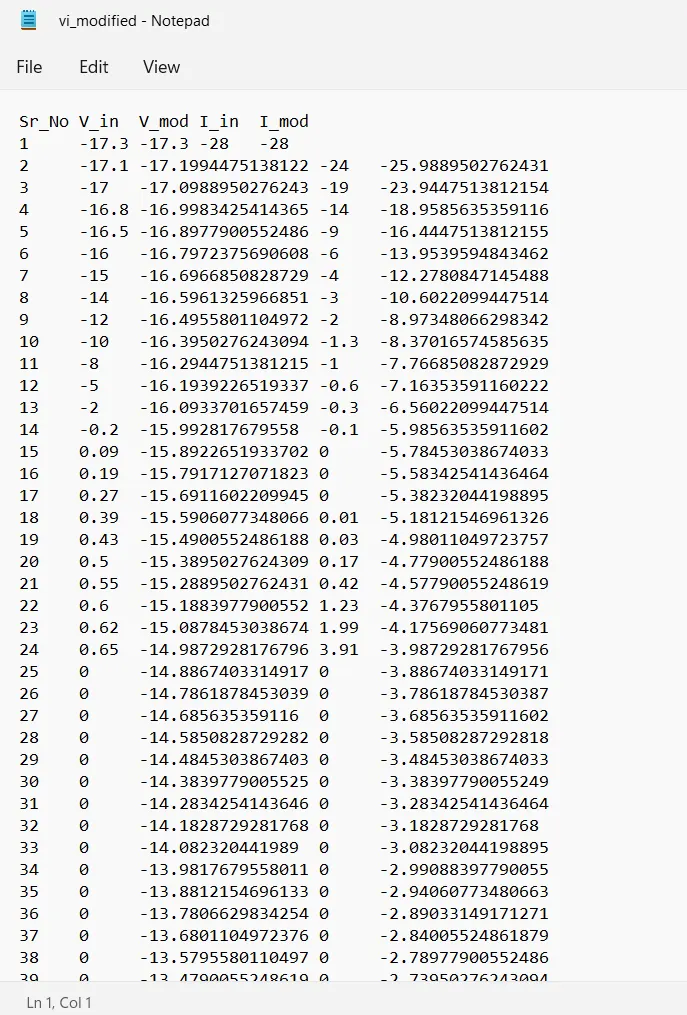
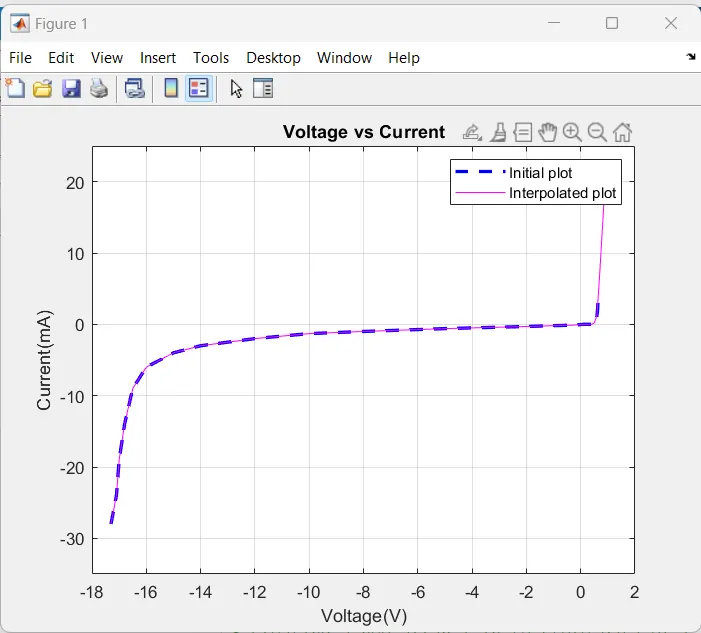
Objective: The objective of the project is to read the given data from an excel file and interpolate it in the range -17.3:0.1:0.9. After interpolation plot the graph of interpolated data and write the data in a text file.
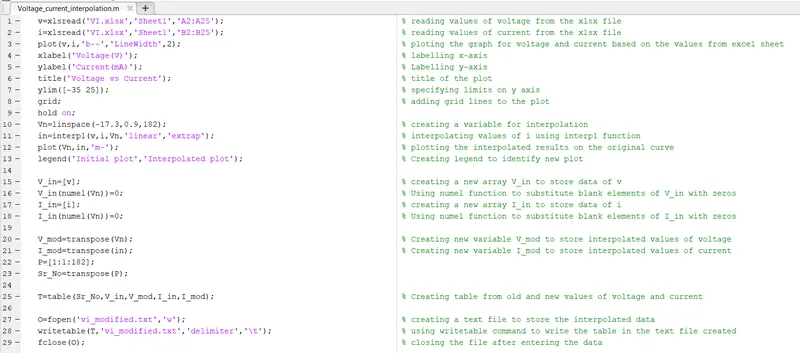
Code:
v=xlsread('VI.xlsx','Sheet1','A2:A25'); % reading values of voltage from the xlsx file
i=xlsread('VI.xlsx','Sheet1','B2:B25'); % reading values of current from the xlsx file
plot(v,i,'b--','LineWidth',2); % plotting the graph for voltage and current based on the values from excel sheet
xlabel('Voltage(V)'); % labelling x axis
ylabel('Current(mA)'); % Labaling y axis
title('Voltage vs Current'); % title of the plot
ylim([-35 25]); % specifying limits on y axis
grid; % adding grid lines to the plot
hold on;
Vn=linspace(-17.3,0.9,182); % creating a variable for interpolation
in=interp1(v,i,Vn,'linear','extrap'); % interpolating values of i using interp1 function
plot(Vn,in,'m-'); % plotting the interpolated results on the original curve
legend('Initial plot','Interpolated plot'); % Creating legend to identify new plot
V_in=[v]; % creating a new array V_in to store data of v with 0 in the remaining places
V_in(numel(Vn))=0; % Using numel function to substitute blank elements of V_in with zeros
I_in=[i];
I_in(numel(Vn))=0;
V_mod=transpose(Vn); % Creating new variable V_mod to store interpolated values of voltage
I_mod=transpose(in); % Creating new variable I_mod to store interpolated values of current
P=[1:1:182];
Sr_No=transpose(P);
T=table(Sr_No,V_in,V_mod,I_in,I_mod); % Creating table from old and new values of voltage and current
disp(T);
O=fopen('vi_modified.txt','w'); % creating a text file to store the interpolated data
writetable(T,'vi_modified.txt','delimiter','\t'); % using writetable command to write the table in the text file created
fclose(O); % closing the file after entering the data
Screenshot:
Output:
1)
2)