Project - Data Handling and Interpolation
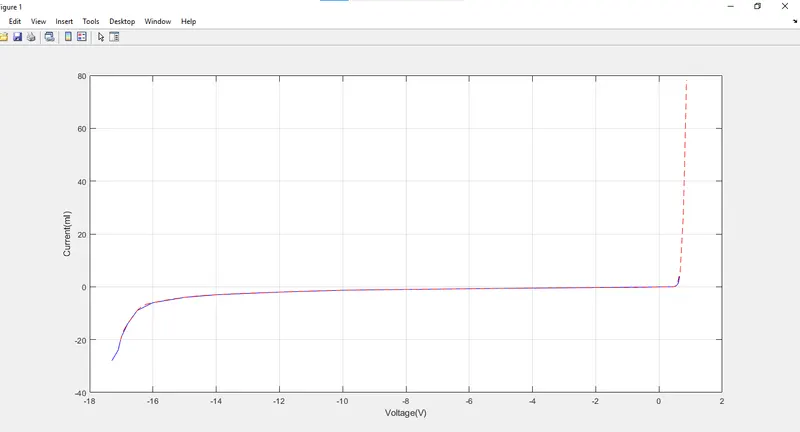
In a laboratory experiment, data of voltage and current has been recorded and the same is attached in an excel file ( Click on this link VI.xlsx ). Read the excel file in the Matlab program and perform the interpolation in the range of -17.3:0.1:0.9. Generate the interactive plot for the interpolated data and store them in a text file.
clear all
clc
close all
D=xlsread('VI.xlsx'); % read excel file 'VI'
A=D(:,1); % take A as a column no.1 of D
B=D(:,2); % take B as a column no.2 of D
plot(A,B,'b-');grid;hold; % plot A v/s B
xlabel('Voltage(V)');ylabel('Current(mI)'); % labels the axis
A1=[-17.03:0.1:0.9]; % Set range for intertpolation
Z=interp1(A,B,A1,'spline');% interp the A and B with A1
plot(A1,Z,'r--'); % plot the A1 v/s Z
fileId=fopen('Matlab_Basics_Project.txt','w'); % Create a file
fprintf(fileId,'%2.2f \n',Z); % save the file
fclose(fileId); % close the file