Project - Data Handling and Interpolation
Project
Data Handling and Interpolation
In a laboratory experiment, data of voltage and current has been recorded and the same is attached in an excel file ( Click on this link VI.xlsx ). Read the excel file in the Matlab program and perform the interpolation in the range of -17.3:0.1:0.9. Generate the interactive plot for the interpolated data and store them in a text file.
Key Highlights:
- Graphical solutions are more visual and appealing
- Interpolation of data
- Read excel file
- Write to text file
Deliverables:
- Find missing data and save it in text
- Interpolate the data set
- Save your program and attach the same.
- Save txt file and upload in attachment
Summary:-
- Data Handling :-
Data handling is the process of collecting, organizing and presenting the data in such a way that is helpful to analyse and make the conclusion.
- Interpolation :-
Interpolation is a method of fitting the data points to represent the value of a function. It has a various number of applications in engineering and science, that are used to construct new data points within the range of a discrete data set of known data points or can be used for determining a formula of the function that will pass from the given set of points (x,y). In this article, we are going to discuss the meaning of interpolation in Statistics, its formulas, and uses in detail.
- MATLAB have functions key to help with interpolation are interp1 and interp2, interp1 is for one dimensional and interp2 for 2 dimentional.
- Interpolation include Linear, Cubic and Spline.
Method :-
- Download voltage current data file VI.xlsx from given link and save it to current working directory of MATLAB.
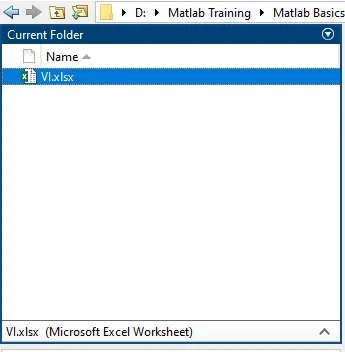
- Define variable for given data in excel file.
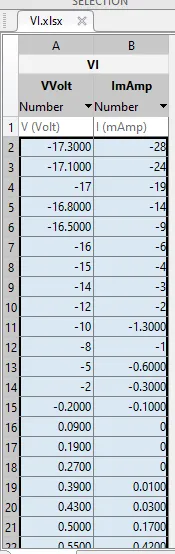
Script (code) to perform interpolation and writing data in txt file.
clc, clear, close all
% loading data from excel for volt and current.
[VI_data] = xlsread("VI.xlsx");
% defining varaibles for data
V = VI_data(:,1); % define variable and data for voltage
I = VI_data(:,2);  % define variable and data for current
xq = [-17.3:0.1:0.9]; % define range for interpolation
VI1 = interp1(V,I,xq); % Linear interpolate data (default)
VI2 = interp1(V,I,xq,'spline'); % spline interpolate data
figure(1)
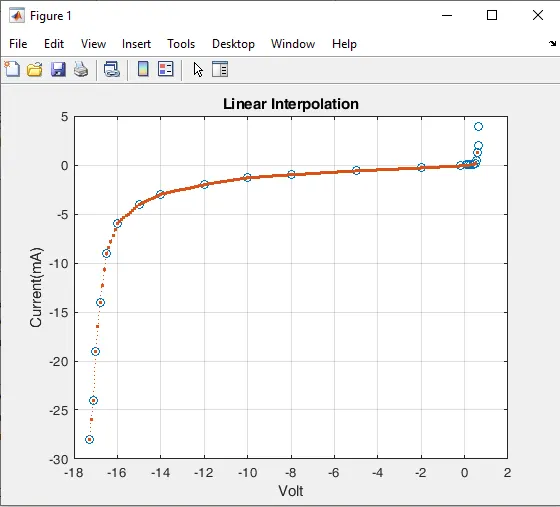
plot (V,I,'o',xq,VI1,':.')
grid , xlabel('Volt'),ylabel('Current(mA)');
title('Linear Interpolation');
figure(2)
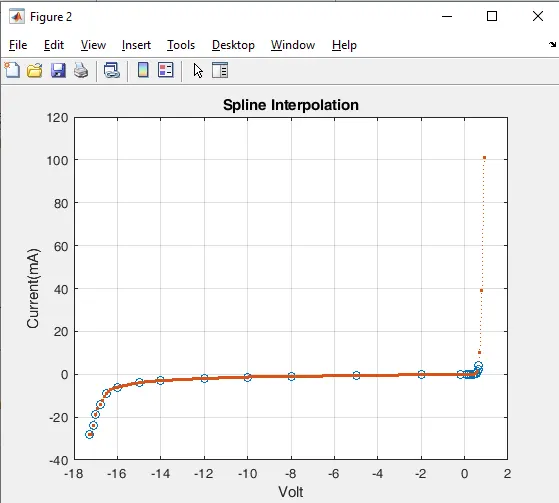
plot(V,I,'o',xq,VI2,':.');
grid , xlabel('Volt'),ylabel('Current(mA)');
title('Spline Interpolation');
fid = fopen('Lnr_int_data.txt','w'); % saving linear interpolation data in .txt file
fprintf(fid,'%2.2f\n',VI1);
fclose(fid);
fid1 = fopen('slp_int_data.txt','w'); % saving spline interpolation data in .txt file
fprintf(fid,'%2.2f\n',VI2);
fclose(fid1);
Plot Results :-
Linear Interpolation plot
Spline Interpolation Plot
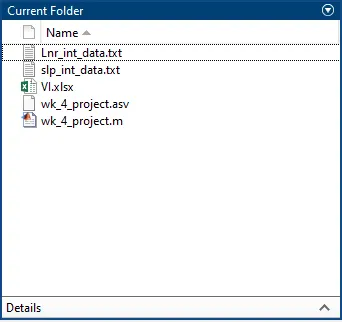
Text File created in current folder
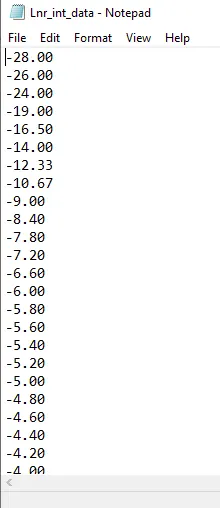
Output in text file of linear interpolation
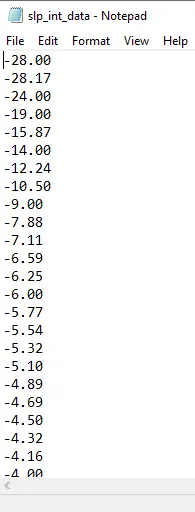
Output in text fie for Spline Interpolation.
Conclution :-
Iterpolation of given data of voltage and current has been succesfully completed and missing data saved in text file.