Project - Data Handling and Interpolation
Q1)In a laboratory experiment, data of voltage and current has been recorded and the same is attached in an excel file ( Click on this link VI.xlsx ). Read the excel file in the Matlab program and perform the interpolation in the range of -17.3:0.1:0.9. Generate the interactive plot for the interpolated data and store them in a text file.
Answer Code:
clc;
clear all;
D=readmatrix('VI.xlsx');
Xq=-17.3:0.1:0.9;
V=D(:,1);%voltage in Volts
I=D(:,2);%Current in mamps
Yq=interp1(V,I,Xq);
Yq1=interp1(V,I,Xq,'spline');
figure(1);
plot(V,I,'--o',Xq,Yq,'m-');grid;
title('Linear interpolation');
legend('Before interpolation','After interpolation');
xlabel('Voltage');
ylabel('Current');
figure(2);
plot(V,I,'--o',Xq,Yq1,'y-'); grid;
title('Spline interpolation');
legend('Before interpolation','After interpolation');
xlabel('Voltage');
ylabel('Current');
%storing the Linear interpolation data in text file
save Yq.txt
fileID= fopen('Yq.txt','w');
fprintf(fileID,'%4.4f\n',Yq);
fclose(fileID);
%storing the Spline interpolation data in text file
save Yq1.txt
fileID= fopen('Yq1.txt','w');
fprintf(fileID,'%4.4f\n',Yq1);
fclose(fileID);
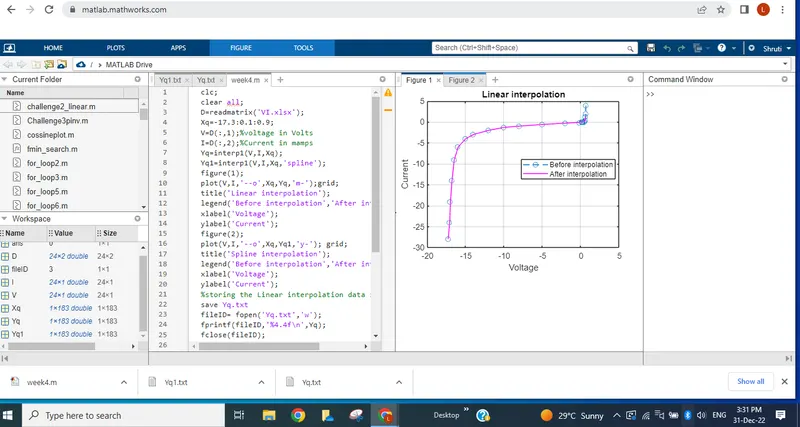
Program file with linear interpolation figure.
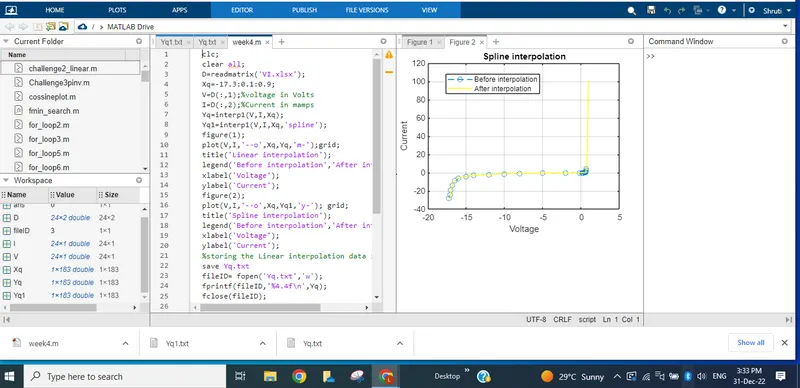
Program file with Spline interpolation figure.
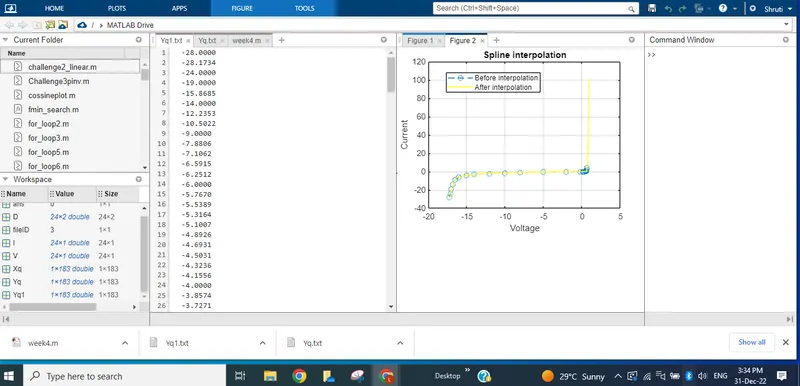
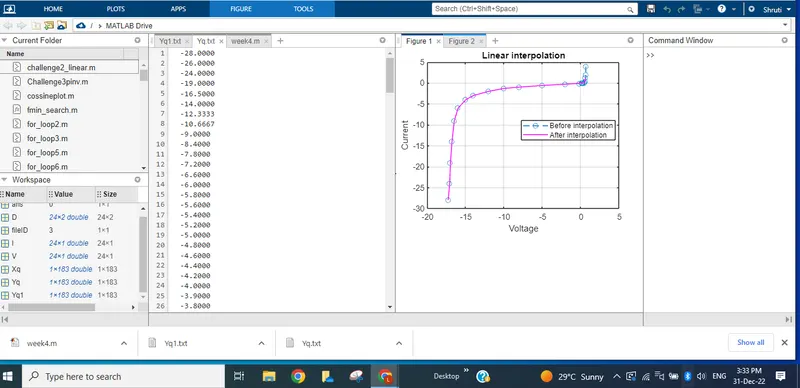
Text file Yq for linearly interpolated data:
& Text file Yq1 for spline interpolated data: