Project - Data Handling and Interpolation
Solution:
Code:
clc; %clear the work space
V=xlsread('VI.xlsx','A1:A100'); %reading the value of Voltage from the excel
I=xlsread('VI.xlsx','B1:B100'); %reading the value of Voltage from the excel
Veq=-17.3:0.1:0.9; %setting the range of voltage for ineterpolation
Ieq=interp1(V,I,Veq); %interpolating the value of I
figure(1);
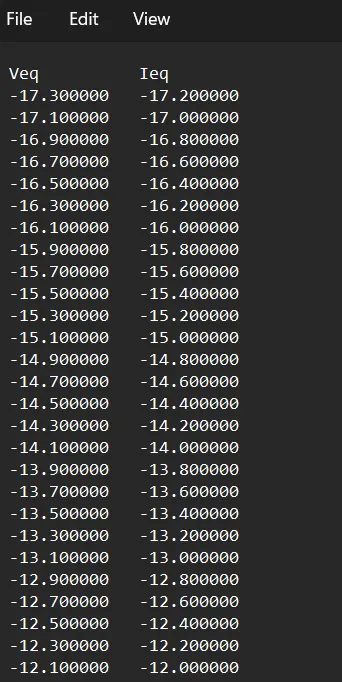
fptr=fopen('VI_interpolated.txt','w'); %opeing the text file using the file pointer 'fptr'
fprintf(fptr, 'Veq \t \t Ieq \n'); %writing to the text file
fprintf(fptr, '%f \t %f \n',Veq,Ieq); %writing the interpolated values to the text file
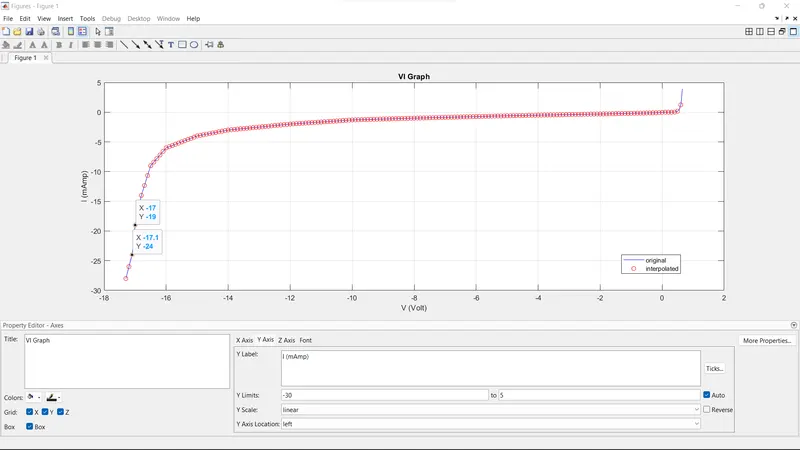
plot(V,I,'b'); %plotting the original values
grid; %enabling grid
hold; %holding the plot
plot(Veq,Ieq,'ro'); %plotting the interpolated values
xlabel('V (Volt)'); %labeling x axis
ylabel('I (mAmp)'); %labeling y axis
title('VI Graph'); %setting title to the plot
legend('original','interpolated'); %inserting legends
Screen shot of text file:
Screen shot of plot: