Project - Data Handling and Interpolation
Project:
From the laboratory experiment, data on voltage and current has been recorded. The same data is accessed in an excel file.
Read the excel file
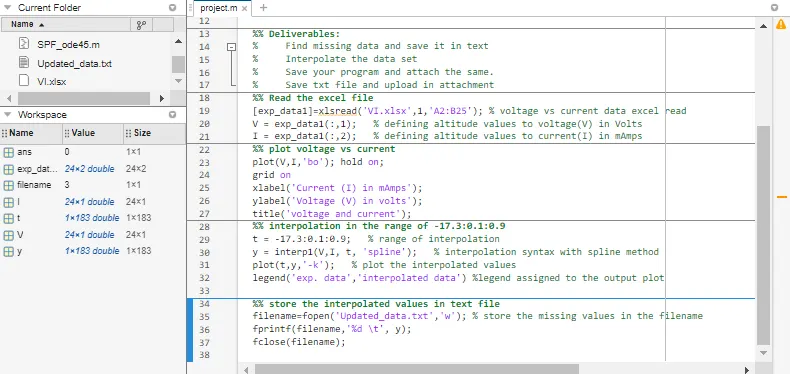
Laboratory experimental data for voltage vs current values available in an excel file has been accessed by using the Matlab command ‘xlsread’. Matlab code is also provided below.
---------------------------------------------------------------------------------------------------------------------------
---------------------------------------------------------------------------------------------------------------------------
Interpolation in the range of -17.3:0.1:0.9
Using the syntax of interpolation to the given range with the ‘spline’ method. And plotted for the interpolated using the ‘plot’ command. Matlab code is also provided below.
---------------------------------------------------------------------------------------------------------------------------
---------------------------------------------------------------------------------------------------------------------------
Store them in a text file
Finally, all the obtained interpolated values are stored in a text file. Using the ‘fopen’ command in Matlab and the code for the same is also provided below.
---------------------------------------------------------------------------------------------------------------------------
---------------------------------------------------------------------------------------------------------------------------
The below image shows the script file for obtaining the interpolation values for the given range and storing the values in a text file. All the executed files are shown in the workspace in Matlab GUI.
---------------------------------------------------------------------------------------------------------------------------
Output:
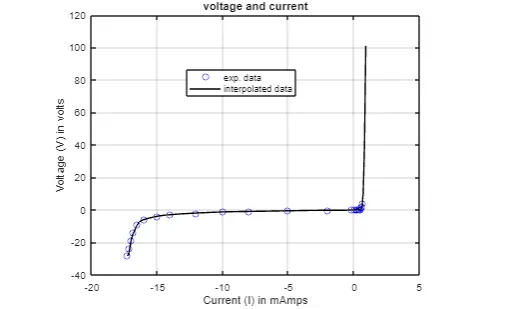
The plot for the raw experimental data and interpolated data has shown in the figure attached below.
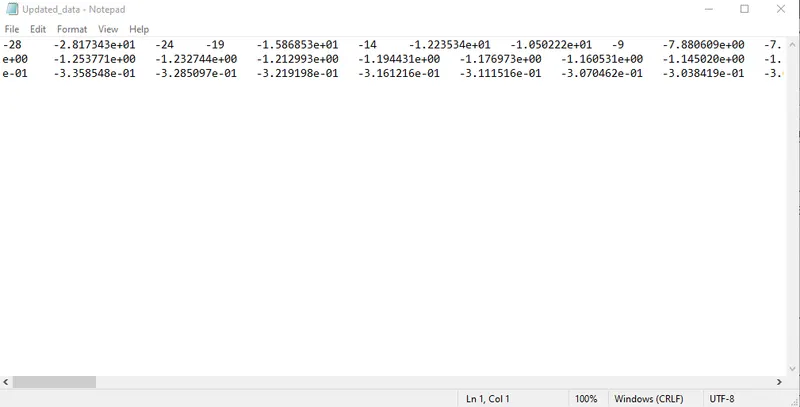
Stored interpolated values in the file name as specified in the code. Values has been stored or written in the file as shown in the figure below.