Project 1
Solution:
Aim:
To develop a forward energy-based fuel consumption model of a conventional vehicle. For a typical midsize car with a 1.9L engine and a 4-speed automatic transmission is considered for analysis.
And to compute the fuel economy numbers for the given vehicle (kmpl) on the urban cycle (UDDS) and highway cycle (HWFET). Also, to analyze and understand the vehicle operating points in terms of engine speed, torque, transmission speeds, pedal positions, gear, distance traveled, etc.
Objectives:
a. Tabulate the fuel economy numbers (kmpl) for UDDS and HWFET cycle. This forms the baseline numbers for comparing with the future hybrid version.
b. Plot the time trace for engine, transmission input, transmission output and wheel speed on one plot.
c. Plot engine torque, engine power, fuel rate and fuel consumption using subplots.
d. Plot accelerator and brake pedal, gear command, vehicle desired and actual speed, vehicle distance using subplots.
e. Plot the engine operating points on the engine fuel map.
f. Write down appropriate brief comments on each of these plots, describing the vehicle behavior throughout the drive cycle.
g. Generate the plots for both drive cycles.
Forward 'Energy' model of a conventional vehicle (Dynamic simulation of the system):
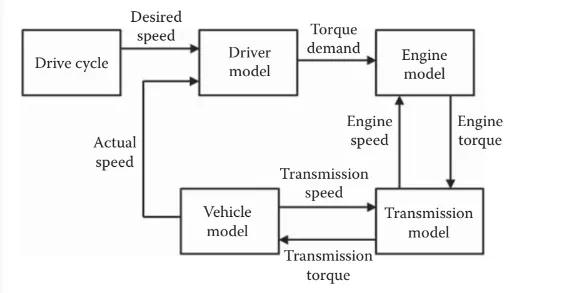
It determines the energy demand in the process of the driving cycle, to transmit the energy demand to the vehicle controller. This controller receives the signal and considers the current state of the vehicle components to optimize and determine power allocation, together with the output of each power source. The movement flow is transferred from the driving system, passing through the transmission to the tire module. Then, by means of equations that model the driving module, the real speed that is transmitted to the driver is calculated to form a closed cycle. The image below shows a simple scheme of the simulation process by the “forward” method.
---------------------------------------------------------------------------------------------------------------------------
Matlab script:
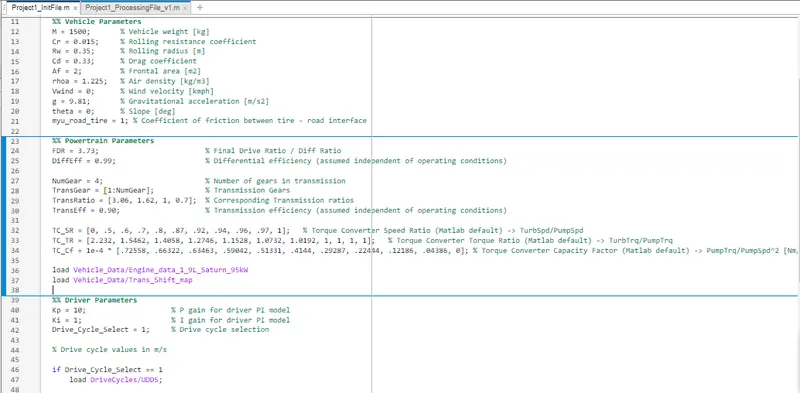
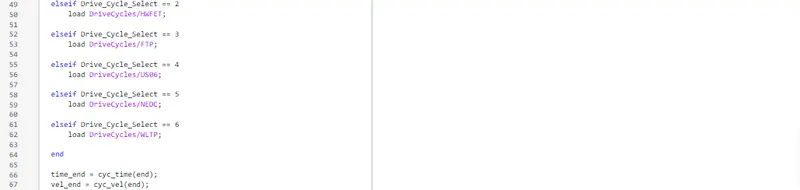
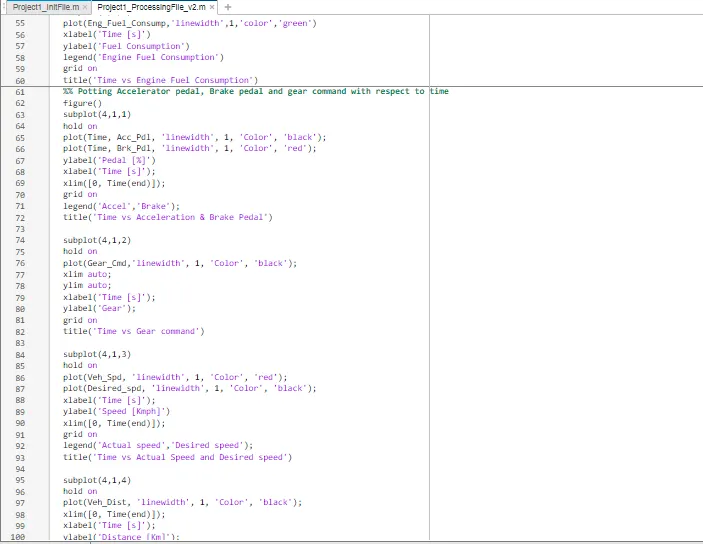
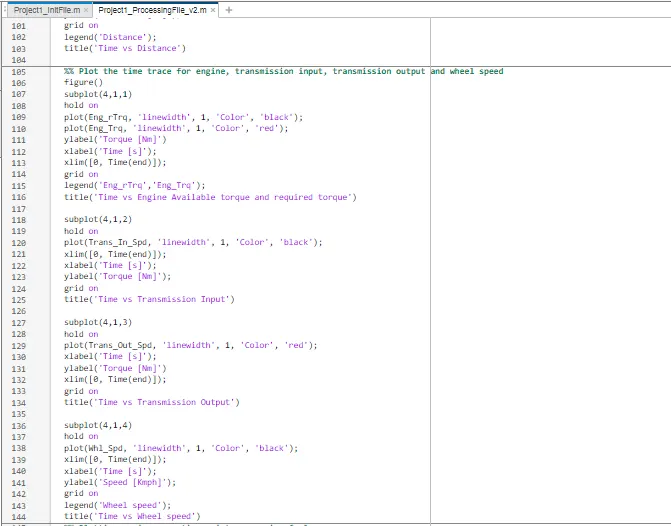
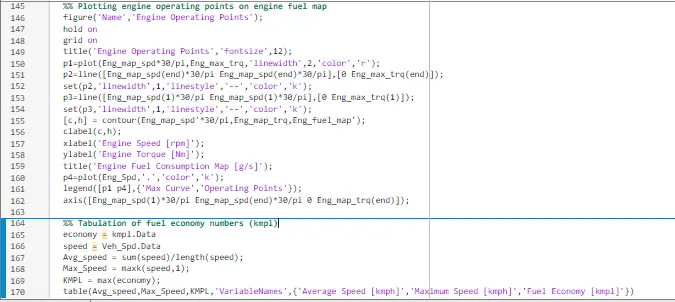
The vehicle, powertrain, and drive parameters are defined in the script and it is used to load all the variables in the workspace to run the Simulink model and for post-processing. And also the drive cycle selection is done here. This m-file is simulated before executing the Simulink vehicle model.
The image below shows the m-script file defined with all the vehicle, powertrain, and drive parameters.
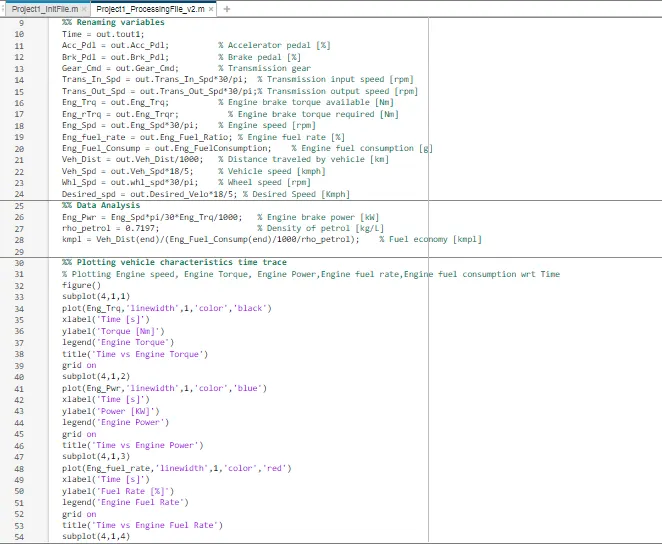
The image below shows the m-script file defined with all the vehicle, powertrain, and drive parameter performance outputs.
---------------------------------------------------------------------------------------------------------------------------
Simulink Model:
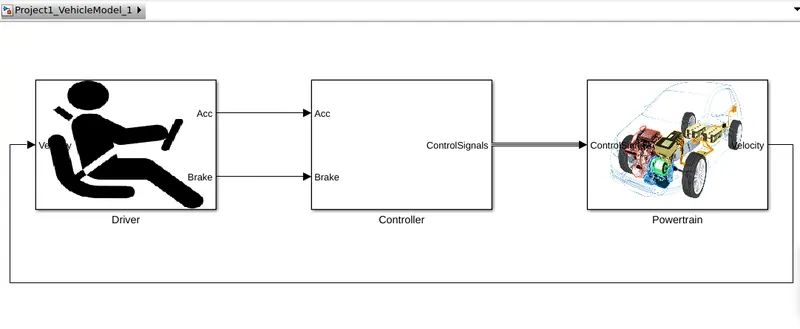
The vehicle model is built using Simulink blocks. The below image shows the driver, controller, and powertrain system built.
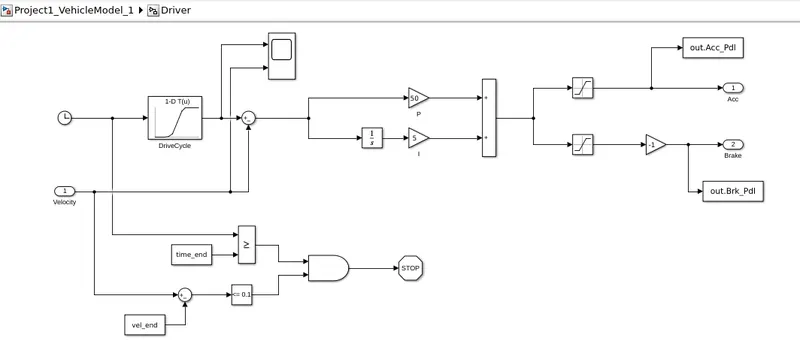
The driver subsystem model is built using various Simulink blocks as shown in the figure below.
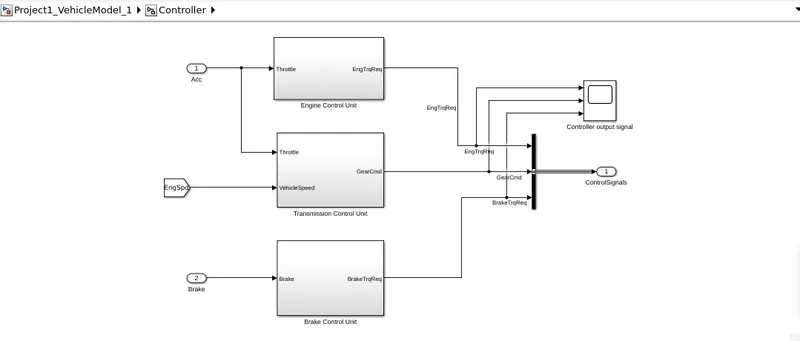
The controller subsystem model is built using various Simulink blocks as shown in the figure below.
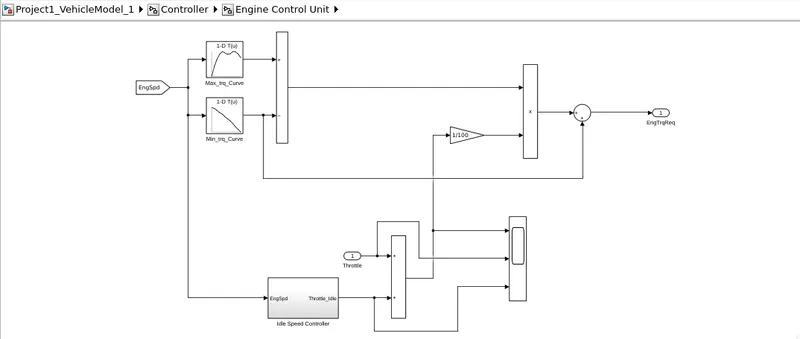
The Engine control unit subsystem model is built using various Simulink blocks as shown in the figure below.
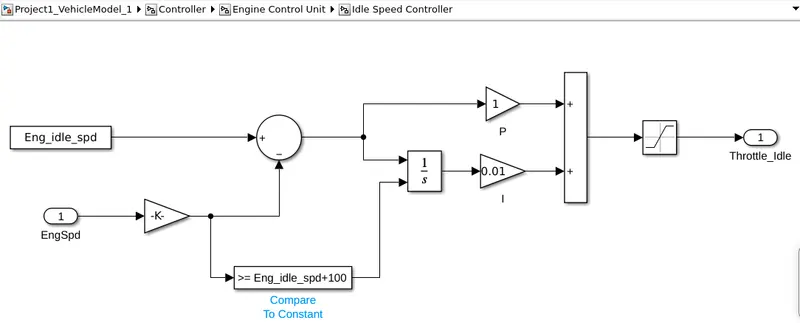
The Idel speed controller subsystem model is built using various Simulink blocks as shown in the figure below.
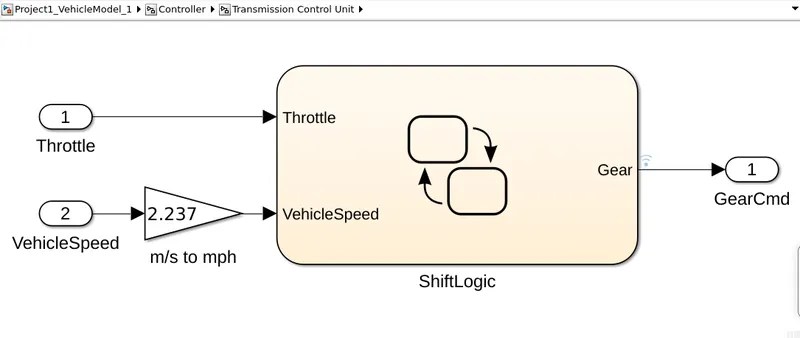
The transmission control unit subsystem model is built using various state flow features as shown in the figure below.
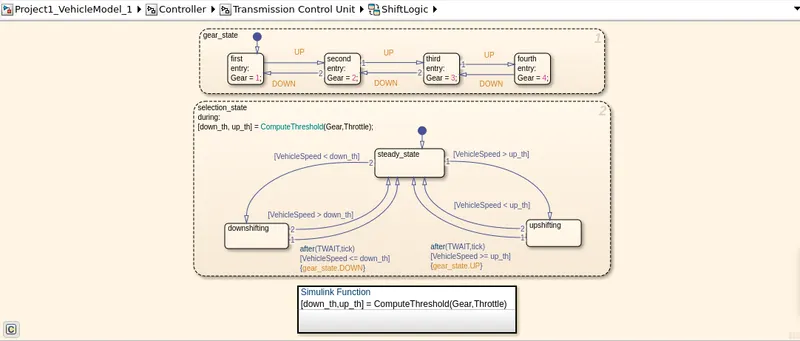
The transmission shift control logic model is built using various state flow features as shown in the figure below.
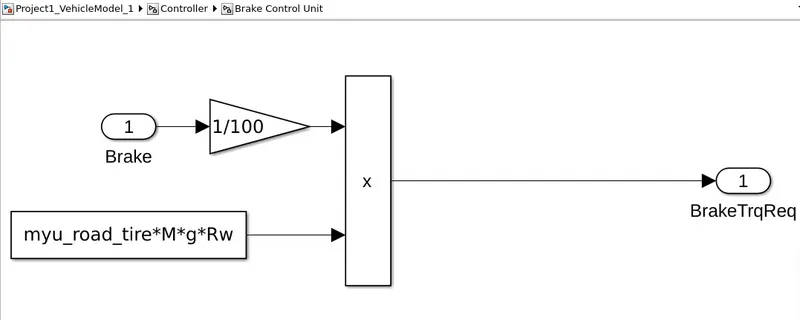
The Break control unit subsystem model is built using various Simulink blocks as shown in the figure below.
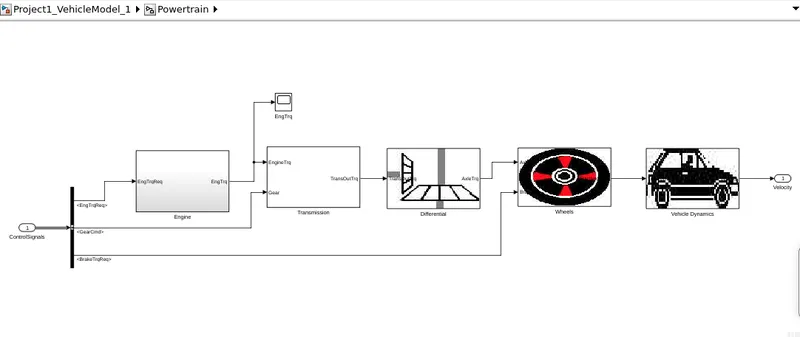
The powertrain subsystem model is built using various Simulink blocks as shown in the figure below.
The Engine subsystem model is built using various Simulink blocks as shown in the figure below.
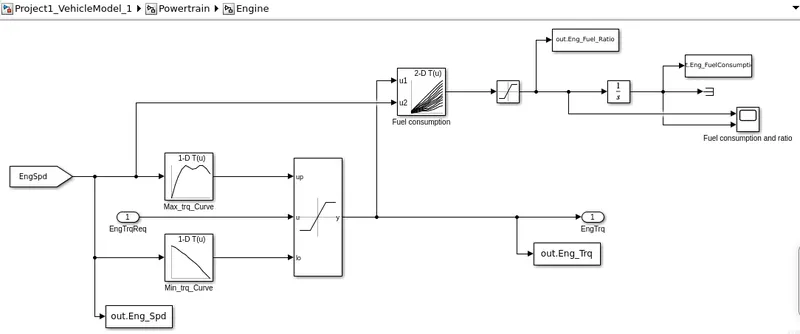
The transmission subsystem model is built using various Simulink blocks as shown in the figure below.
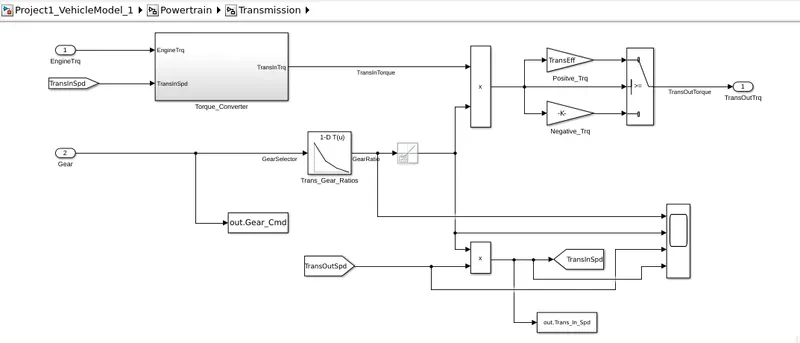
The torque converter subsystem model is built using various Simulink blocks as shown in the figure below.
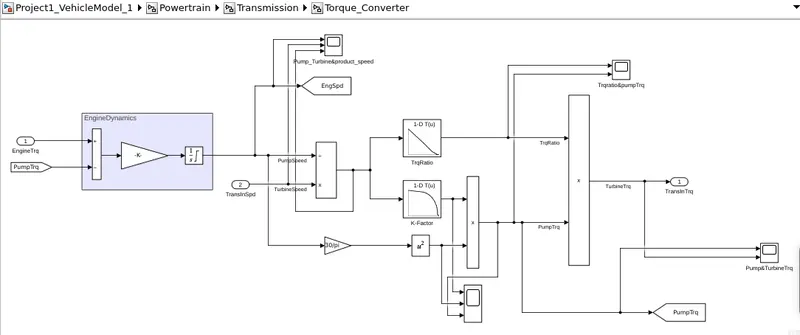
The differential subsystem model is built using various Simulink blocks as shown in the figure below.
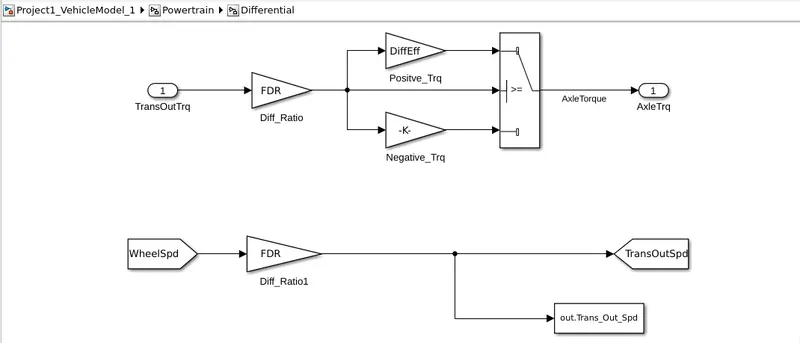
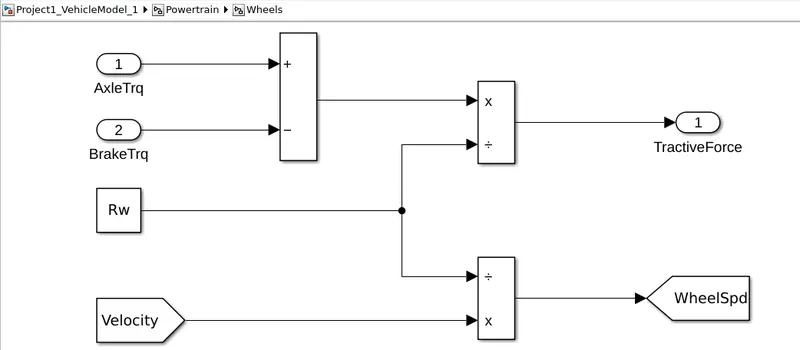
The wheel subsystem model is built using various Simulink blocks as shown in the figure below.
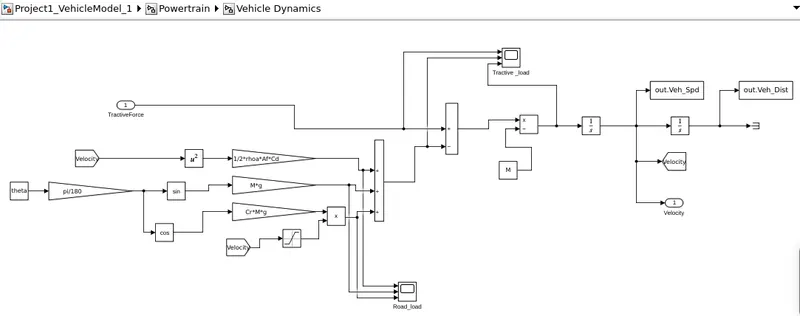
The vehicle dynamics subsystem model is built using various Simulink blocks as shown in the figure below.
---------------------------------------------------------------------------------------------------------------------------
Map-based model:
Fuel consumption
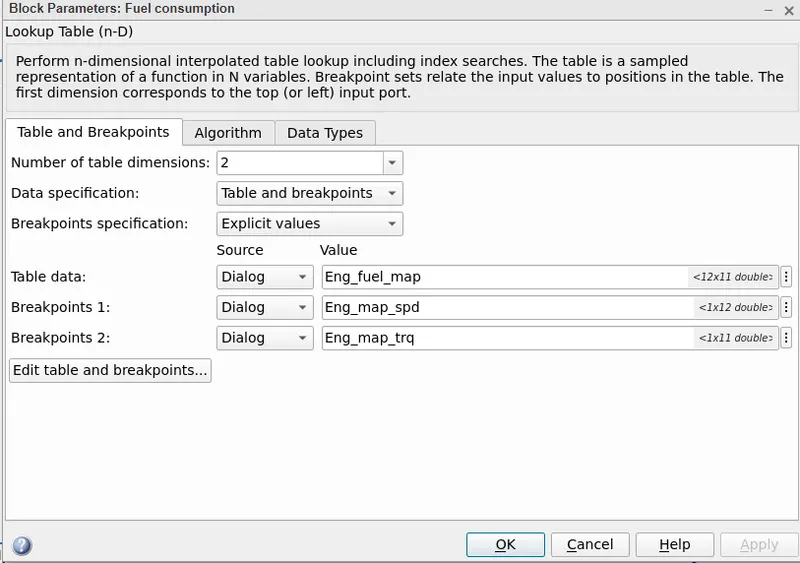
The image below shows the 2D Lookup table block parameter defined for the fuel consumption parameters in tabular form and breakpoints 1 and 2.
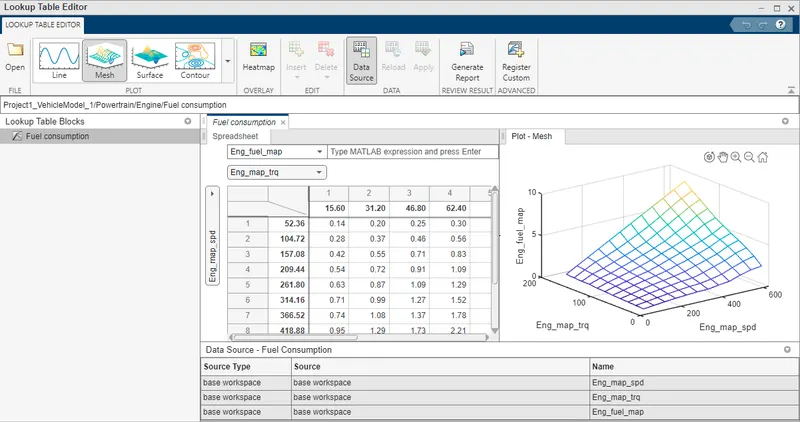
The below image shows the 3d mesh or a plot of the parameters defined for the fuel consumption.
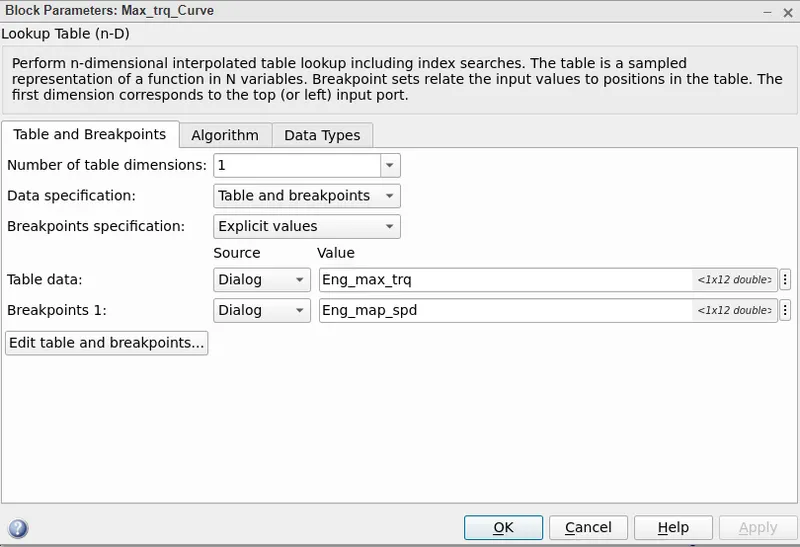
The image below shows the 1D Lookup table block parameter defined for the maximum torque in tabular form and breakpoints 1.
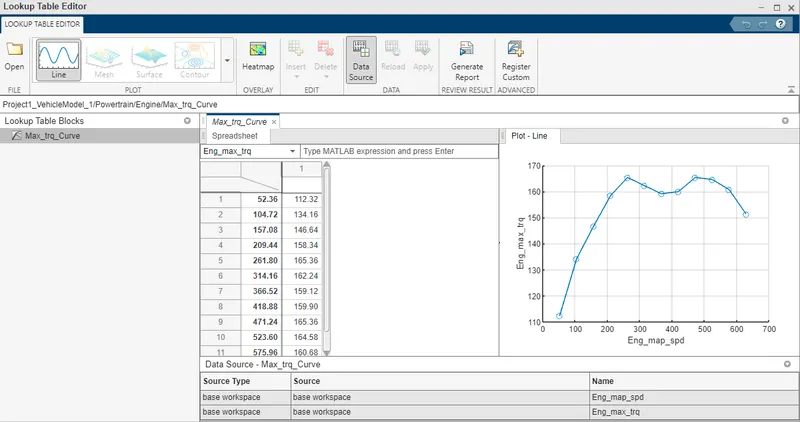
The below image shows the plot of the parameters defined for the maximum torque curve.
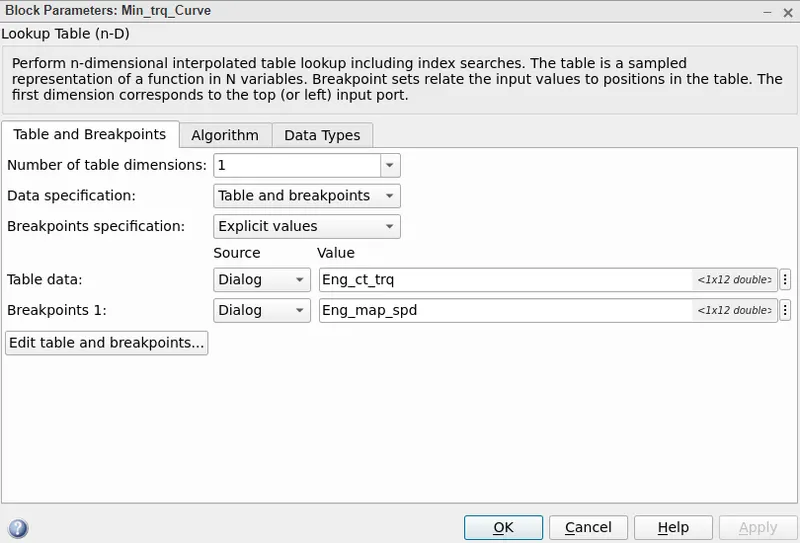
The image below shows the 1D Lookup table block parameter defined for the minimum torque in tabular form and breakpoints 1.
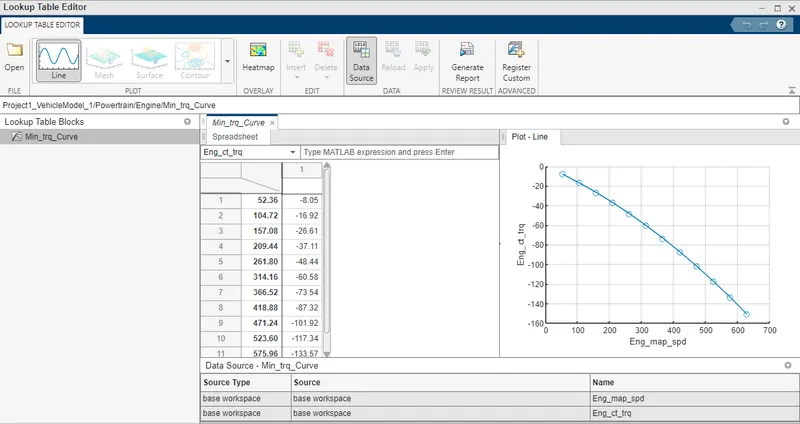
The below image shows the plot of the parameters defined for the minimum torque curve.
---------------------------------------------------------------------------------------------------------------------------
Fuel Economy Number (kmpl):
UDDS cycle

HWFET cycle

--------------------------------------------------------------------------------------------------------------------------
Drive Cycles:
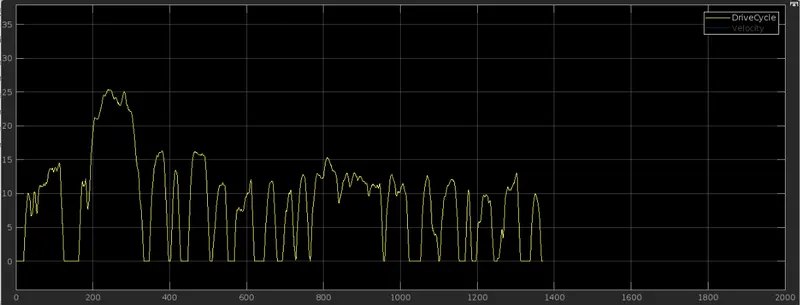
UDDS cycle
The below image shows the UDDS drive cycle.
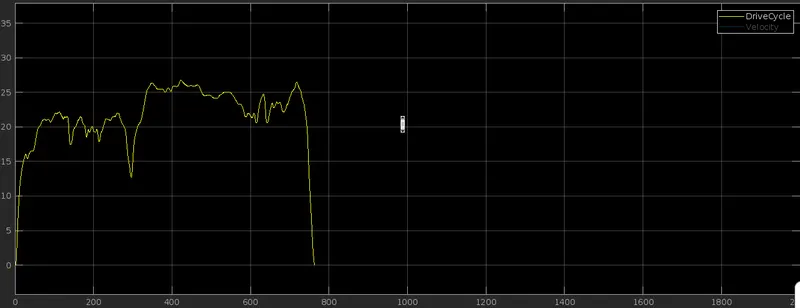
HWFET cycle
The below image shows the HWFET drive cycle.
---------------------------------------------------------------------------------------------------------------------------
Time trace:
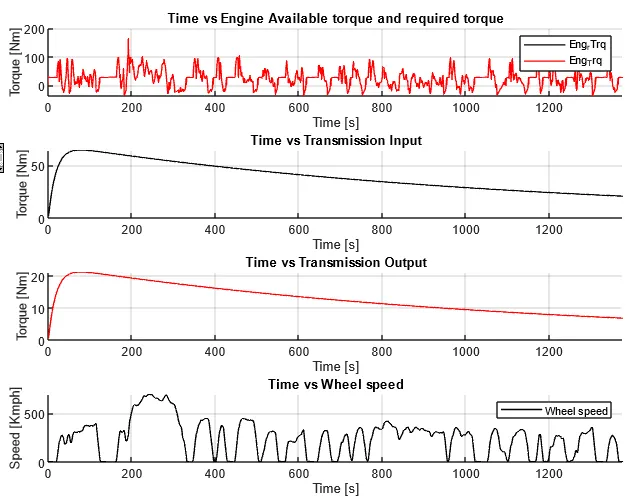
UDDS cycle
The below image shows the plot of an engine, transmission input, transmission output, and wheel speed performance while operating using the UDDS drive cycle.
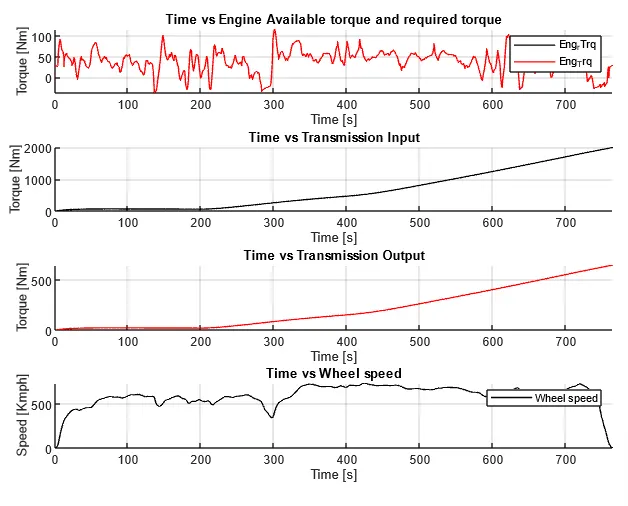
HWFET cycle
The below image shows the plot of an engine, transmission input, transmission output, and wheel speed performance while operating using the HWFET drive cycle.
---------------------------------------------------------------------------------------------------------------------------
UDDS cycle
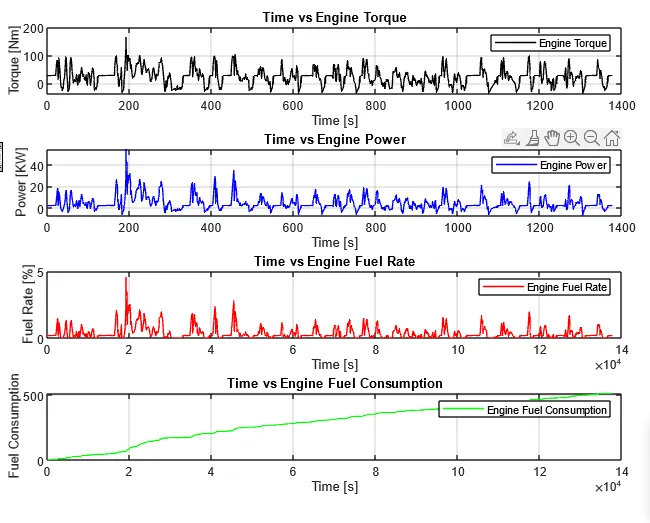
The below image shows the plot of engine torque, engine power, fuel rate, and fuel consumption performance while operating using the UDDS drive cycle.
HWFET cycle
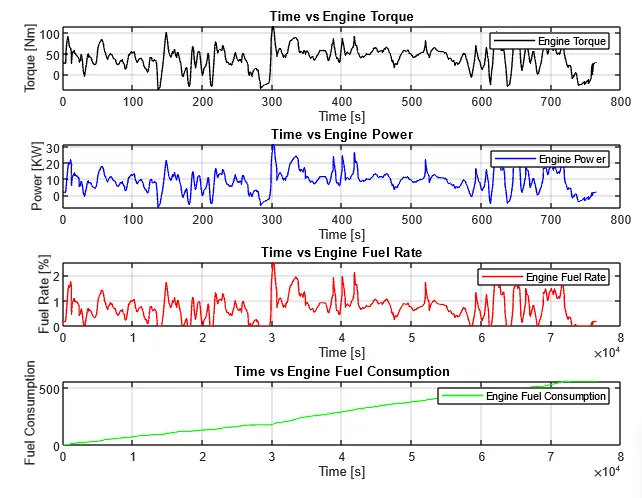
The below image shows the plot of engine torque, engine power, fuel rate, and fuel consumption performance while operating using the HWFET drive cycle.
---------------------------------------------------------------------------------------------------------------------------
UDDS cycle
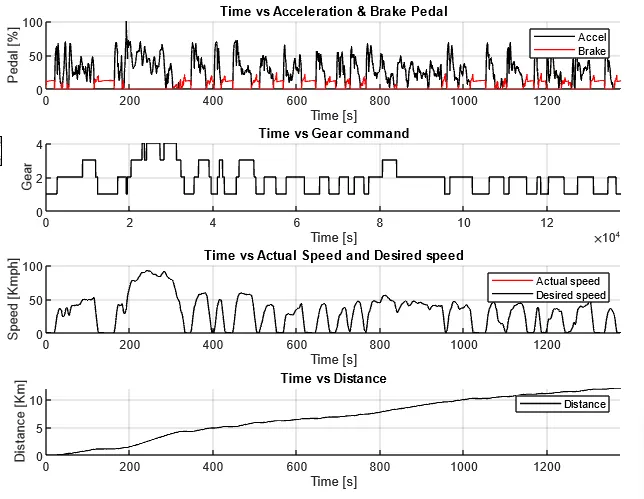
The below image shows the plot of an accelerator and brake pedal, gear command, vehicle desired and actual speed, and vehicle distance while operating using the UDDS drive cycle.
HWFET cycle
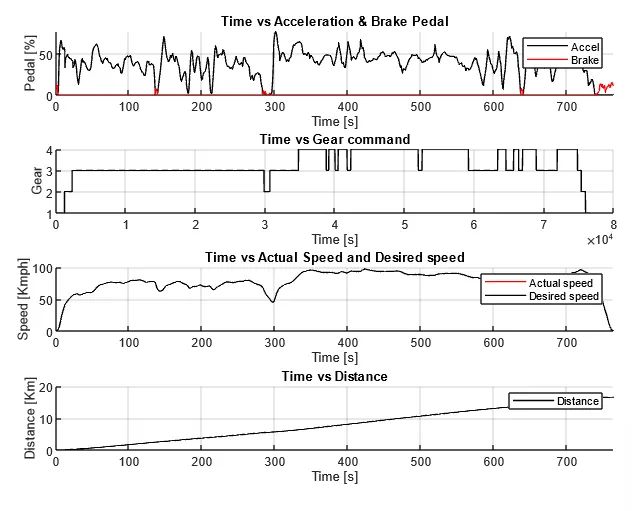
The below image shows the plot of an accelerator and brake pedal, gear command, vehicle desired and actual speed, and vehicle distance while operating using the HWFET drive cycle.
---------------------------------------------------------------------------------------------------------------------------
UDDS cycle
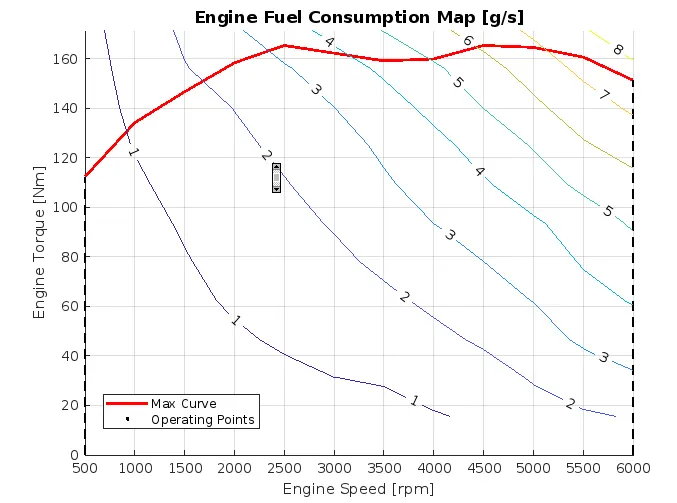
The below image shows the plot of an engine operating point on the engine fuel map and torque curve while operating using the UDDS drive cycle.
HWFET cycle
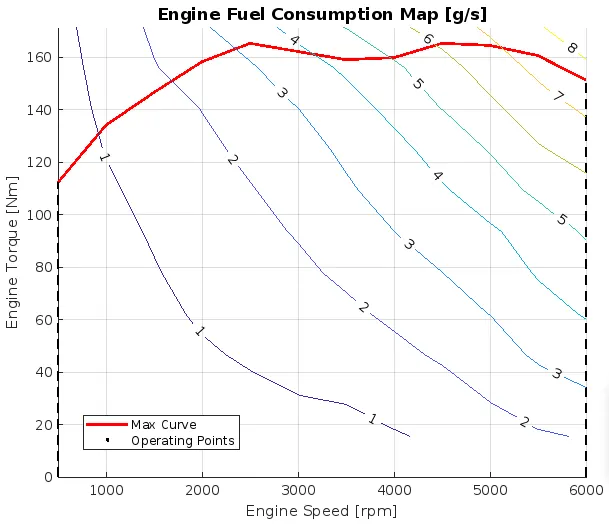
The below image shows the plot of an engine operating point on the engine fuel map and torque curve while operating using the HWFET drive cycle.
Conclusion and observations:
Following are the conclusion and observations made while working on the above projects:
1) Vehicle parameters have been assigned and the drive cycles are chosen to check the vehicle performance parameters using the m-script file in Matlab.
2) Simulink model has been built by defining various systems and subsystems with the appropriate Simulink blocks and connected to obtain the relative signals.
3) To analyze the performance of a given vehicle parameter and the output obtained after completing the simulations is utilized to analyze the performance and behavior of the various input conditions by defining the m-script file in Matlab.
4) From the obtained results for both UDDS and HWFET drive cycles the vehicle performance trends are discussed as follows:
Fuel Economy Numbers (kmpl): Has been obtained for both UDDS and HWFET drive cycle. It can be seen that HWFET drive cycle has better performance than UDDS drive cycle.
Engine, transmission input, transmission output, and wheel speed output:Engine available and required torque is almost same for both UDDS and HWFET drive cycles. Transmission input and output trend remains the same and the magnitudes are changing between transmission input and output for both UDDS and HWFET drive cycles. The wheel speed is following the drive cycle trend for both UDDS and HWFET drive cycles.
Engine torque, engine power, fuel rate, and fuel consumption:Engine torque, power and fuel rate trend is same but the magnitude are different for both UDDS and HWFET drive cycles. Fuel consumption rate changes linearly for both UDDS and HWFET drive cycles.
Accelerator and brake pedal, gear command, vehicle desired and actual speed, vehicle distance:From the plot we can find that more frequent operation of break pedal is found in UDDS drive cycle than in HWFET drive cycle. And also the gear shift pattern changes more frequently in UDDS drive cycle than in HWFET drive cycle. Vehicle desired and actual speed matches the drive cycle trends and it can be observed in both the UDDS and HWFET drive cycles. Vehicle distance changes linearly as the vehicle continues to travel further until the simulation stops and it remains same for both UDDS and HWFET drive cycles.
Engine operating points on the engine fuel map:The dotted line between the two extrems of the engine operating range is the engine operating point and the fuel consumption is shown as a contour plot for both UDDS and HWFET drive cycles and its performance remains same. And the maximum torque curve is plotted which indicate the torque requirements at various opeating speed along with the fuel consumption.