Project - Data Handling and Interpolation
Title of the Project
"DATA HANDLING AND INTERPOLATION"
Aim:-To read the given excel file in MATLAB and Perform the Interpolation for the given range.
Data Handling
The MATLAB runtime works with a single objected type i.e MATLAB array. All MATLAB variables including scalar, vector, matrices, character, cell arrays, structures, and objects are stored as MATLAB arrays.MATLAB stores data in columnwise numbering scheme. MATLAB internally stores data elements from the first column first, than data elements from second column second, and soon through last column.
Interpolation
Interpolation is the process for estimating values that lie between known data points. It's has important application in areas such as signal and image processing.MATLAB provides a number of interpolation techniques that let us balance the smoothness of the data fit with speed of execution and memory usages.
The key MATLAB functions which helps in Interpolation are: interp1 and interp2. IN Engineering aplications, we run through a situation where some x-y data is not available. In those situation we use Interpolation to determine the 'y' values corrosponds to that of 'x' values .The Interpolation options include : linear, cubic and spline among the other.
interp1 is a One-dimensional Interpolation. interp2 is Two-dimensional Interpolation.
MATLAB Program
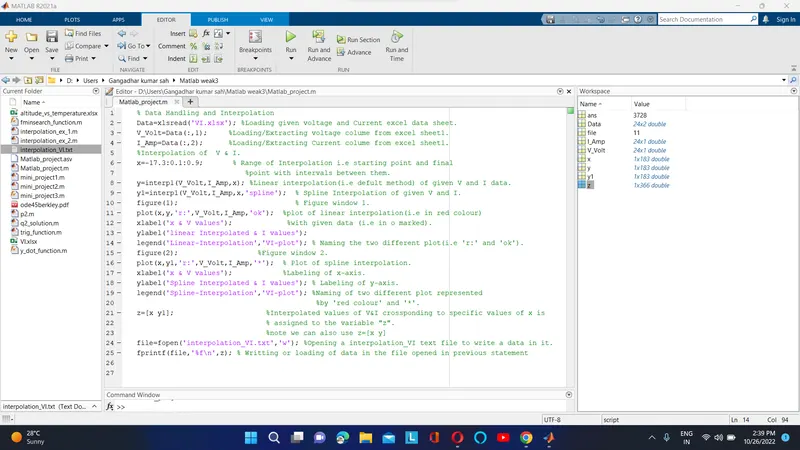
% Data Handling and Interpolation
Data=xlsread('VI.xlsx'); %Loading given voltage and Current excel data sheet.
V_Volt=Data(:,1); %Loading/Extracting voltage colume from excel sheet1.
I_Amp=Data(:,2); %Loading/Extracting Current colume from excel sheet1.
%Interpolation of V & I.
x=-17.3:0.1:0.9; % Range of Interpolation i.e starting point and final point with intervals between them.
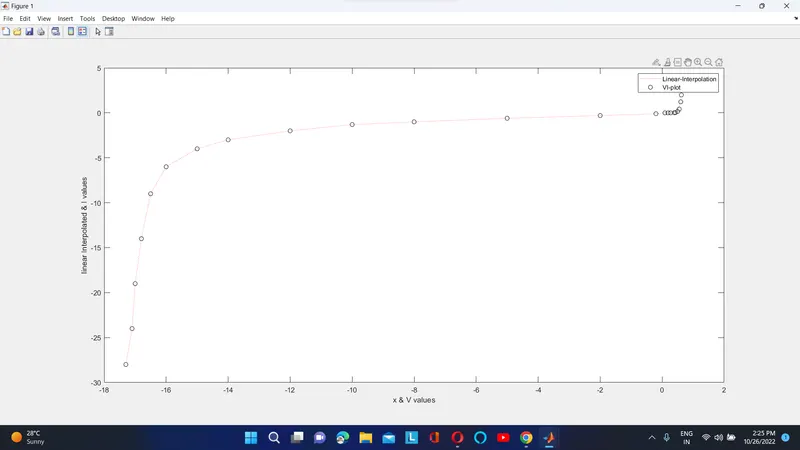
y=interp1(V_Volt,I_Amp,x); %Linear interpolation(i.e defult method) of given V and I data.
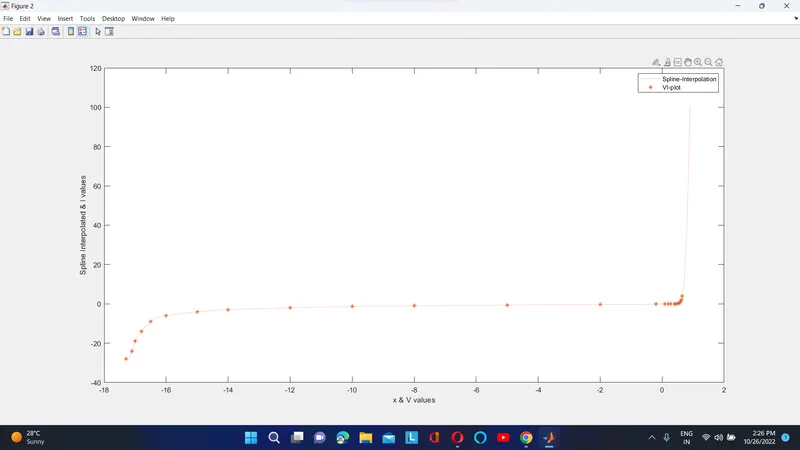
y1=interp1(V_Volt,I_Amp,x,'spline'); % Spline Interpolation of given V and I.
figure(1); % Figure window 1.
plot(x,y,'r:',V_Volt,I_Amp,'ok'); %plot of linear interpolation(i.e in red colour)
xlabel('x & V values'); %with given data (i.e in o marked).
ylabel('linear Interpolated & I values');
legend('Linear-Interpolation','VI-plot'); % Naming the two different plot(i.e 'r:' and 'ok').
figure(2); %Figure window 2.
plot(x,y1,'r:',V_Volt,I_Amp,'*'); % Plot of spline interpolation.
xlabel('x & V values'); %Labeling of x-axis.
ylabel('Spline Interpolated & I values'); % Labeling of y-axis.
legend('Spline-Interpolation','VI-plot'); %Naming of two different plot represented by 'red colour' and '*'.
z=[x y1]; %Interpolated values of V&I crossponding to specific values of x is assigned to the variable "z".
%note we can also use z=[x y];
file=fopen('interpolation_VI.txt','w'); %Opening a interpolation_VI text file to write a data in it.
fprintf(file,'%f\n',z); % Writting or loading of data in the file opened in previous statement.
Flow of execution
Step1:-The given data (i.e excel file) is readed by matlab using 'xlsread' command.
Step2:-The 1st column & 2nd column of excel data sheet which contain volatge & current values is assigned to V_Vout &I_Amp variables respectively.
Step3:-The range of interpolation is defined with intervals of 0.1 as per given data.
Step4:-The Linear interpolation( which is by defult method) is performed.
Step4:-For better or smother results spline interpolation is performed.
Step5:-Both the linear interpolation and spline interpolation is ploted by proper labeling and indication of plot.
Step6:-The Interpolated data is saved as a text file creating a 'interpolation_VI' text file.
Output