Project - Data Handling and Interpolation
Aim:-
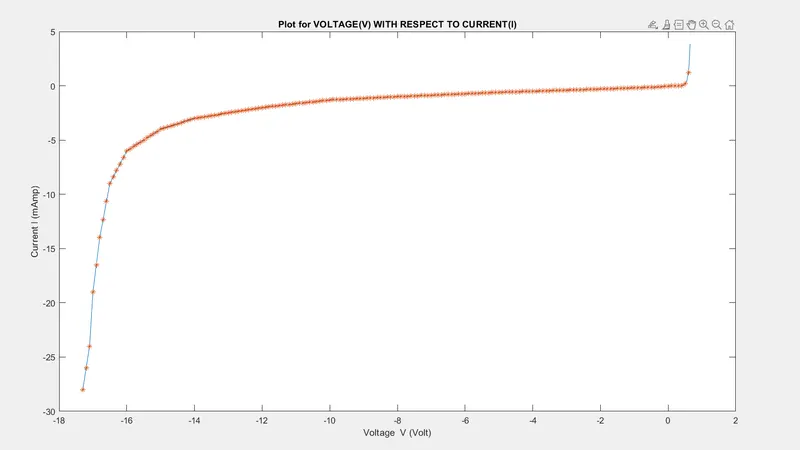
Read the excel file in the Matlab program and perform the interpolation in the range of -17.3:0.1:0.9. Generate the interactive plot for the interpolated data and store them in a text file and find the unknown current and save .txt file .
Solution :-
xlsread :-
xlsread function to read the Microsoft Excel spreadsheet file.
Syntax:-
M=xlsread("file name");
M=xlsread("VI.xlsx");
Defining the voltage with variable ‘v’
Get the voltage ‘v’ from the excel
Below syntax for (V=M(:,1)) for getting the voltage ‘v’, similarly for current I
V=M(:,1);
Defining the current with variable ‘I’
I=M(:,2);
After that we need define the interpolation range with variable ‘x’
x=[-17.3:0.1:0.9];
Interpolation:-
- In engineering application we run into situation where x-y data might not available.
- In those situations, one can use interpolation to determine the y values corresponding to a specific set of ‘x’ values.
- The interpolation options include : linear,cubic and spline among the others
- The key matlab functions to help with interpolation inerpl1 and interpl2
Syntax for interpolation:-
vq = interp1(x,v,xq,method,extrapolation)
vq = interp1(v,xq,method,extrapolation)
- vq= interp1(x,v,xq) returns interpolated values of a 1-D function at specific query points using linear interpolation. Vector x contains the sample points, and v contains the corresponding values, v(x). Vector xq contains the coordinates of the query points.
- If you have multiple sets of data that are sampled at the same point coordinates, then you can pass vas an array. Each column of array v contains a different set of 1-D sample values.
By using above input data to we do the interpl1
P=interp1(V,I,x,'linear');
By using below code plot the voltage, current and p with respect to using x range
plot(V,I,x,p,'*')
By using below code we wrote the title for plot
title('Plot for VOLTAGE(V) WITH RESPECT TO CURRENT(I)')
By using below code we wrote the x-y labels in plot
xlabel('Voltage V (Volt)')
ylabel( 'Current I (mAmp)')
In excel, In sheet 2 we have new voltage (VV) and copy that value and put these values VV variables by using V,I and VV do the interpolation to get unknown current (II)
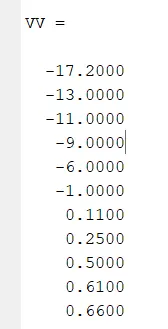
VV = New voltage from excel in sheet 2
VV=[-17.2;-13;-11;-9;-6;-1;0.11;0.25;0.5;0.61;0.66]
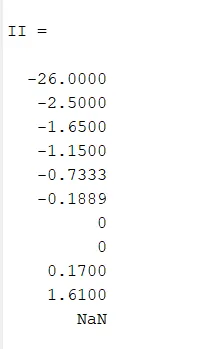
II is the current with respect to voltage VV.By using interpolation we find unknown II
II=interp1(V,I,VV)
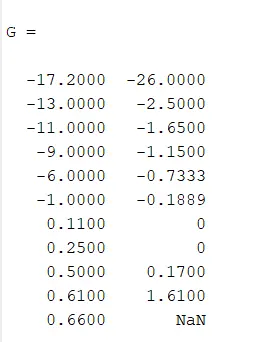
G is variable in which we store the values of VV AND II
G=[VV II]
Below code for to save Unknown Current II current II save txt file.
writematrix(II,' Unknown Current II (mAmp) txt')
Below code for to save VV voltage and current II save txt file.
writematrix(G,' VV VOLTAGE(Volt) & Unknown Current II (mAmp) txt')
Below code for to save inputs from excel sheet 1 V voltage and current I save txt file.
writematrix(G,' V VOLTAGE(Volt) & Current I (mAmp) txt')
Result :-