Project
EV LIVE BATCH 21
- Carry out a system-level simulation of an all-terrain vehicle.
Download the model from the given link:
https://www.mathworks.com/matlabcentral/fileexchange/70576-baja-all-terrain-vehicle-atv-model
Prepare a technical report explaining the model properties & comments on the results.
Aim : To carry out a system-level simulation of an all-terrain vehicle and prepare a technical report explaining the model properties & comments on the results.
AVT - All Terrain vehicle also known as a light utility vehicle (LUV) that travels on low-pressure tires, with a seat that is straddled by the operator, along with handlebars for steering control. It is designed to handle a wider variety of terrain than most other vehicles.
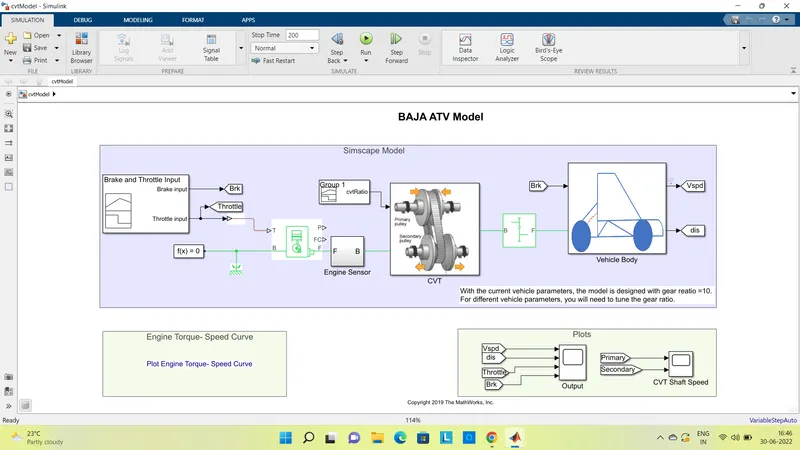
To analyse the performance parameters of AVT by doing simulation, the model is given as,
The general block diagram for the model can be given as,
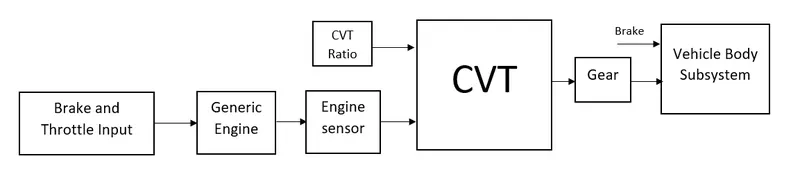
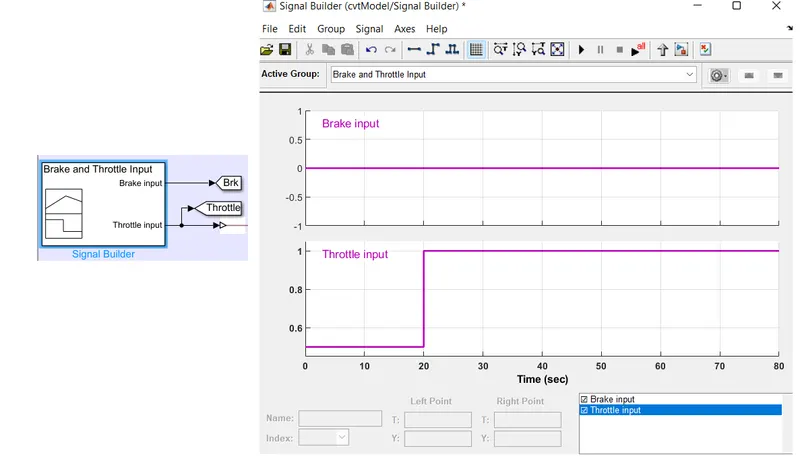
- Brake and Throttle Input: This are the input signals given for the model to analyse the vehicle operating parameters. IT is obtained with the signal builder, as zero brake input, but throttle input changes from 0.4 to 1 at t=20 sec.
- Generic Engine: These input signals are given to the generic engine block represents a system-level model of spark-ignition and diesel engines suitable for use at initial stages of modeling when only the basic parameters are available. Optional idle speed and red line controllers are included.
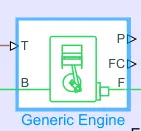
The throttle input signal T lies between zero and one and specifies the torque demanded from the engine as a fraction of the maximum possible torque. If the engine speed falls below the Stall speed, the engine torque is blended to zero. If the engine speed exceeds the Maximum speed, the simulation stops and issues an error message. Connections F and B are mechanical rotational conserving ports associated with the engine crankshaft and engine block, respectively. Connections P and FC are physical signal output ports through which engine power and fuel consumption rate are reported.
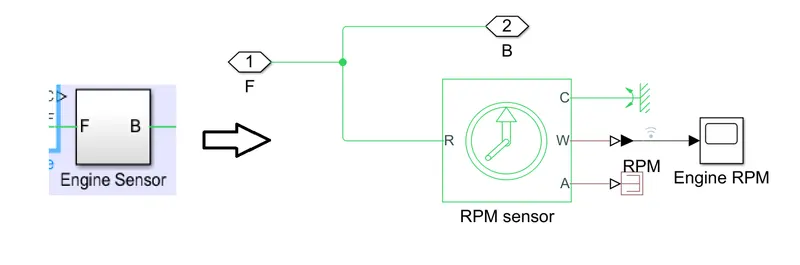
- Engine Sensor: is connected between Enigne and CVT to sense the RPM speed of the engine.
- CVT : CVT is Continuously Variable Transmission, and it is a type of single-speed automatic gearbox seamlessly changes through an unending range of effective gear ratios. For pulley system, CVT consists of cones at each pulley connected via a chain belt. The cones can move to increase or decrease the belt diameter to change gear ratios, allow for quick shifting into the needed ratio for increased power, and boost fuel economy. One pulley in the CVT is connected to the engine and the other directs power to the wheels. The width of these pulleys changes based on the needed power; as one gets larger, the other gets smaller. This allows a CVT to deliver strong and seamless acceleration.
CVT block in the model is given as,
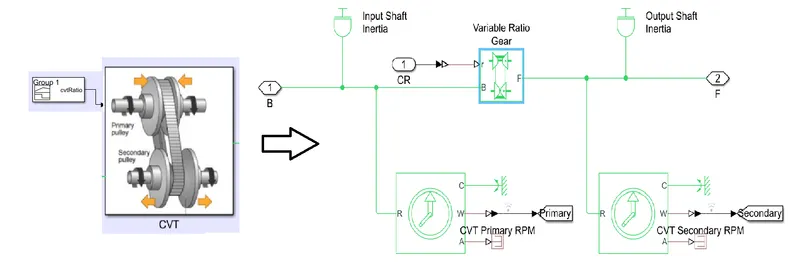
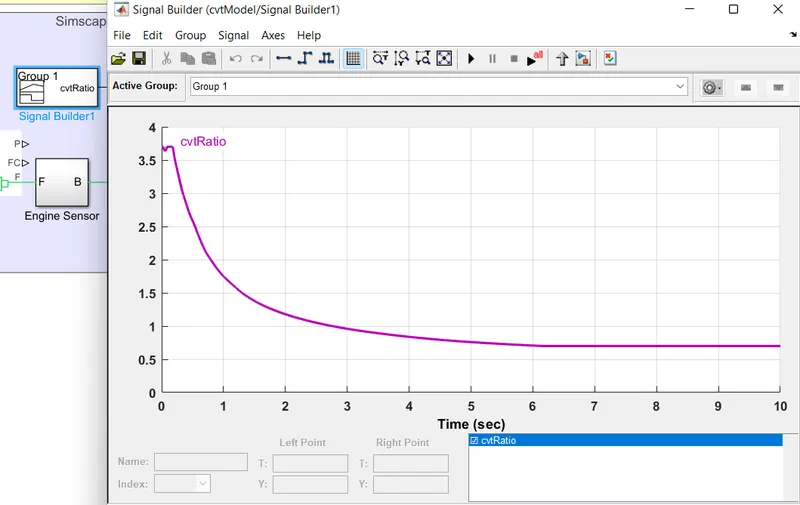
As, CVT does not have a fixed gear ratio, variable gear ratio block is implemented to vary the primary engine RPM and required output driving RPM of the vehicle. This variable CVT ratio is implemented as,
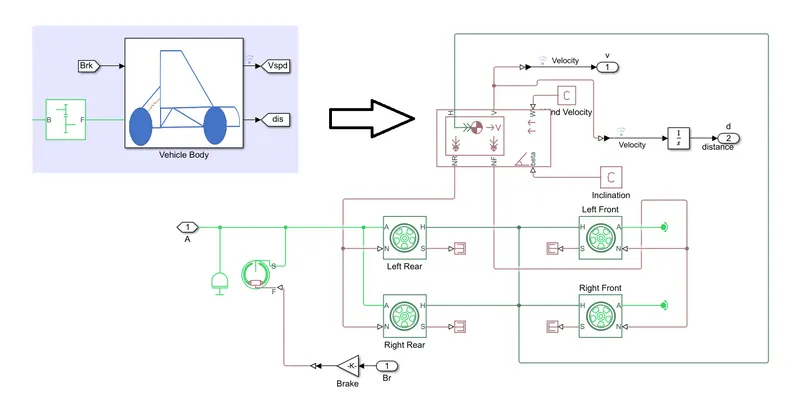
- Vehicle Body : This subsystem consists of arrangement of vehicle body block connected with 4 wheels arrangement and a shoe-brake is also implemented to provide braking effect.
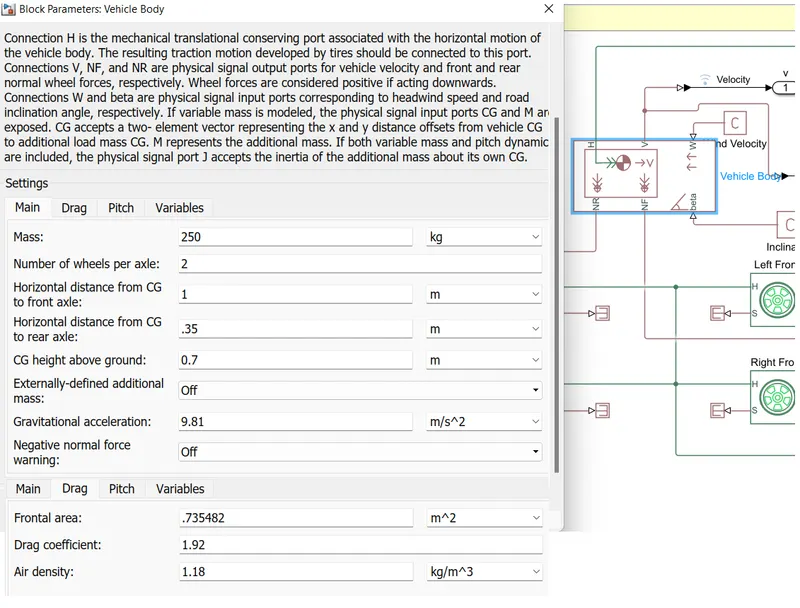
Also, vehicle body parameters are given as,
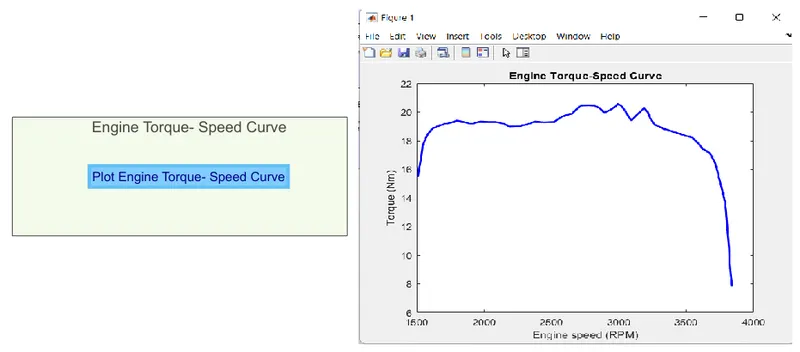
Further more, Torque vs Speed Ratio is given as,
Now, after running the simulation, results obtained are,
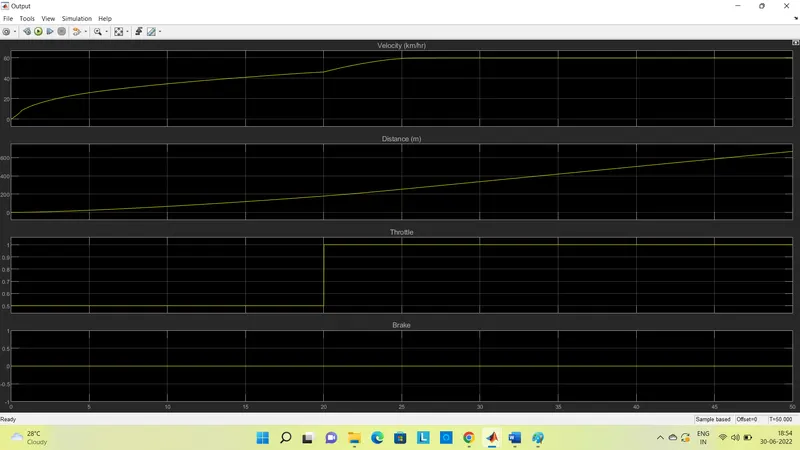
For initial throttle input of 0.5 and no brake condition, Velocity of the vehicle is increasing grdually from 0 to 45 Km/Hr and distance covered by the vehicle is almost 200 meters till 20 sec. At t=20 sed, Max throttle value 1 is applied, and as a result, velocity of the vehicle is further increasing and becomes constant at max 60 Km/Hr within next 5 sec of time. As no brakes are applied, vehicle will continue to run and cover the max distance as long as fuel is available.
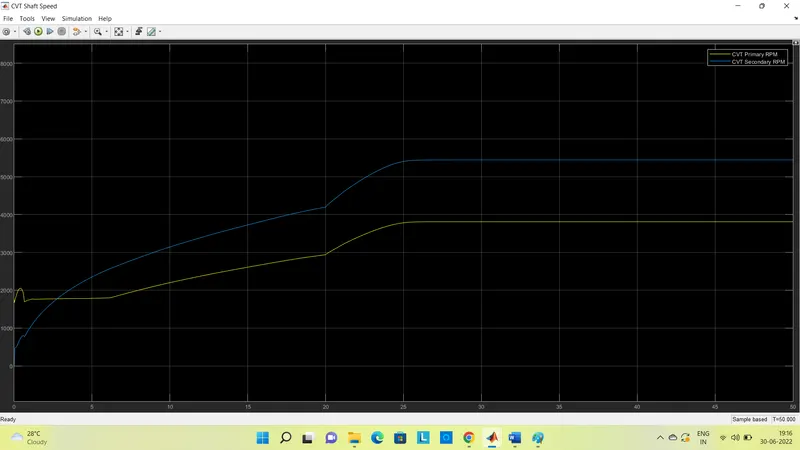
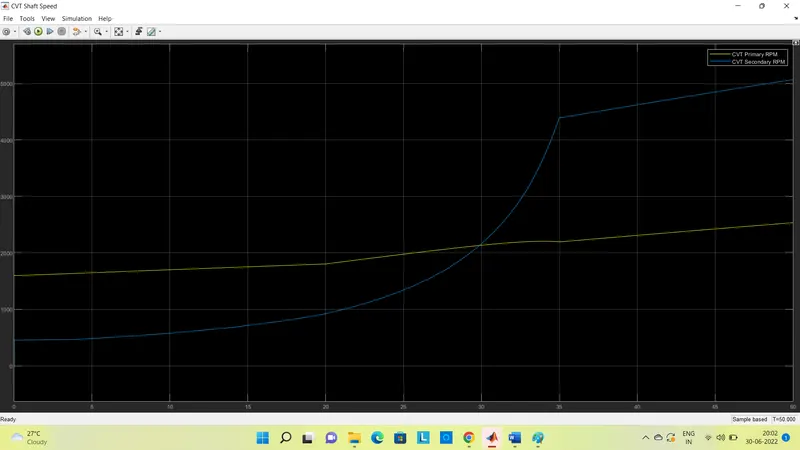
Also, CVT Primary and Secondary shaft speed is given as,
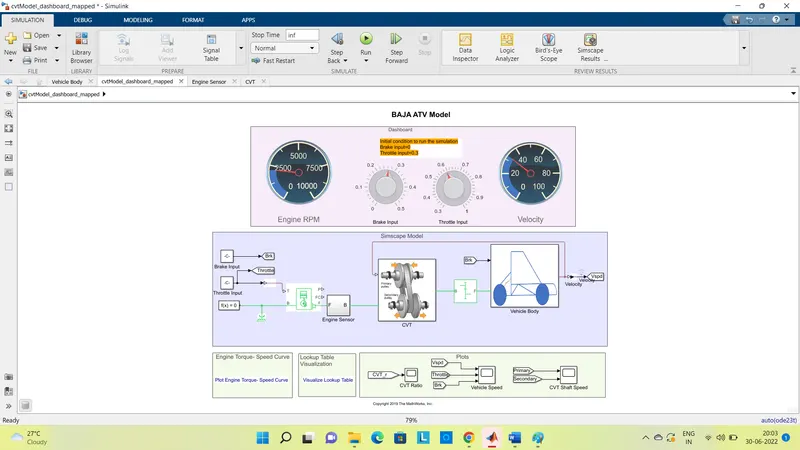
Similarly, this simulation is analysed with the dashboard model. Where, Brake and Throttle input can be varied by means of implemented knobs. The model can be given as,
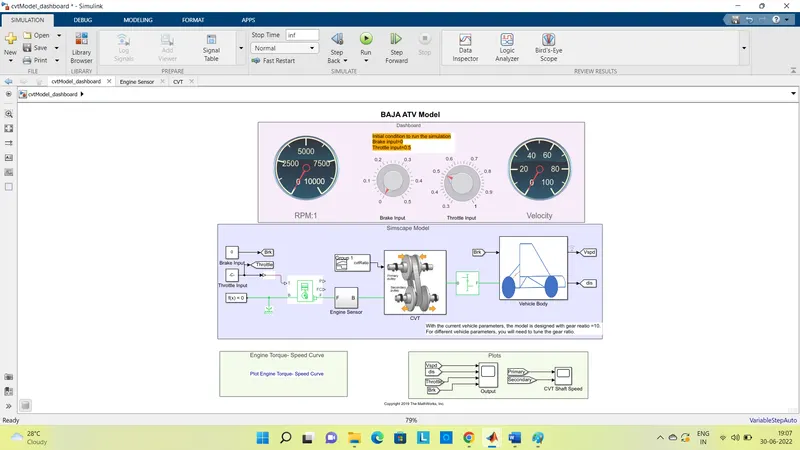
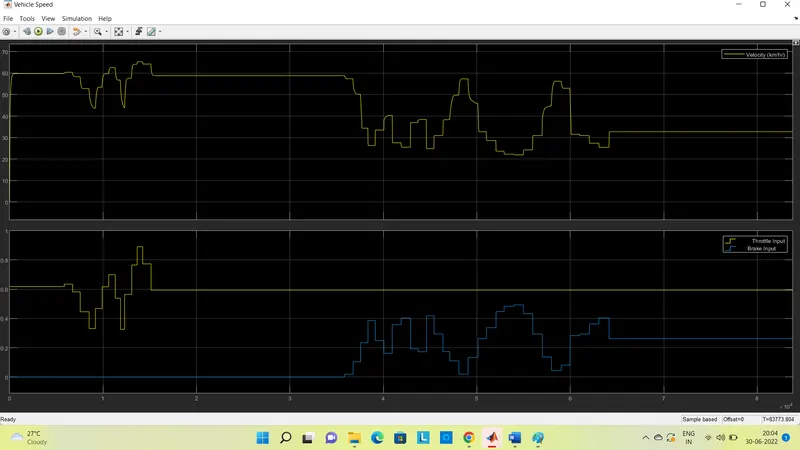
The simulation time is kept infinite, so that results can be obtained for variable brake and throttle values. Initial conditions are mentioned as brake=0, throttle=0.5, later on these values are varied to analyse the results.
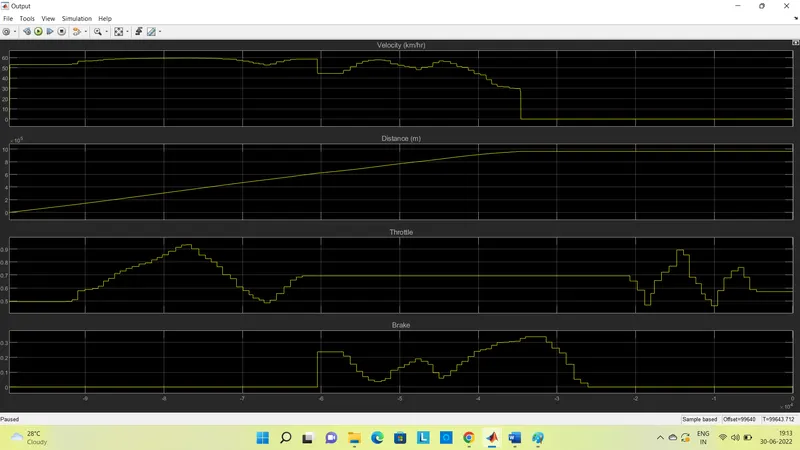
here, it can be observed that, keeping brake input zero, as throttle input changes, velocity of the vehicle changes accordingly i.e. with increased throttle, velocity increases and with decreased throttle, velocity decreases. While, when throttle kept constant and brakes are applied, with increased brake value, velocity decreases and for falling brake value, velocity rises. But there is limitation on applied brake, as brake value goes too high, here more than 0.3, error occurs, velocity of the vehicle falls to zero. After that if we reduce the brake and increase the throttle value, then also velocity does not rises. So, the brake input should have limited value.
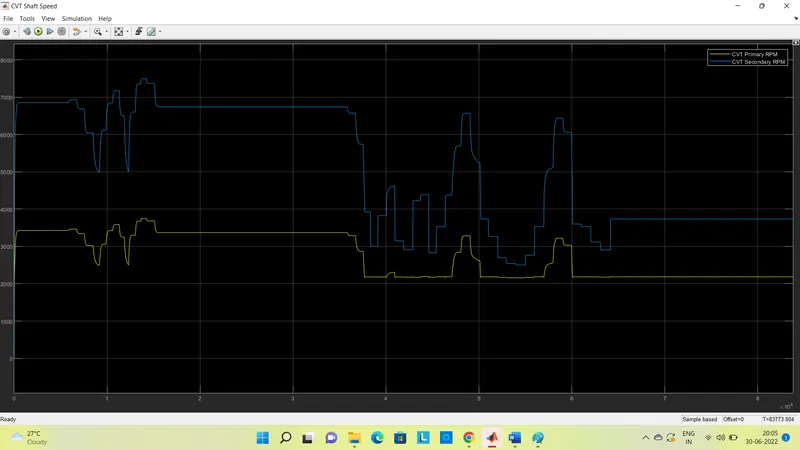
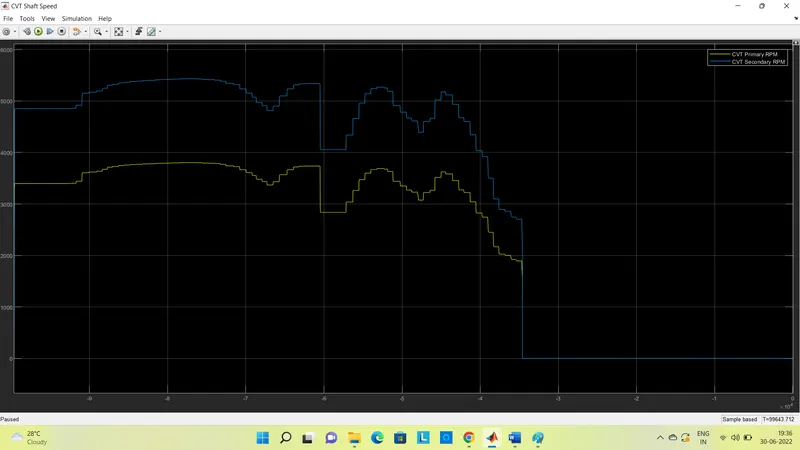
Also, CVT Primary and Secondary shaft speed is given as,
Hence, simulation of an all-terrain vehicle for 2 models, one without dashboard giving fixed brake and throttle input and another with dashboard giving variable brake and throttle input is performed, and analysis of output is done.
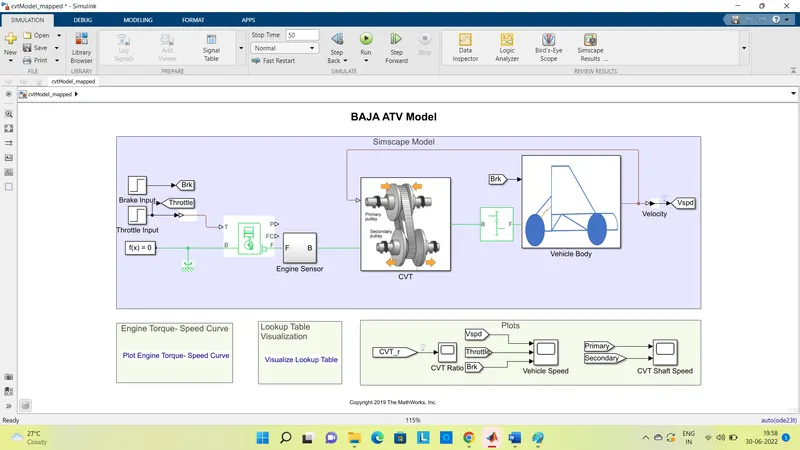
Further more, if the model is mapped with the lookup table data,
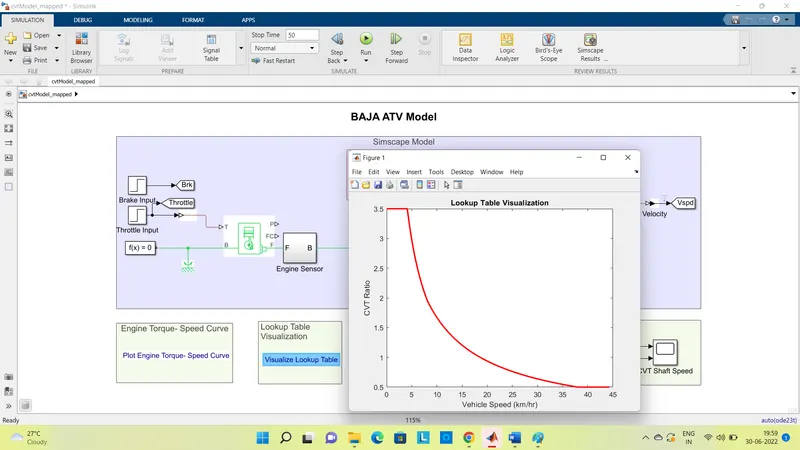
and the lookup table is given as,
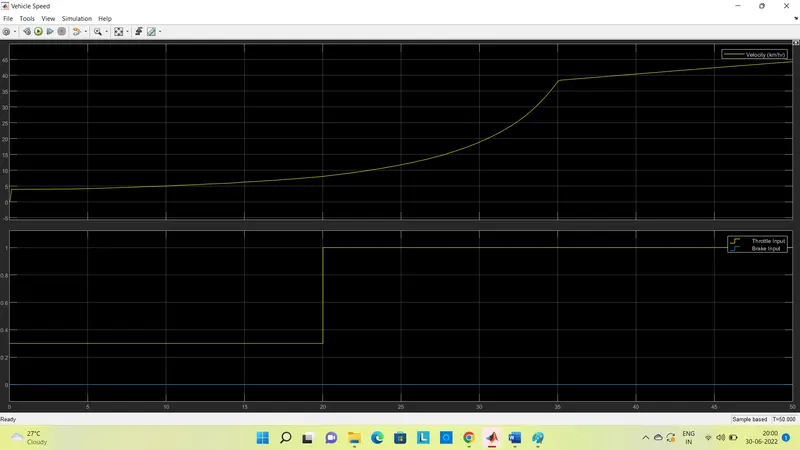
the outputs are obtained as,
Similarly, for the model where dashboard is implemented and mapped with lookup table, model is given as,
And the results obtained are,