Project
the downloaded files are higher version. I have MATLAB R2018b installed on the PC. the files are not compatible with this version. these are the error images that pop up each time i try to open the files.
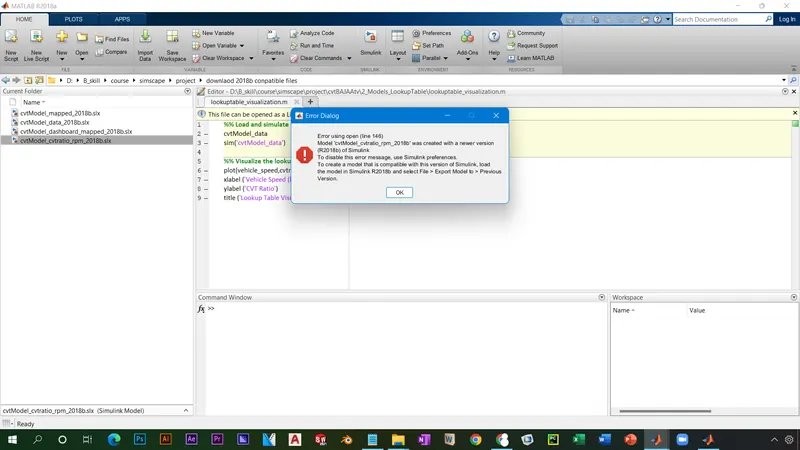
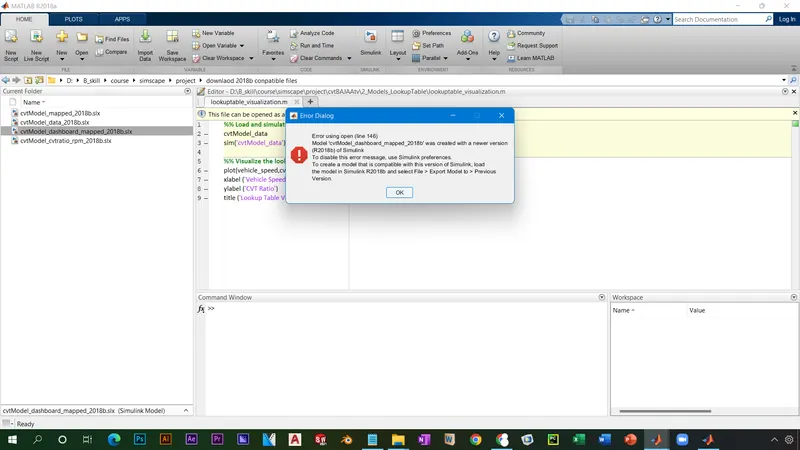
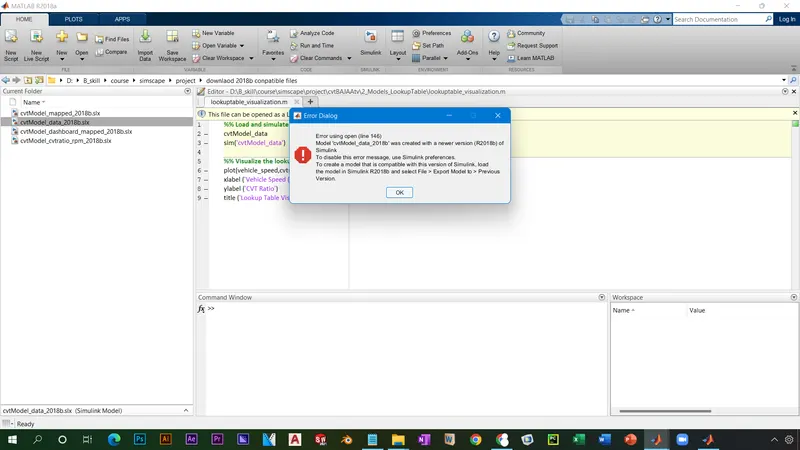
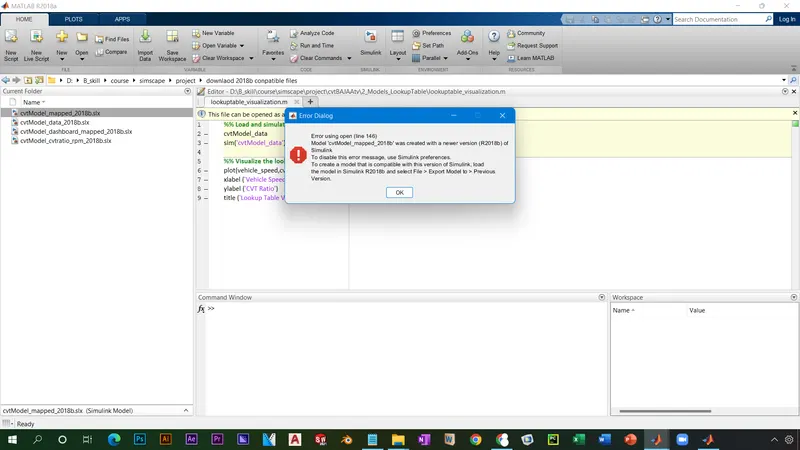
therefore after some assistance on this by scheduling multiple one on one sessions with support engineers, i modified the preferences panel. still the library is not updated as the original files are from a newer version of MATLAB. these are the screenshots. library files are missing. so the graphs cannot be plotted.
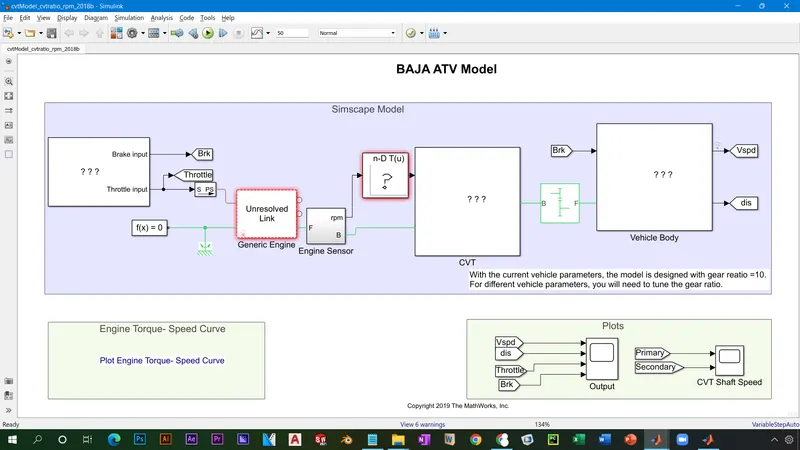
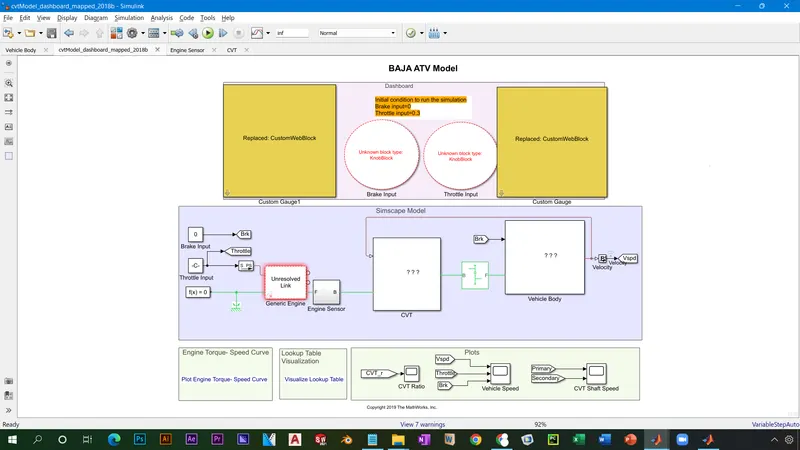
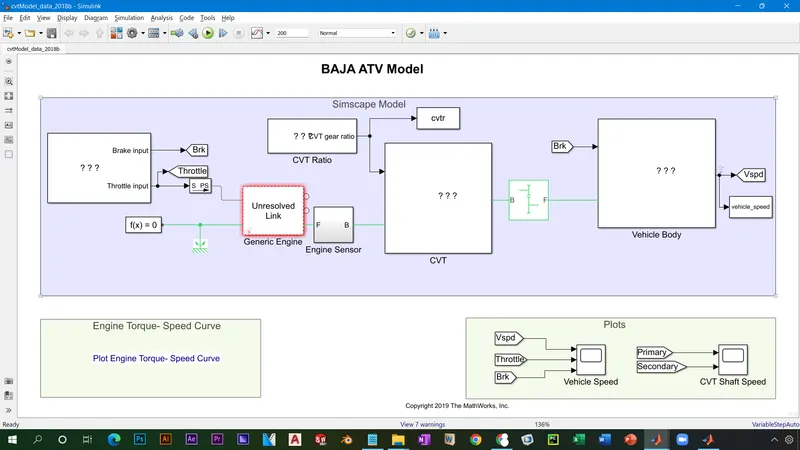
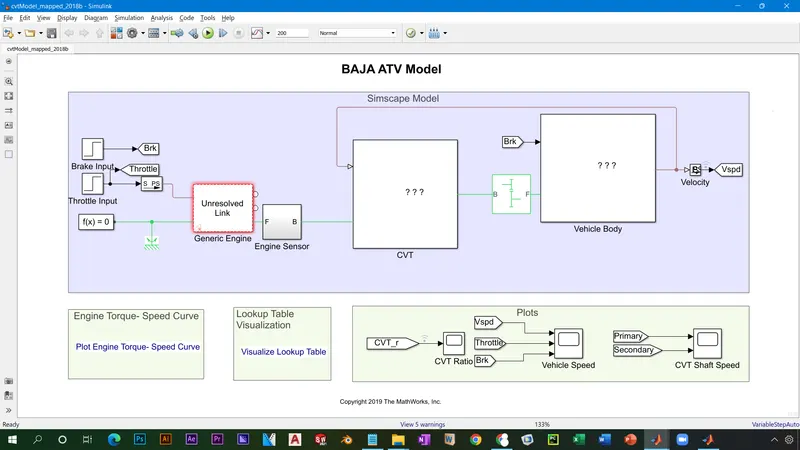
when double clicked on the blocks, this pop up appears.
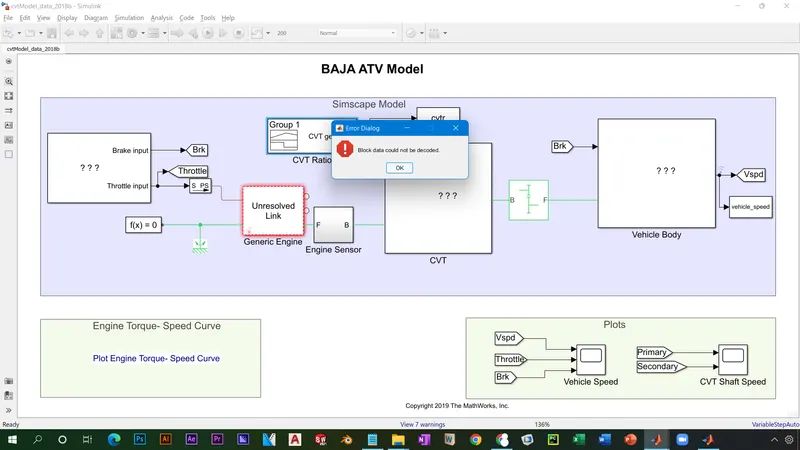
therefore i am limited to explore this project but i have tried my best to justify the learning. following is the project report:
AIM of project:
to study the effect of variation of several parameters of the components of BAJA ATV with respect to the vehicle speed by modifying throttle and brake inputs, CVT shaft speed, engine torque-speed curve considering gear ratio to model, simulate and analyse the system.
1. brake and throttle inputs are given to the system in the form of signal generated by the signal generator.
2. they are converted into physical properties and fed into the generic engine.
3. RPM sensor outputs the engine RPM to the CVT block, to which the CVT signal generator is attached. the output is also fed to the workspace.
4. simple gear is attached outside the CVT and is fed to the vehicle body. which outputs the vehicle speed.
Components are:
1. vehicle body
2. suspension
3. Tyre
4. CVT
5. Engine
Engine rpm and torque info was taken by a practical source and the data is fed in the system. (engine torque speed curve).
in the CVT transmission system, when the radius of primary pulley is greater than that of secondary pulley, overdrive takes place. when the opposite happens, speed reduction takes place. variable gear ratio is generated here.
simple gear ratio is used for speed reduction after CVT in both the open and closed loop systems.
in the vehicle body block following are specified:
1. mass
2. number of wheels per axle
3. horizontal distance from CG to front axle
4. 3. horizontal distance from CG to rear axle
5. CG height above ground
then simulation data inspector is used to plot and analyse the graphs.
primary and secondary rpm is studied by changing the CVT ratio.
this above is done for the open loop model.
for the closed model following are the changes (above simulation process is same):
1. CVT signal builder is removed.
2. feedback of the vehicle speed is fed to the CVT block.
3. as a result, required amount of CVT ratio is calculated .
in close loop system, we need to run the lookup table visualisation first, then carry out the simulation.
Results:
1. real world data was used and put into model to simulate, analyse and infer the results of graphs.
2. various designs and parameters were analysed.
3. sufficient realistic data was used to model real world problems.
4. practically, the closed loop system is more efficient than the open loop system as the CVT ratio is continuously changed and fed into the CVT block. this provides better control than using separate CVT gear ratio signal builder to give input without any feedback.
5. when the brake is applied the velocity gradually decreases and when the throttle is applied the velocity gradually decreases. according to the velocity-distance-throttle-break graph.
6. this affects the distance travelled as well.
7. the change in the CVT ratios is also plotted. (closed loo system)
this model can also be studied by feeding input of any other real world data and analysing the results separately.