Project
Aim: To study the system level simulation of an all terain vehicle and explain the parameter, input value selections and prepare a technical report.
Objective:
- Understanding the models.
- Explain the process/steps involved.
- Explain the working
- Explain the reasons for the steps used.
- Run the models and study the results.
Theory:
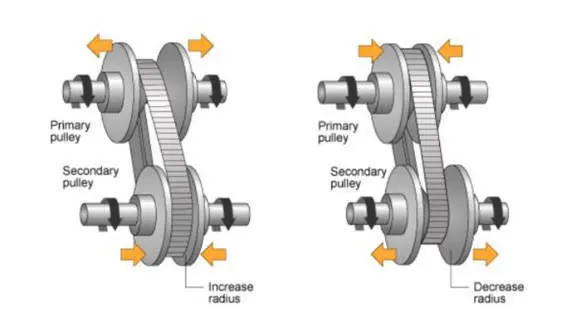
Continious variable transmission (CVT) is a automatic transmission system which can vary the gear ratio seamlessly and effectively without any steps input. There are two pullys which have conical shape variators on the either sides of the pulley. These are seperarted or contracted based on the input and output shaft speed for the specified torque needed, these seperarted or contracted (variators) cones of the pulley cause the diameter of the pulley to change. If the two variators are contracted or bought closer the diameter of the cone increases. The pulley connected to the output shaft of the engine is called as driver pulley or primary pulley and the pulley conected to the output shaft is called driven pulley. When the primary pulley diameter is smaller than the secondary pulley the condition is called as gear reduction and if secondary pulley is smaller than primary pulley this condition is called as overdrive. The gear ratio is selected carefully for the torque and engine speed data of the engine. Generally these CVT have infinite steps which are switched according to the requriement.
Body of the content:
- There are 4 models under study.
- Two of them are open loop and two are closed loop.
- Complete information on them is described below.
Model-1:(Open loop)
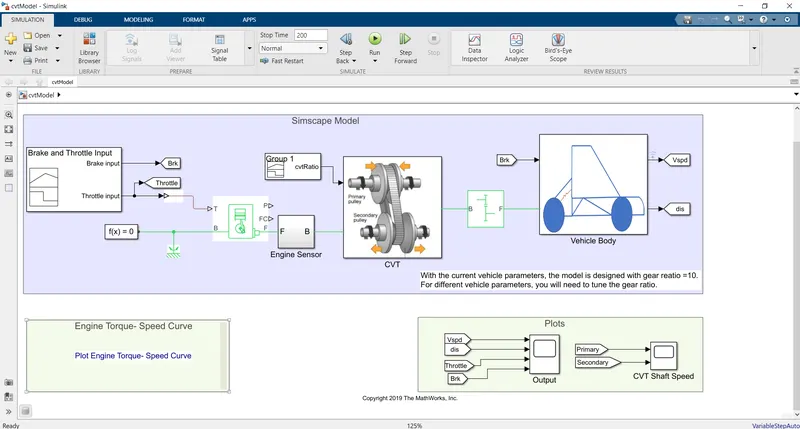
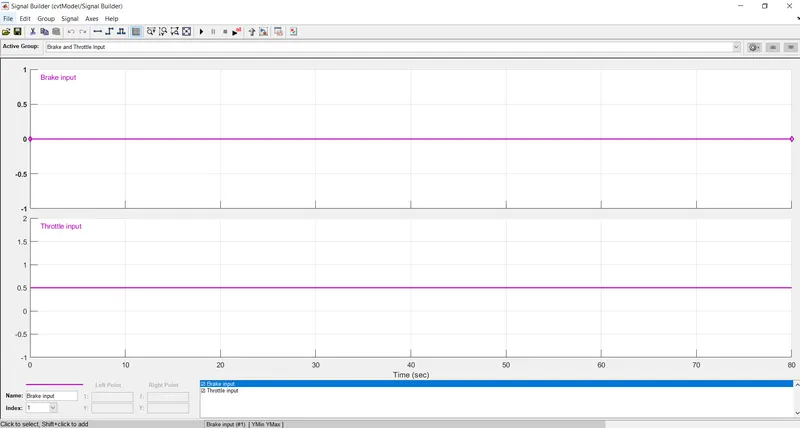
- The figure shows the CVT model with the input from the signal builder.
- In this model input is given from the signal builder for throttle and brake as shown.
- The components/blocks used in this model are:
- Signal builder block.
- Generic Engine block.
- CVT.
- Simple gear.
- Vehicle body.
- Simulink PS converter.
- Configuration solver.
- Mechanical rotational reference.
- Scope.
- Here the throttle is maintained at 0.5 for 80 sec and the brake is zero.
- The throttle input the fuel rate input in the engine, as the throttle value increases the amount of fuel feed also increases, this increases the power output.
- The simple gear block is used to connect the engine to CVT.
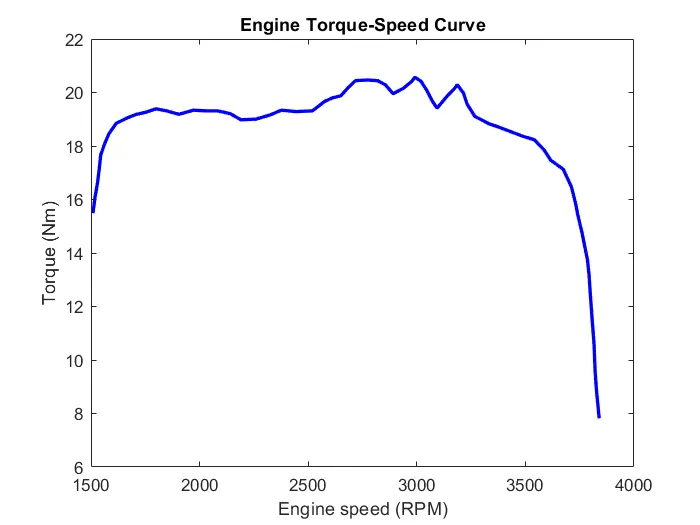
- The simple gear ratio is calcuted by the graph of rpm and torque achived.
- For the correct gear ratio the torque must be able to move the vehicle for all the engine speed (rpm) of the engine.
- For this the graphs of the outputs are studied i.e. torque, speed and velocity.
- By comparing the various gear ratios the gear ratio of 4 is considered for simple gear.
- Because other gear ratios has lower torque or achive every high speed giving more torque than an appropriate balance between speed and torque.
- The engine torque and speed curve gives the relation between the output torque for the given engine speed.
- This data is given the form of the image and is converted into data points by the extensions in matlab called GRABIT.
- The Vehicle body subsystem represents the body of the car with Tyres and brake systems.
- The Vehicle body subsystem contains:
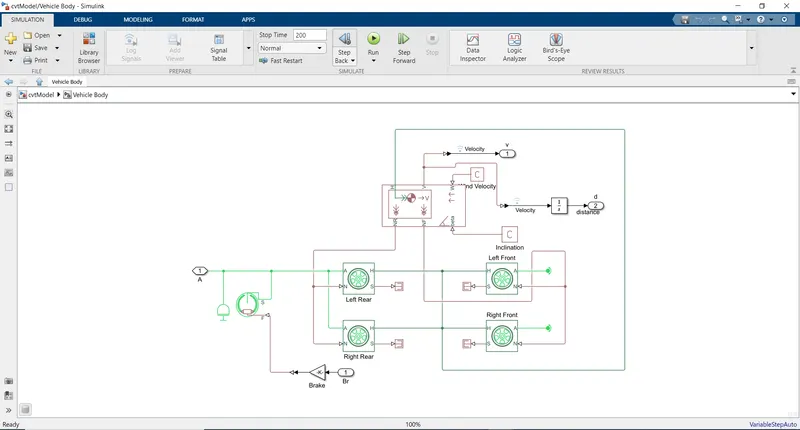
- Vehicle body block.
- The vehicle body block represents the vehicle body with two axles.
- The properties of the vehicle body like wieght (250kg), number axles, center of gravity, drag and any additional mass are given as input.
- Beta input shows the inclination.
- W input port is used to input the head wind speed.
- V is the vehicle velocity output port if integrated the distance can be found.
- NF and NR are ports for normal forces on the front and rear tyres respectively.
- Tyre blocks:
- It represents longitudinal behaviour of the tyre characterized by the magic formula.
- Connection N is used to input the normal force force acting on the tyre normally.
- Connection S is output port representing the slip of the tyre.
- Connection H is the mechanical translation conservation ports.
- Connection A is the mechanical rotation conservation port.
- The parameter like rolling radius, tyre inertia, rolling resistance and velocity threshold are the variable dependent or independent variable.
- For more realist results from the tyre the variable need to be varied according to the characteristics needed.
- Double shoe Brake:
- Represents the brake arrangments which may be situated inside or outside the drum, when the actuator is operated it causes friction on the drum and causes resistance in the motion of the shaft.
- Connection S is conserving rotational terminal for the drum shaft.
- Connection port F is the input force to the actuators.
- Drum radius, Actuator location radius, Pin location/angle, Shoe beginning/span angle and friction are the variable inputs.
- Inertia of the output shafts:
- The block is used to represent the interia of the output shaft.
- Vehicle body block.
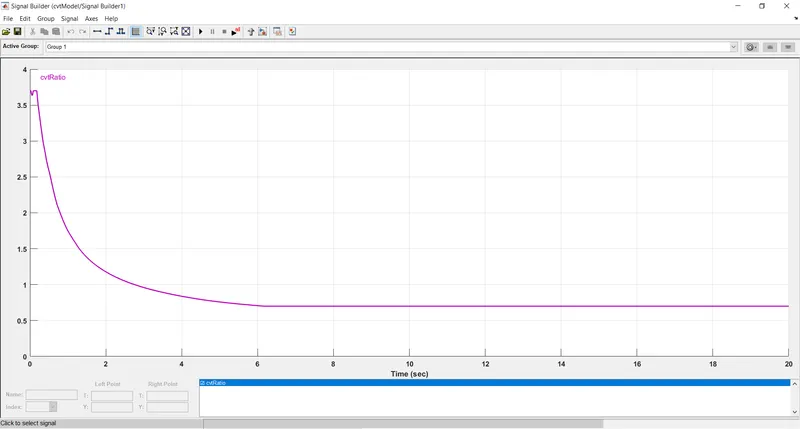
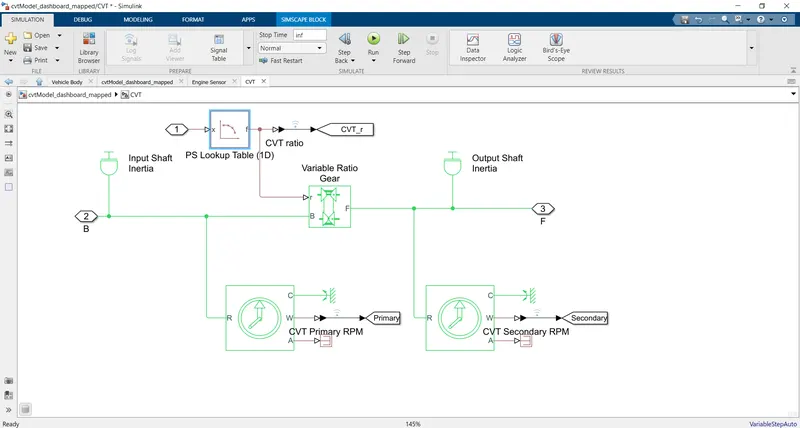
- CVT subsystem represents the CVT with its components.
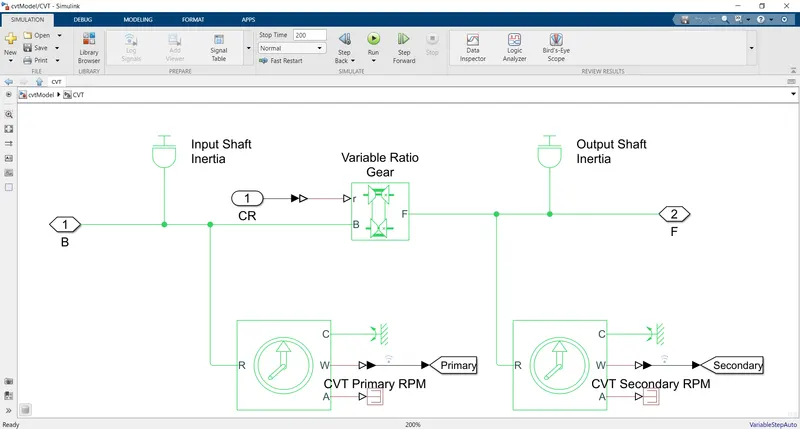
- The signal builder block is use to give CVT gear ratio input.
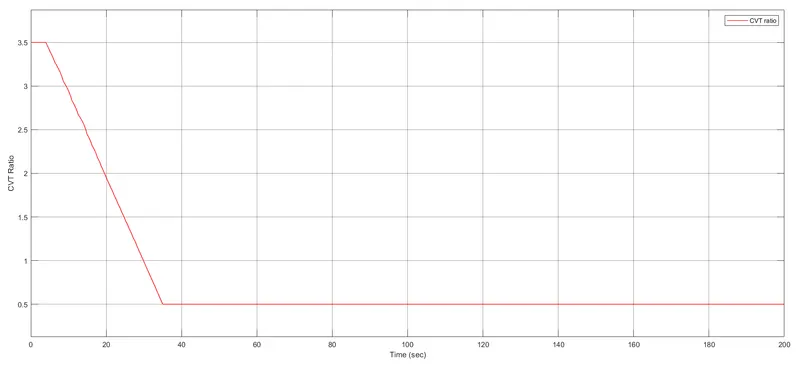
- The CVT gear ratio is varied from 3.7 from begining to 0.7 at end.
- The CVT subsystem contains the following blocks:
- Variable ratio gear block:
- Connection r is the input for the ratio of output to input shaft velocities.
- The stiffness and damping of the transmission, Transmission losses and Viscous losses are variable inputs for this block.
- Inertia blocks:
- Are used for inertia calculation of input and output shaft.
- Ideal rotation motion sensor:
- These sensors are used to measure the rotational speed of the input and output shaft.
- Variable ratio gear block:
- Generic engine block is used to represent the system level modeling of the spark-ignition and diesel engines used for initial stages of modelling.
- The engine torque (speed and torque vector), inertia, Initial velocity (1750 rpm), speed threshold, fuel consumption and speed control are the variable inputs to the engine blocks.
- Effect of parameter variation:
- The effect of the vehicle wieght on the velocity is studied for the different mass i.e. 100, 140, 180, 250kgs
- The effect of variation of different parameters are studied by variying the CVT ratio.
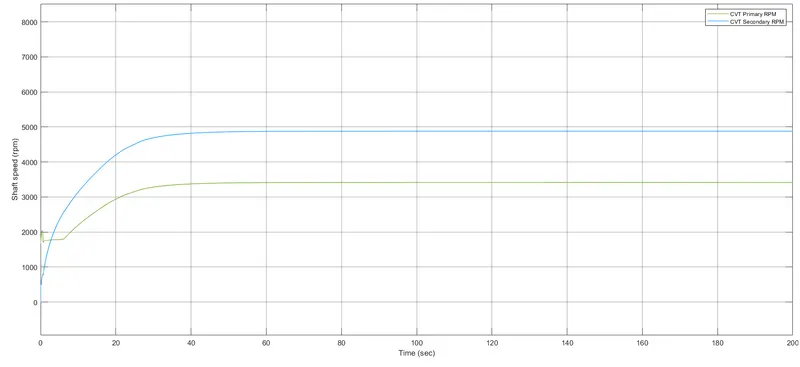
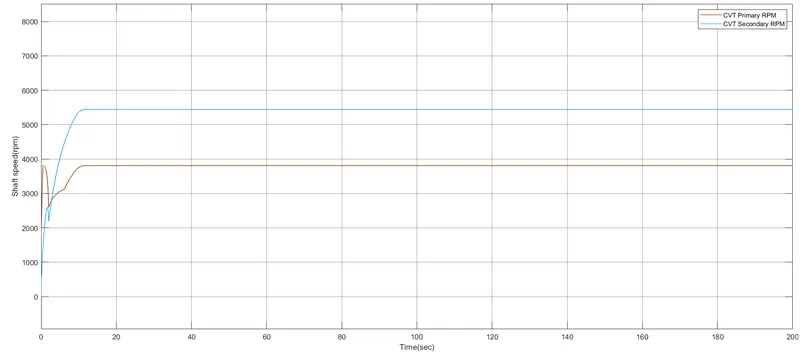
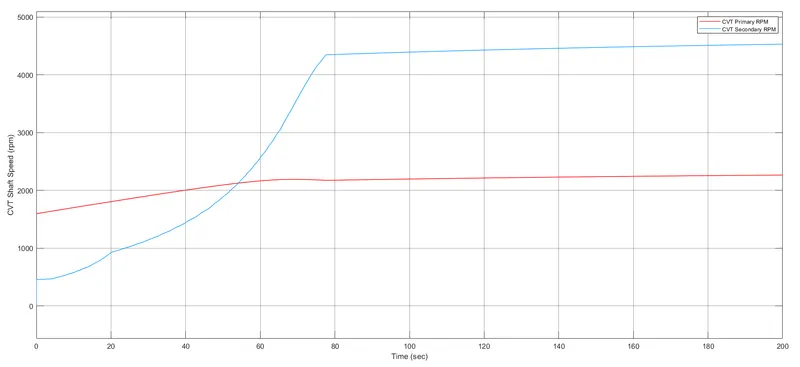
- The CVT ratio is kept constant for 4 seconds, for this there is higher primary shaft speed than secondary.
- Then CVT ratio is varied fromm 2.4 to 0.5 for next 31 seconds, here a point comes were the the secondary shaft has higher speed than primary i.e. CVT ratio is less than 1.
- Then CVT ratio starts increasing from 0.5 after 35 seconds, while this the primary and secondary shaft speed converge at point where the CVT again becomes 1 (at 52.4 seconds).
- At initial speeds the seconday shaft speed is similar vehicles speed, because its connected to wheels directly.
- This parameter variation can be vary helpful in finding the optimum values for the input and output data for the given range of the CVT ratio.
Model-2: With dashboard(Open loop)
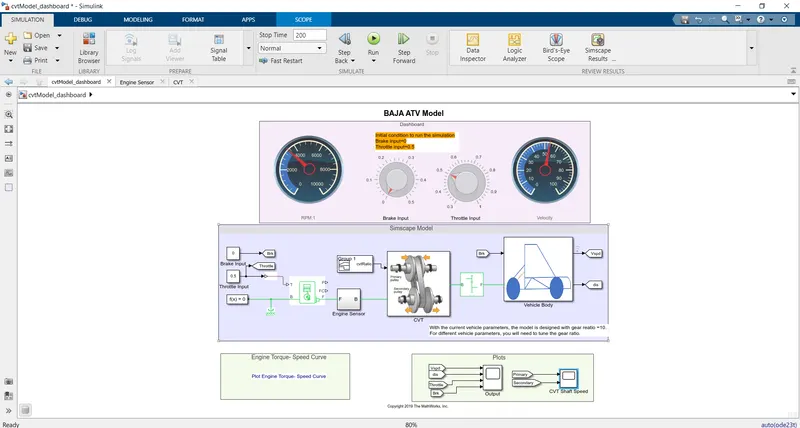
- This model is same as the previous model-1 but instead of the input of brake and throttle from the signal builder the input is given/varied by the knobs in the dashboard.
- All the other parameters are same as the previous model but with addition as dashboard.
- The dashboard allows for greater flexibilty for the input of throttle and brake as compared to the signal builder block.
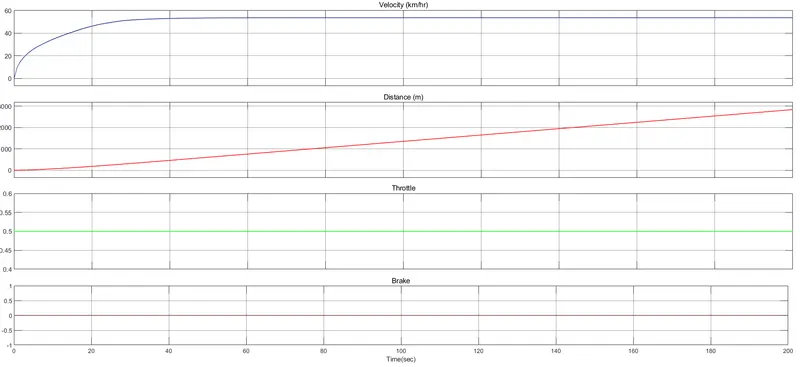
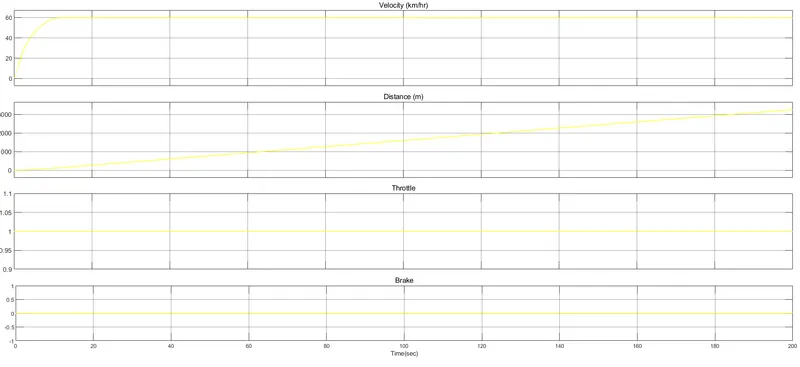
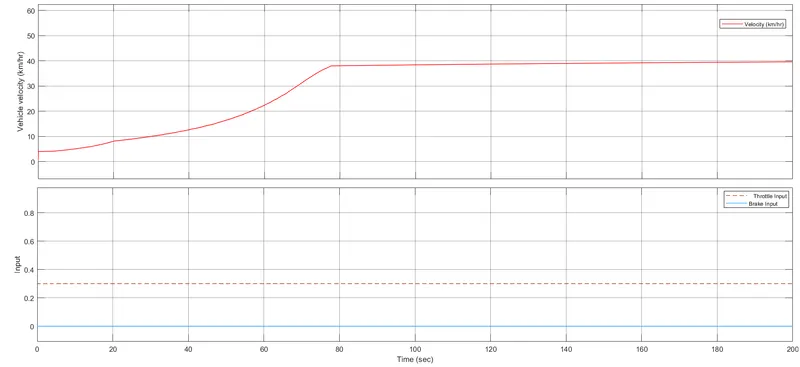
- Here also the throttle is 0.5 and brakes at 0, simulation time is 200 seconds.
- The simulation time can be set to infinity and the throttle and brake inputs can be varied to study the characteristics of the CVT ratio and the velocity of the vehicle speed.
- In the above studies the CVT ratio and the throttle is given manually but speaking of the real life situations CVT ratio is dependent on the vehicle velocity.
Model-3: (Closed loop)
CVT subsystem:
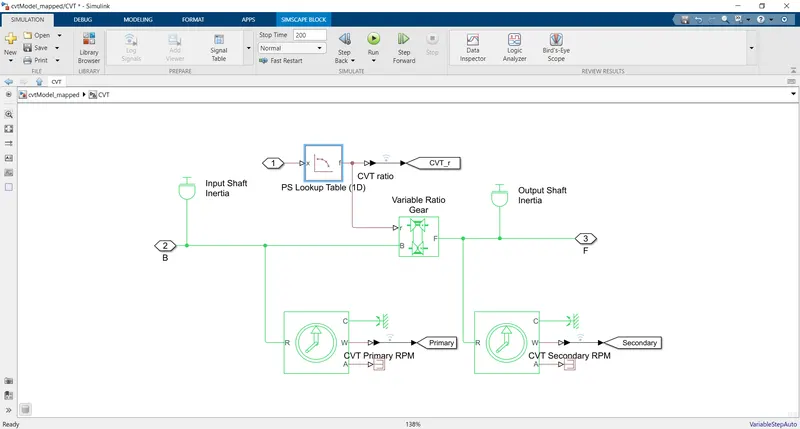
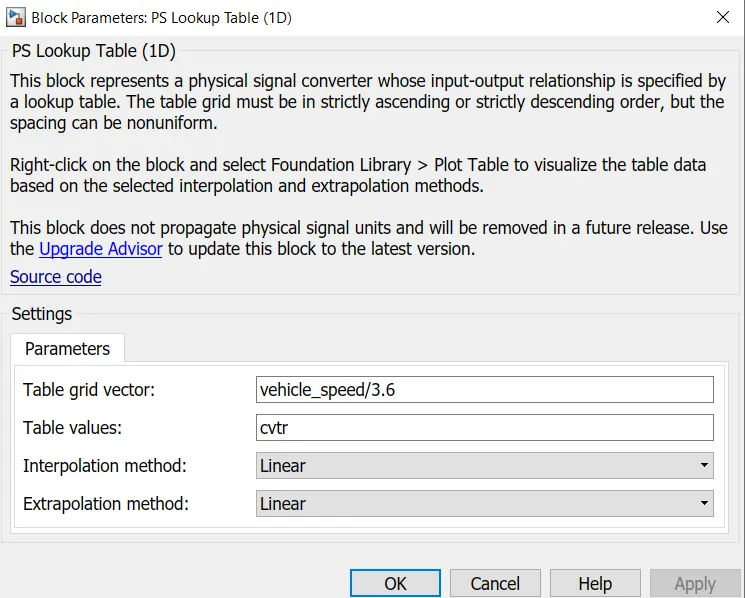
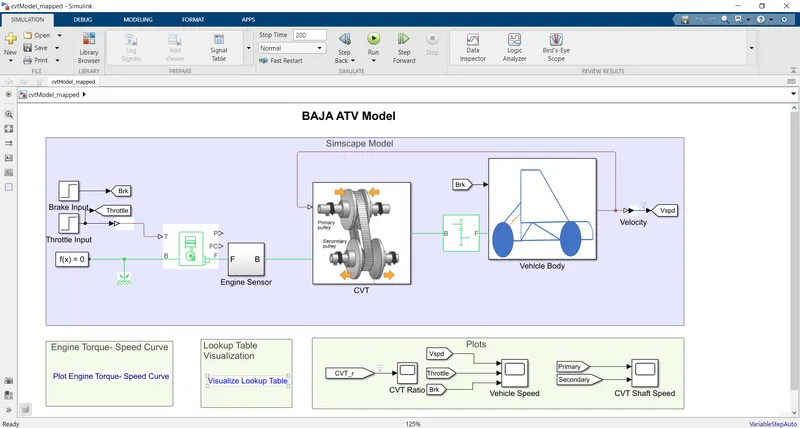
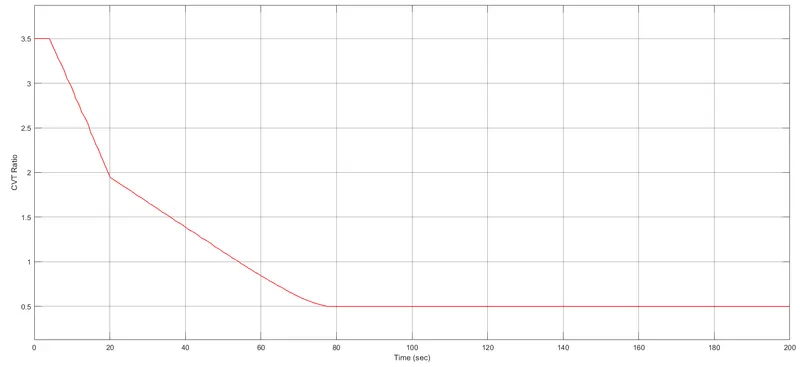
- The above figure shows the model-3 setup were the realististic inputs to CVT ratio are given as the function of the velocity.
- This model is a closed loop model because the values for the CVT ratio are calculated with respect to the vehicle velocity rather than hard inputs.
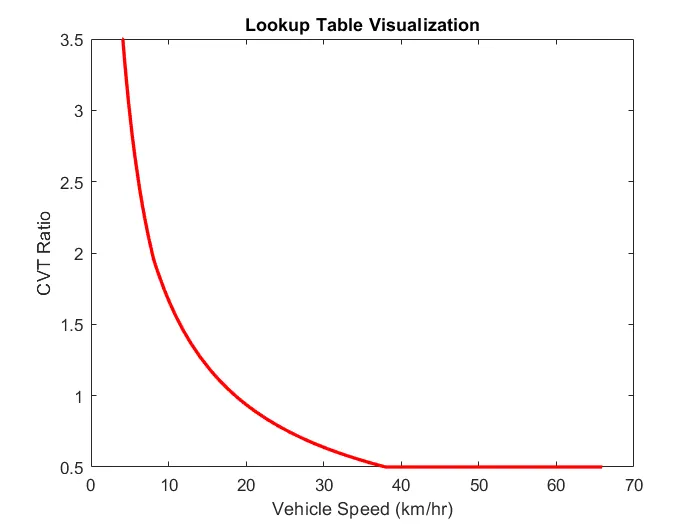
- The CVT ratio vs Vehicle speed(kmph) graph is taken which is plotted by using the matlab program, here to obtain the graph the following steps are followed:
- The precalculated values of the CVT ratios are given input to the CVT subsystem by the signal builder.
- The corresponding velocity of the vehicle is noted for the corresponding CVT ratio from signal builder.
- Then these values are plotted and the graph is obtained.
- The CVT ratio vs velocity graph gives the CVT ratio for the corresponding speed, this data is used for the selection of the CVT ratio for the particular speed of the vehicle.
- The CVT ratio vs Vehicle speed graph is used in the lookup table for the input to the CVT block.
- For this operation th PS Lookup Table is used.
- The PS Lookup table converts the physical signal whose input and outputs are specified in the lookup table.
- The construction of the model is similar as the Model-1 but the CVT ratio input is real time with respect to the vehicle velocity, instead of the predescribed value as input from the signal builder.
- The Throttle and break input are from the predefined set blocks.
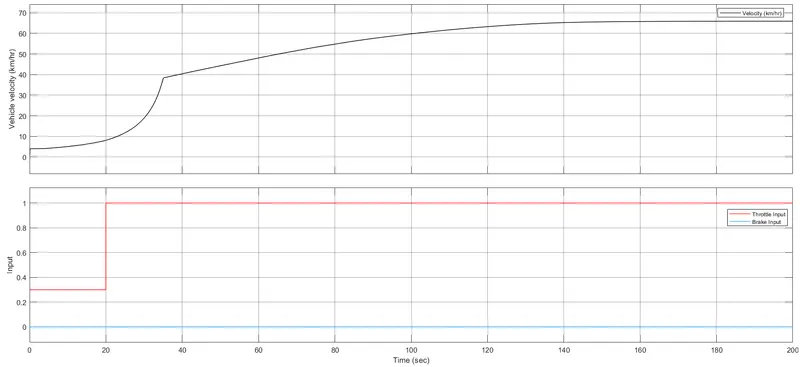
- The initial value of the throttle is 0.3 and the final is 1. for the step time of 200 seconds.
- The values for the brake are set to zero for this study.
- The selection of the CVT ratio is done by using look up table using the vehicle velocity feedback.
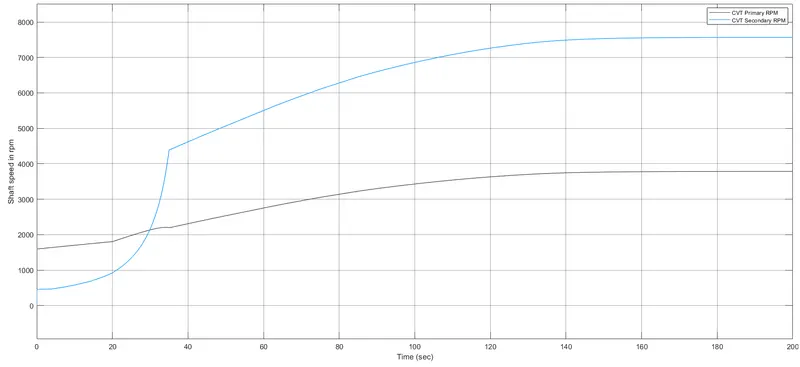
- In these models(3 and 4) the calculations are more realistic as the inputs are in real time calculations.
Model-4: With dashboard(Closed loop)
CVT subsystem:
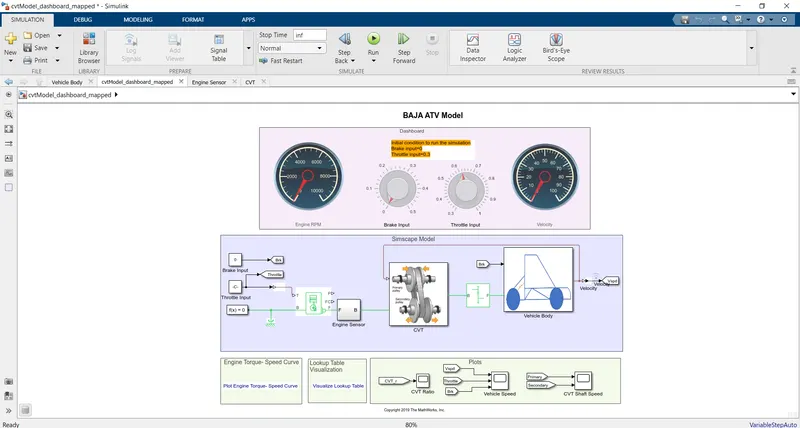
- The above figure shows the model-4 setup with the addition of the dashboard to the model-3.
- Here the throttle and brakes inputs are given while the simulation is runnning rather than hard inputs from the step blocks.
- This model is similar to the model-3 but the throttle and brake inputs are given in real time while the simulations is running.
- Model-4 is a closed loop model as the CVT ratio is not a predefined hard input but depends on the values of the vehicle speed(kmph).
- The simulation is run for set time as infinity and the input to the throttle and brakes is given while the simulation io running and when the study is carried out the simulation is stopped by stop command.
- This model provides more flexibility for the study of the effect of various inputs on the vehicle performance.
The effect of vehicle body weight is studied for different vehicle weights and the results show that as the weight increases it takes more time to attain the speed corresponding to the throttle input.
The effect of CVT ratio is also studied and the range of CVT ratio is selected so that desired output range(for corresponding torque and speed) are achived as explained above.
Results:
These are the output of the all 4 models.
Time - seconds
velocity - kilometer per second
Distance - Meter.
- Model-1:
- Output:
- CVT Shaft speed:
- Model-2:
- Output
- CVT shaft speed
- Output
- Model-3:
- Output
- CVT shaft speed
- CVT Ratio
- Reference graph for the lookup table of torque:
- Reference for the lookup table for CVT ratio:
- Output
- Model-4:
- Output
- CVT Shaft speed:
- CVT Ratio:
- Output
Conclusions:
- The models (BAJA ATV)and the tests runs are throughly studied and there variations with respect to the inputs are observed.
- The models are completely explained in terms of construction and process followed.
- The output of the vehicle speed with respect to the throttle, CVT shaft speed, CVT ratio and the graphs considered for the corresponding inputs for the torque, velocity and the CVT ratio are shown in the results.