Project
Aim: Prepare a technical report explaining the model properties & comments on the results.
Introduction:
an all-terrain vehicle (ATV) is defined as a motorized off_highway vehicle designed to travel on four low-pressure or non-pneumatic tires, having a seat designed to be straddled by the operator and handlebars for steering control.
The transmission transmits the power from the engine to the wheels through the shafts. it consists of 4 types mainly
- manual transmission
- continuous variable transmission
- semi- automatic transmission
- automatic transmission
STUDY-1
BAJA ATV WITH CVT
Continuously variable transmission drive(CVT)
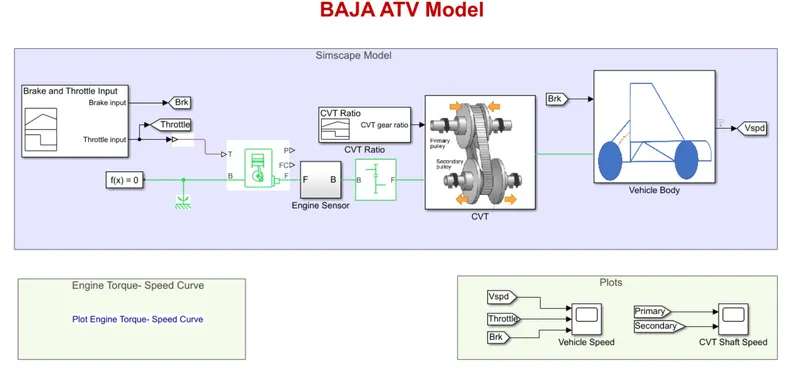
Using the Simulink model of CVT consists of
- signal builder
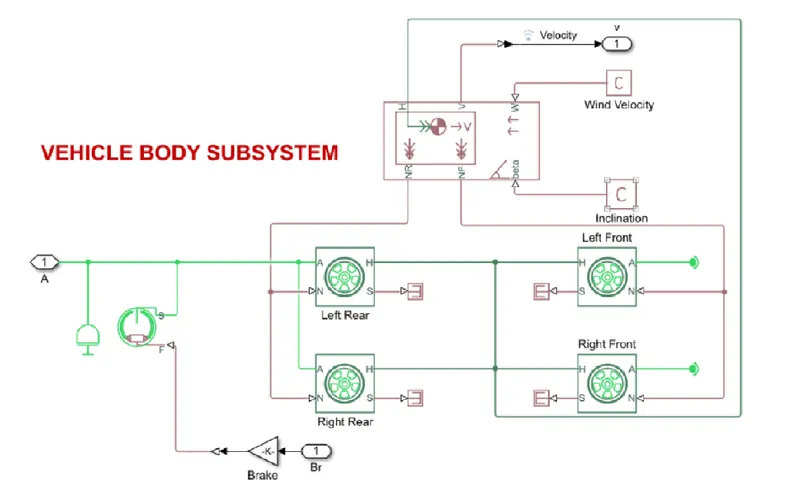
- vehicle transmission vehicle body
- solver configuration blocks
- vehicle transmission vehicle body
- generic engine
- motion sensors
- tyres etc.
- transmission blocs
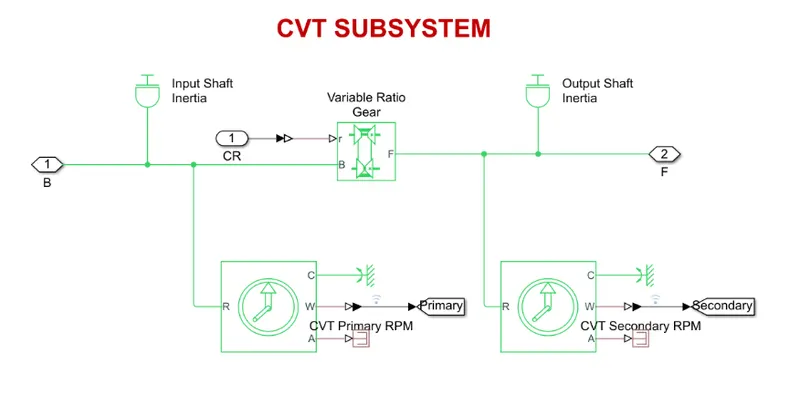
- input and output shaft inertia
- motion sensors
The initial engine speed is given as 210 rpm, mechanical rotation for the driven pulley, and driver pulley values given. The mass of the vehicle as 250 kg and the 2 axles are connected as 4 wheels.
The throttle valve is mainly to control the flow of fuel increases to the IC engine which increases the power of the engine.
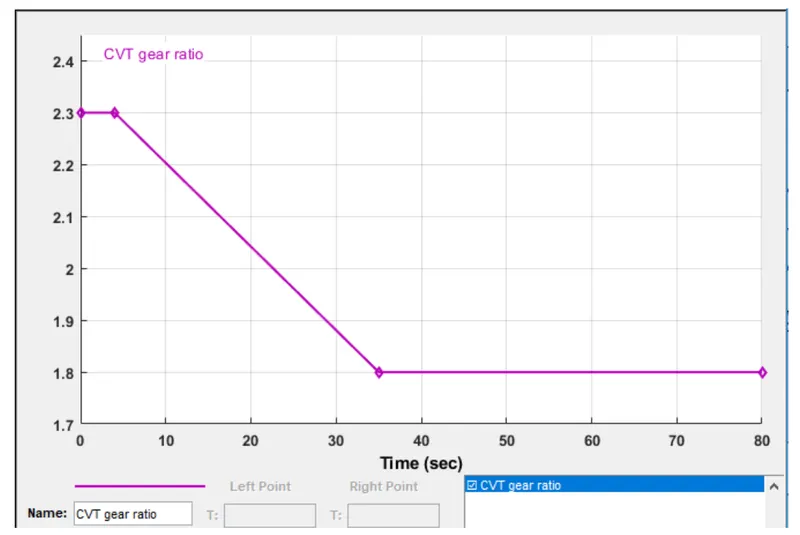
The cylinder can increase or decrease the amount of space between the two sides of the pulley, depending on driving conditions, thereby changing the gear ratio
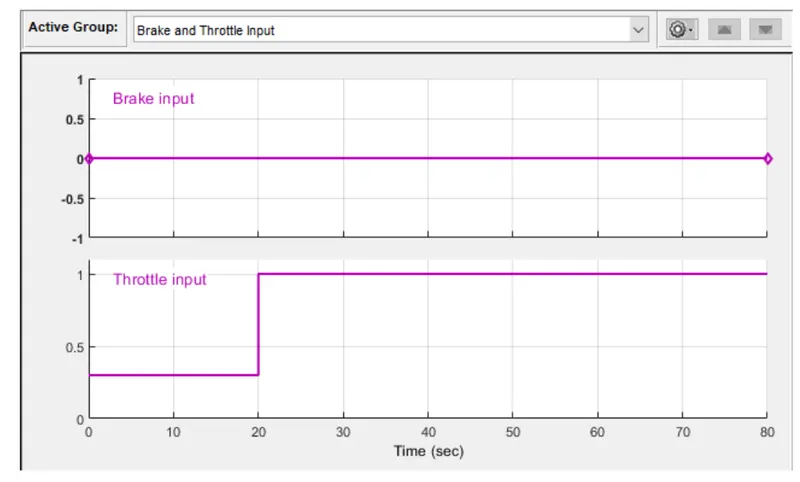
INPUT SIGNAL
CVT GEAR RATIO INPUT
OUTPUT PLOTS
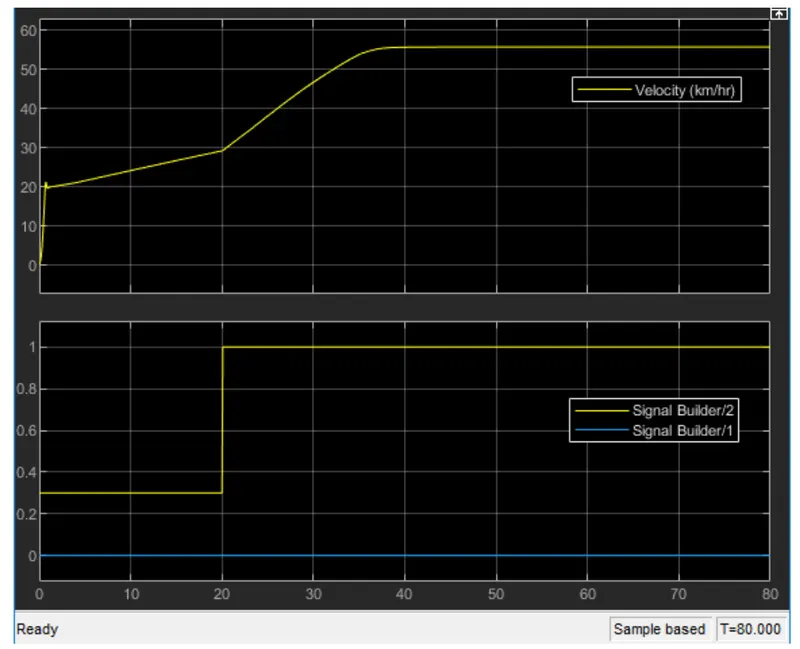
in the above plot, the brake is maintained as constant and increase in throttle which shows an increase in velocity
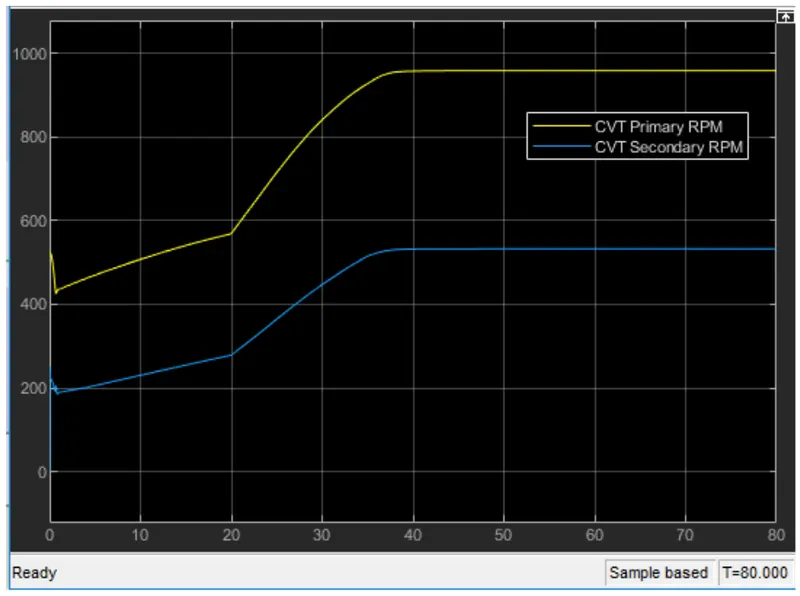
In the above figure, the primary shaft reaches high speed and the secondary shaft at a low rotational speed.
STUDY 2
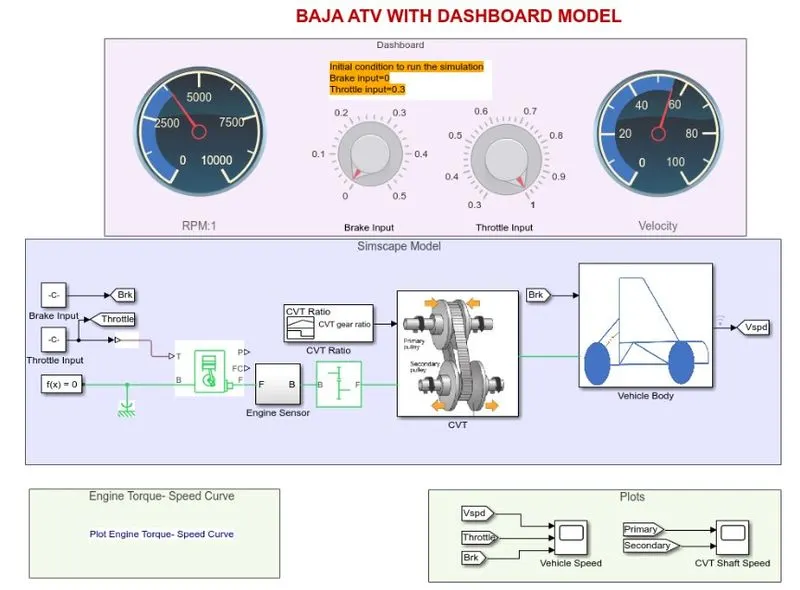
From the above figure baja ATV with a dashboard model which is consists
- throttle meter and brake input
- dashboard
rest of the blocks and subsystems are common in the above baja ATV model without a dashboard.
The main concept of using a dashboard is to study the result by varying the input of the brake and throttle, which shows the velocity and speed of the engine.
OUTPUT PLOTS
Variation of velocity & shaft speed
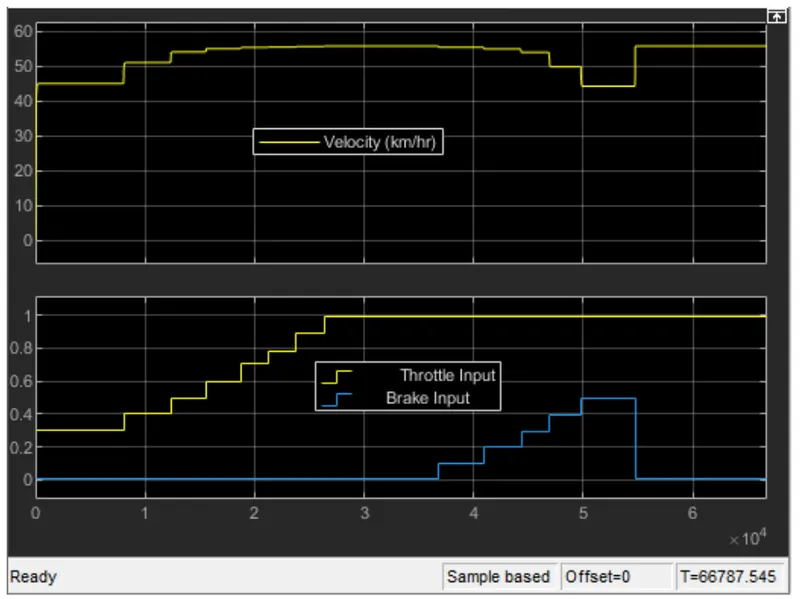
In the above figure the velocity of the vehicle is maintained as constant
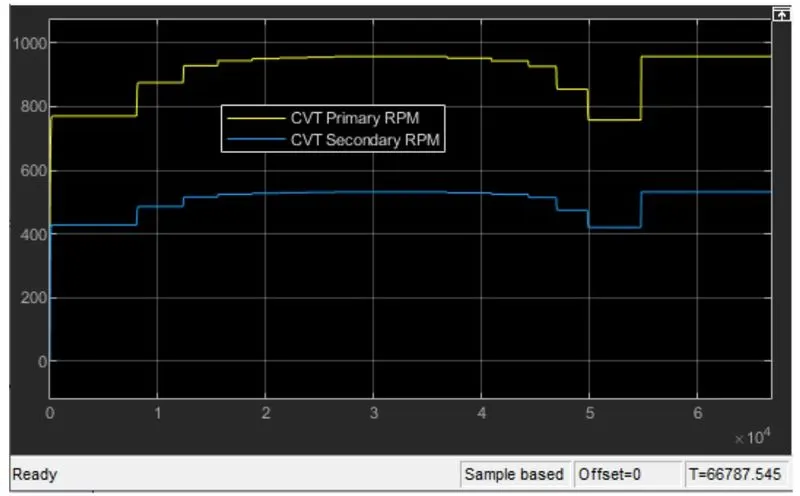
In the above figure, the primary shaft speed increases by increasing throttle and decreasing by increasing brake input value
STUDY -3
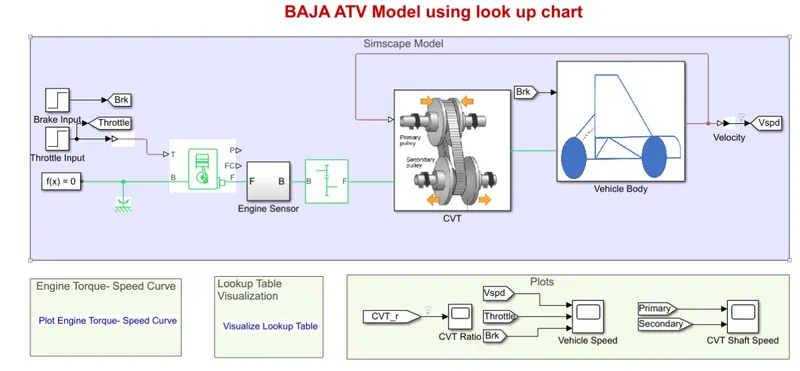
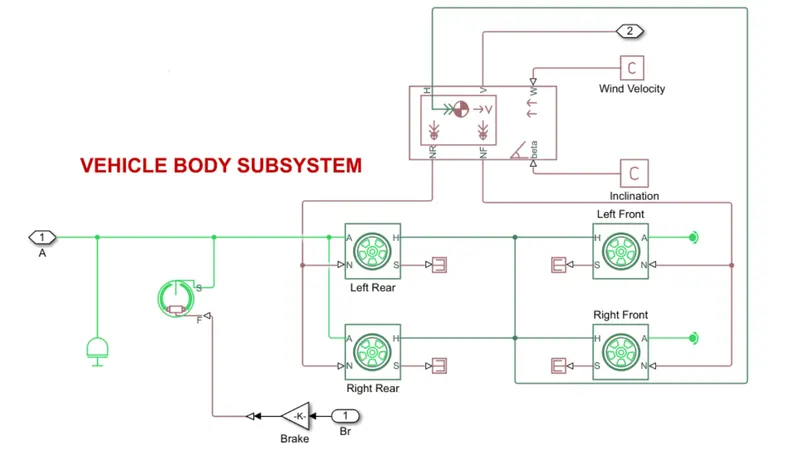
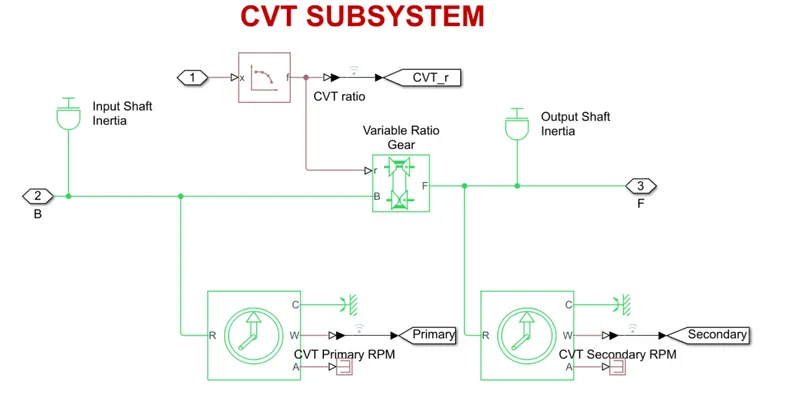
By using the Simulink model of CVT consists of some blocks which are used previously, A lookup table is an array of data that maps input values to output values, thereby approximating a mathematical function. given a set of input values, a lookup operation retrieves the corresponding output values from the table.
The brake input and throttle input is given by step time, which depends on the run time and varies accordingly. By using a lookup table for gear ratio which takes as input to the CVT and works according to the input gear ratio and obtained the output
OUTPUT PLOTS
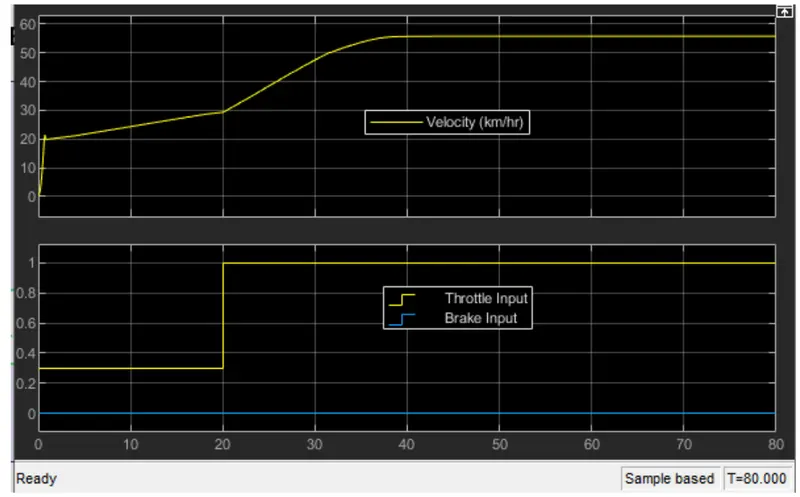
In the above figure, the brake is maintained as constant and increases in throttle which shows an increase in velocity.
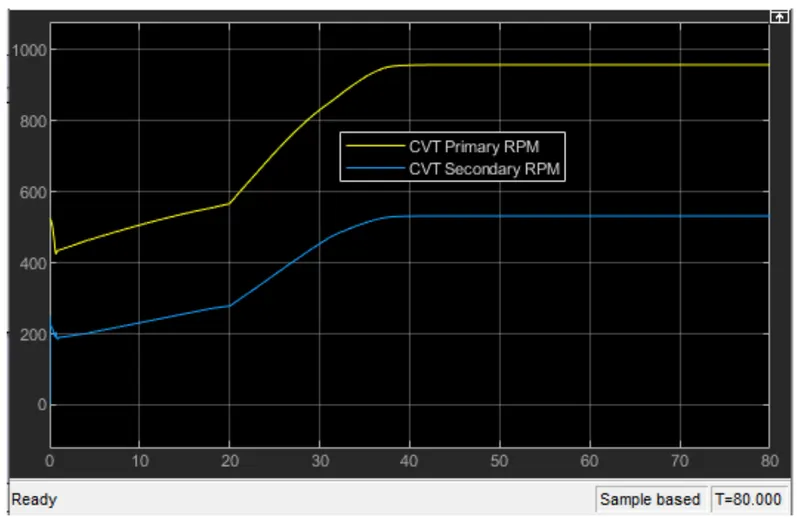
In the above figure, the primary shaft speed increases by increasing throttle and decreasing by increasing brake input value.
STUDY -4
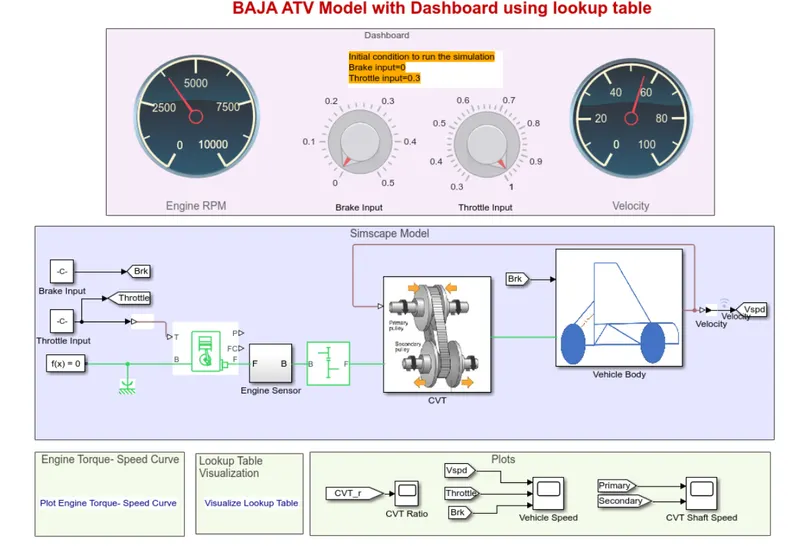
The figure shows BAJA ATV with a dashboard model which consists throttle meter and brake input.
gear ratio is directly proportional to the torque, which increases by increasing the gear ratio.
OUTPUT PLOTS
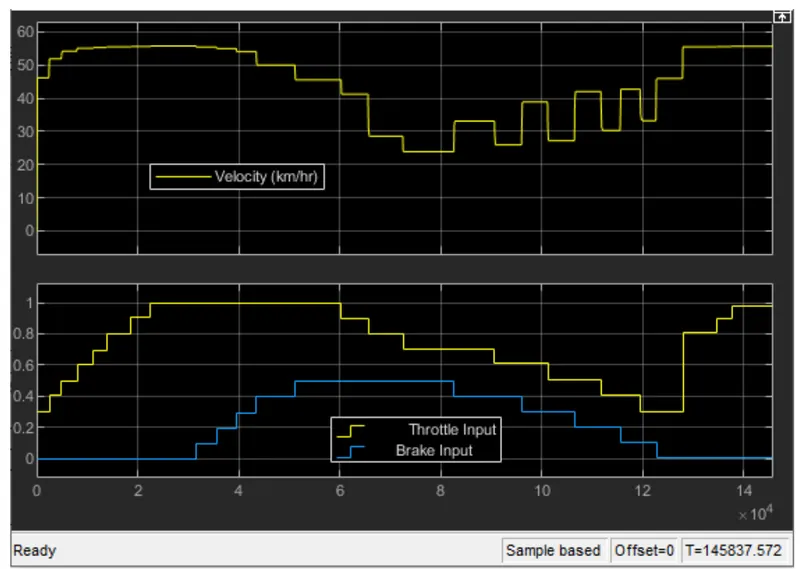
In the above figure, the velocity of the vehivle is maintained as constant for constant throttle value as 0.3 and varying by increasing the value of throttle which increase the velocity of the vehicle.
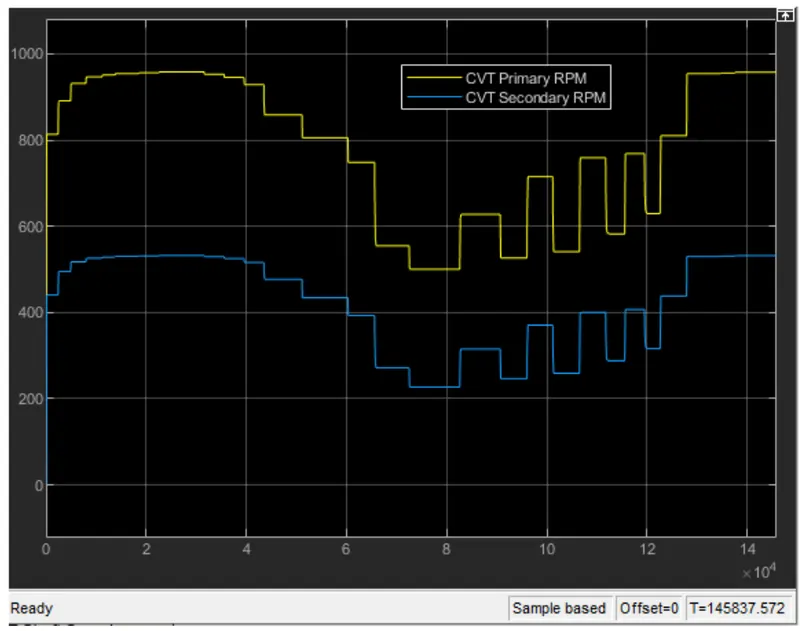
THE throttle value and brake input value can be varying in dashboard, so we can get any particular value for input.
Conclusion:
- Throttle increases the velocity alsoo increases which inturn the power in the engine also increases.
- Brake inpur increases, the velocity decreases and engine power also decreases.
- as the gear ratio increases torque increases which inturn the velocity decreases.