Project 2 Thermal modeling of battery pack
For a 10 cell series lithium ion battery model, simulate the thermal effects and compare life cycle performance at various temperatures, charge & discharge rates using MATLAB.
ANSWER
Battery (Table-Based)
- Library:
-
Simscape / Electrical / Sources
Description
The Battery (Table-Based) block represents a high-fidelity battery model. The block calculates no-load voltage as a function of charge level and optional temperature using lookup tables and includes several modeling options:
-
Self-discharge
-
Battery fade
-
Charge dynamics
-
Calendar aging
Note
The block can use linear or nearest interpolation and extrapolation for all the table based parameters. For rows and columns, it follows the row-column convention, whereas rows are indexed first and, subsequently, columns.
The plot shows a battery whose performance varies with temperature and state of charge changes, as typically found on a datasheet.
Use this block to parameterize batteries with complex no-load voltage behavior from datasheets or experimental results. For a simpler representation of a battery, see the Battery block.
The Battery (Table-Based) block has four modeling variants, accessible by right-clicking the block in your block diagram and then selecting the appropriate option from the context menu, under Simscape > Block choices:
-
Uninstrumented | No thermal port — Basic model that does not output battery charge level and simulates at a fixed temperature. This modeling variant is the default.
-
Uninstrumented | Show thermal port — Model with exposed thermal port. This model does not output internal charge level of the battery.
-
Instrumented | No thermal port — Model with exposed charge output port. This model uses a fixed temperature throughout the simulation.
-
Instrumented | Show thermal port — Model that lets you output internal charge level of the battery. Both the thermal port and the charge output port are exposed.
The instrumented variants have an extra physical signal port that outputs the internal state of charge. Use this functionality to change load behavior as a function of state of charge, without the complexity of building a charge state estimator.
The thermal port variants expose a thermal port, which represents the battery thermal mass.
You can also choose different built-in parameterizations for this block. For more information, see the Predefined Parameterization section.
The battery equivalent circuit is made up of the fundamental battery model, the self-discharge resistance RSD, the charge dynamics model, and the series resistance R0.
Battery Model
The block calculates the no-load voltage, or the voltage across the fundamental battery model by interpolation:
v0=v0(SOC,T)
Where:
-
v0 is the no-load voltage of the battery. Specify the grid of lookup values using the No-load voltage, V0(SOC,T) parameter if tabulating parameters over temperature, or No-load voltage, V0(SOC) otherwise.
-
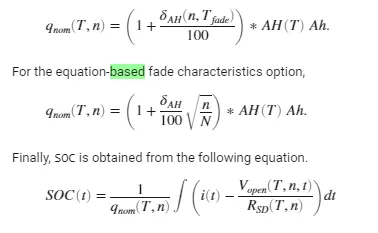
SOCis the ratio of current charge to nominal battery capacity specified in the Ampere-hour rating, AH(T) parameter along with the effects of the temperature dependent fade percentage change in ampere-hour rating, δAH(n, Tfade), specified in the Percentage change in ampere-hour rating, dAH(N, Tfade) parameter. Specify the SOC breakpoints using the Vector of state-of-charge values, SOC parameter. The block estimates the nominal battery capacity based on the number of cycles and the temperature of the battery by interpolating the specified temperature dependent fade characteristics and the Ampere-hour rating, AH(T) parameter.SOCrepresents the normalized data with respect to qnom.For the lookup-table based fade characteristics option,
Where:
-
qnom is the ampere-hour rating of the battery. Specify this value using the Ampere-hour rating, AH(T) parameter.
-
N is the reference number of discharge cycles over which you specify percent change of several battery parameters. Set this value using the Number of discharge cycles, N parameter.
-
n is the present number of cycles of the battery.
-
δAH is the percentage change in ampere-hour rating of the battery after N discharge cycles.
-
T is the battery temperature. Specify the T breakpoints using the Vector of temperatures, T parameter if tabulating the parameters over temperature.
The block also models the series resistance R0 as a function of state of charge and optional temperature. Specify the grid of lookup values for the series resistance using the Terminal resistance, R0(SOC,T) parameter if tabulating the parameters over temperature, or Terminal resistance, R0(SOC) otherwise.
Modeling Self-Discharge
When the battery terminals are open-circuit, it is still possible for internal currents to discharge the battery. This behavior is called self-discharge. To enable this effect, set the Self-discharge parameter to Enabled.
The block models these internal currents with a temperature-dependent resistance RSD(T) across the terminals of the fundamental battery model. You can specify the lookup values for this resistance using the Self-discharge resistance, Rleak(T) parameter if tabulating the parameters over temperature, or Self-discharge resistance, Rleak otherwise.
Modeling Charge Dynamics
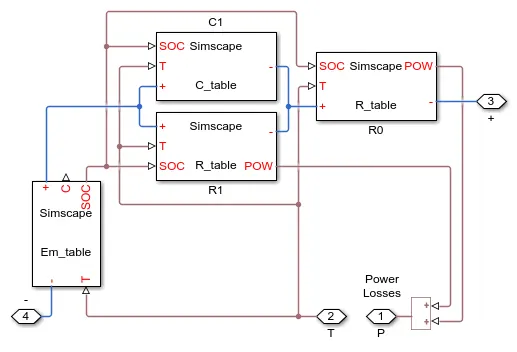
Batteries are not able to respond instantaneously to load changes. They require some time to achieve a steady-state. This time-varying property is a result of battery charge dynamics and is modeled using parallel RC sections in the equivalent circuit.
You can model battery charge dynamics using the Charge dynamics parameter:
-
No dynamics— The equivalent circuit contains no parallel RC sections. There is no delay between terminal voltage and internal charging voltage of the battery. -
One time-constant dynamics— The equivalent circuit contains one parallel RC section. Specify the time constant using the First time constant, tau1(SOC,T) parameter if tabulating parameters over temperature or First time constant, tau1(SOC) otherwise. -
Two time-constant dynamics— The equivalent circuit contains two parallel RC sections. Specify the time constants using the First time constant, tau1(SOC,T) and Second time constant, tau2(SOC,T) parameters if tabulating parameters over temperature or First time constant, tau1(SOC) and Second time constant, tau2(SOC) otherwise. -
Three time-constant dynamics— The equivalent circuit contains three parallel RC sections. Specify the time constants using the First time constant, tau1(SOC,T), Second time constant, tau2(SOC,T), and Third time constant, tau3(SOC,T) parameters if tabulating parameters over temperature or First time constant, tau1(SOC), Second time constant, tau2(SOC), and Third time constant, tau3(SOC) otherwise. -
Four time-constant dynamics— The equivalent circuit contains four parallel RC sections. Specify the time constants using the First time constant, tau1(SOC,T), Second time constant, tau2(SOC,T), Third time constant, tau3(SOC,T), and Fourth time constant, tau4(SOC,T) parameters if tabulating parameters over temperature or First time constant, tau1(SOC), Second time constant, tau2(SOC), Third time constant, tau3(SOC), and Fourth time constant, tau4(SOC) otherwise. -
Five time-constant dynamics— The equivalent circuit contains five parallel RC sections. Specify the time constants using the First time constant, tau1(SOC,T), Second time constant, tau2(SOC,T), Third time constant, tau3(SOC,T), Fourth time constant, tau4(SOC,T), and Fifth time constant, tau5(SOC,T) parameters if tabulating parameters over temperature or First time constant, tau1(SOC), Second time constant, tau2(SOC), Third time constant, tau3(SOC), Fourth time constant, tau4(SOC), and Fifth time constant, tau5(SOC) otherwise.
This diagram shows the equivalent circuit for the block configured with two time-constant dynamics.
In the diagram:
-
R1 and R2 are the parallel RC resistances. Specify these values with the First polarization resistance, R1(SOC,T) and Second polarization resistance, R2(SOC,T) parameters, respectively, if tabulating parameters over temperature or First polarization resistance, R1(SOC) and Second polarization resistance, R2(SOC) otherwise.
-
C1 and C2 are the parallel RC capacitances. The time constant τ for each parallel section relates the R and C values using the relationship C=τ/R. Specify τ for each section using the First time constant, tau1(SOC,T) and Second time constant, tau2(SOC,T) parameters, respectively, if tabulating parameters over temperature or First time constant, tau1(SOC) and Second time constant, tau2(SOC) otherwise.
-
R0 is the series resistance. Specify this value with the Terminal resistance, R0(SOC,T) parameter if tabulating parameters over temperature or Terminal resistance, R0(SOC) otherwise.
Depending on how you have configured the block, the resistances might include:
-
The series resistance — Specify the percent change over N cycles using the Change in terminal resistance after N discharge cycles (%) parameter.
-
The self-discharge resistance — Specify the percent change over N cycles using the Change in self-discharge resistance after N discharge cycles (%) parameter.
-
The first charge dynamics resistance — Specify the percent change over N cycles using the Change in first polarization resistance after N discharge cycles (%): parameter.
-
The second charge dynamics resistance — Specify the percent change over N cycles using the Change in second polarization resistance after N discharge cycles (%) parameter.
-
The third charge dynamics resistance — Specify the percent change over N cycles using the Change in third polarization resistance after N discharge cycles (%) parameter.
-
The fourth charge dynamics resistance — Specify the percent change over N cycles using the Change in fourth polarization resistance after N discharge cycles (%) parameter.
-
The fifth charge dynamics resistance — Specify the percent change over N cycles using the Change in fifth polarization resistance after N discharge cycles (%) parameter.
Note
You can also model the battery fade characteristics by using lookup tables (temperature independent) or lookup tables (temperature dependent). Choosing any of these two options changes the blocks parameters accordingly. For more information, see the Fade parameters tab.
Modeling Thermal Effects
For thermal variants of the block, the battery temperature is determined from a summation of all the ohmic losses included in the model:
`M_(th)dotT=sum_iV_(T.i^2)/R_(T.i)`
Where:
-
Mth is the battery thermal mass.
-
i corresponds to the ith ohmic loss contributor. Depending on how you have configured the block, the losses might include:
-
The series resistance
-
The self-discharge resistance
-
The first charge dynamics segment
-
The second charge dynamics segment
-
The third charge dynamics segment
-
The fourth charge dynamics segment
-
The fifth charge dynamics segment
-
-
VT,i is the voltage drop across resistor i.
-
RT,i is resistor i.
Modeling Battery Aging
You can model the battery performance deterioration that occurs when the battery is not used. Calendar aging affects both the internal resistance and capacity. In particular, the resistance increase depends by various mechanisms such as the creation of Solid Electrolyte Interface (SEI) at both anode and cathode and the corrosion of the current collector. These processes mainly depends on the storage temperature, the storage state of charge, and time.
You can model the calendar aging in the Battery (Table-Based) block by setting the Calendar aging model parameter to:
-
Equation-based -
Tabulated: temperature -
Tabulated: time and temperature
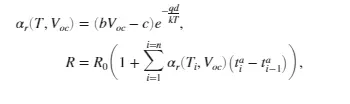
This equation defines the terminal resistance increase of the battery due to calendar aging:
where:
-
Voc is the Normalized open-circuit voltage during storage, V/Vnom.
-
R0 is the Internal resistance.
-
ti is the time sample derived from the Vector of time intervals parameter.
-
Ti is derived from the Vector of temperatures parameter.
-
b is the Linear scaling for voltage, b.
-
c is the Constant offset for voltage, c.
-
d is the Temperature-dependent exponential increase, d.
-
a is the Time exponent, a.
-
q is the electron's elementary charge, in C.
-
k is the Boltzmann constant, in J/K.
If you set the Storage condition parameter to Specify state-of-charge during storage, the block converts the state of charge during storage into normalized open-circuit voltage using the tabulated voltage V0 against the state of charge and the temperature during storage.
The aged terminal resistance is the product between the terminal resistance, R0(SOC,T), the percentage resistance increase, dR0, and the power law that describes the time dependence of the calendar aging:

where:
-
T is the battery temperature. Specify the T breakpoints using the Vector of temperatures, T parameter if tabulating the parameters over temperature.
-
Tst is the Vector of storage temperatures.
-
tst,i and tst,i-1 are the time samples derived from the Vector of time intervals.
-
t0 is assumed to be null.
-
tst,m is the moment in time at which the resistance increase, dR0, is measured.
Predefined Parameterization
There are multiple available built-in parameterizations for the Battery (Table-Based) block.
This pre-parameterization data allows you to set up the block to represent components by specific suppliers. The parameterizations of these batteries match the manufacturer data sheets. To load a predefined parameterization, click on the Select a predefined parameterization hyperlink in the Battery (Table-Based) block mask and select the part you want to use from the list of available components.
The available pre-parameterized data model steady state electrical parameters of a lithium-ion battery. The change in series resistance with the battery cycle life, the thermal mass, and the dynamic RC network parameters are not parameterized. Instead, the net resistance of the RC network resistors is summed to the series resistance of the specific pre-parameterized data. If you need to fill the RC parameter data, subtract the net RC network resistance from the series resistance data.
The available data is parameterized for 1C discharge current for up to 99% of the depth of discharge. Simple fading parameters are given for single temperature.
MODELLING & EXPLANATION
This example shows how to simulate a battery pack consisting of multiple series-connected cells in an efficient manner. It also shows how a fault can be introduced into one of the cells to see the impact on battery performance and cell temperatures. For efficiency, identical series-connected cells are not just simply modeled by connecting cell models in series. Instead a single cell is used, and the terminal voltage scaled up by the number of cells. The fault is represented by changing the parameters for the Cell 10 Fault subsystem, reducing both capacity and open-circuit voltage, and increasing the resistance values.
Model
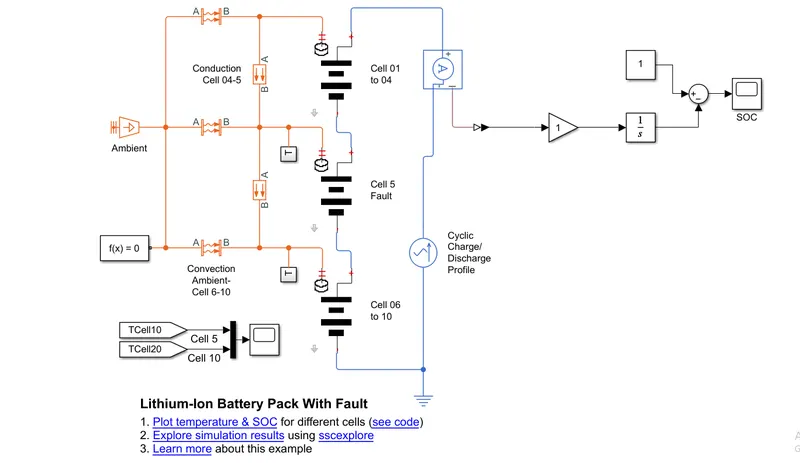
in this ckt we use li-ion cell 1 to 10 , temperature sensors ,ambient temp block , state of charge estimation scope, charge discharge profile given to cktfrom & goto block block matlab simulink
Cell 01 to 04 Subsystem
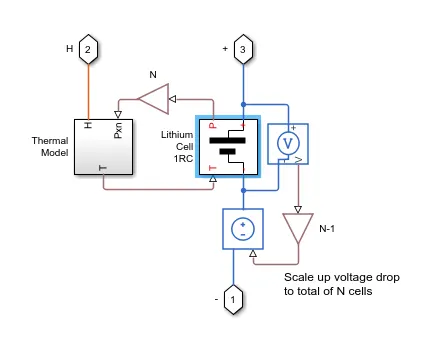
THERMAL MODEL subsystem
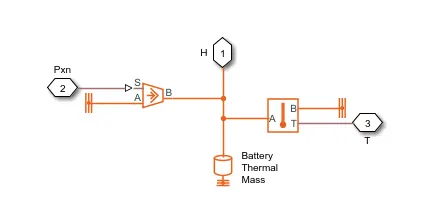
Cell subsystem basically consist of a Thermal Model and Lithium Cell 1RC block which calculate the temperature and thermal effect for cells and overall calculate for the battery pack.
Lithium Cell 1RC Subsystem
Results
Thermal effects and compare life cycle performance at various temperatures, SOC.
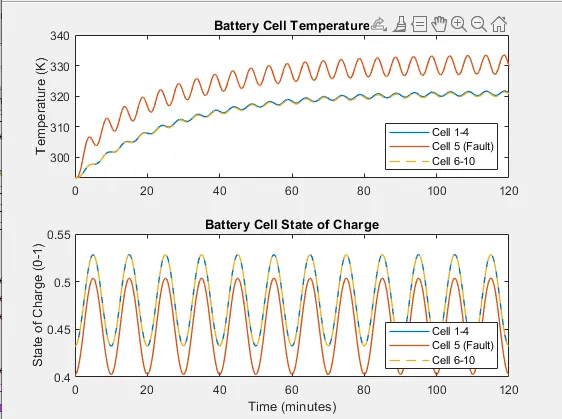
Change the temperature to the different temperatures and observe the thermal effects , SOC.
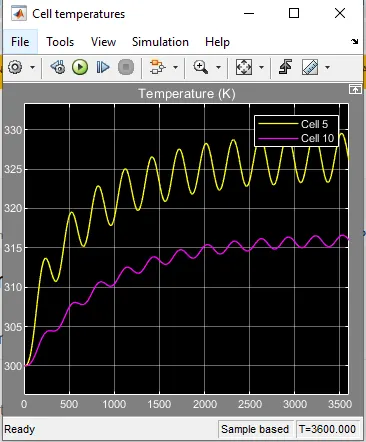
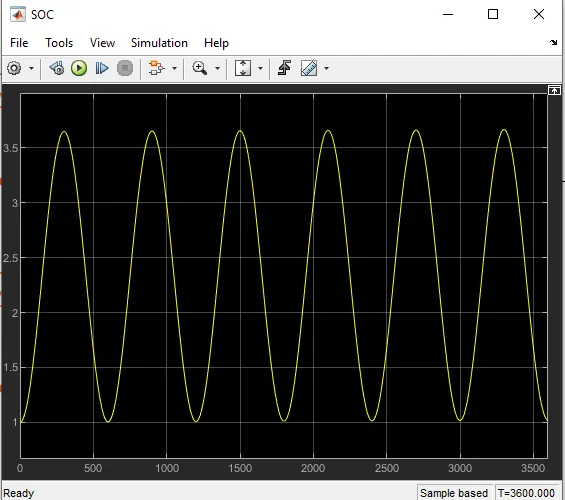
At 300k temperature.
In the below fig. the cell 5 is more than the cell 10 because the cell 5 is with fault. Temperature of cell 5 reaches to 330k and cell 10 reaches to 315 k. and SOC
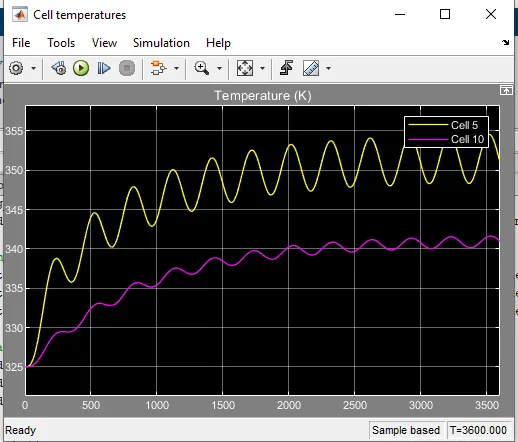
At 325k temperature.
In the below fig. the cell 5 is more than the cell 10 because the cell 5 is with fault. Temperature of cell 5 reaches to 355k and cell 10 reaches to 345 k. and SOC
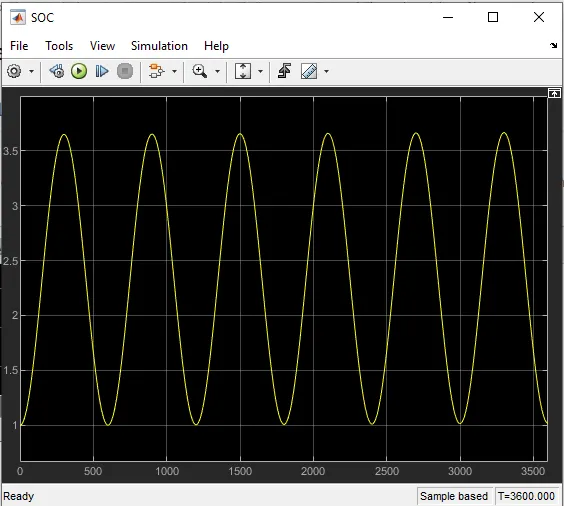
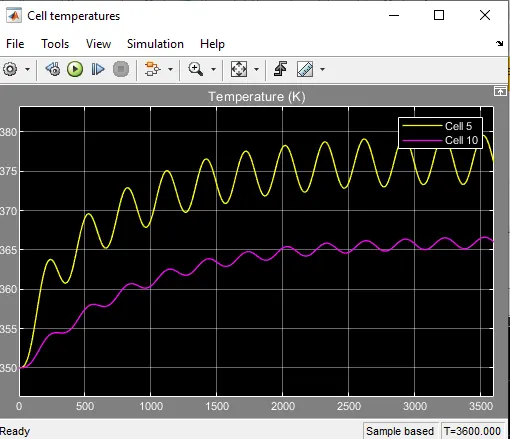
AT 350k temperature.
In the below fig. the cell 5 is more than the cell 10 because the cell 5 is with fault. Temperature of cell 5 reaches to 380k and cell 10 reaches to 360 k. and SOC
Conclusion
Hence 10 cell series lithium ion battery model, simulate the thermal effects and compare life cycle performance at various temperatures, charge & discharge rates using MATLAB is completed.