Week-4 Challenge WOT Condition Part-2
- What is the difference between mapped and dynamic model of engine, motor and generator? How can you change model type?
- How does the model calculate miles per gallon? Which factors are considered to model fuel flow?
- Run the HEV ReferenceApplication with WOT drive cycle. Change the grade and wind velocity in the environment block. Comment on the results.
- Keeping all other parameters same, compare the simulated results of hybrid and pure electric powertrains.
Answers
1.The difference between mapped and dynamic model of engine, motor and generator and to change model type.
Mapped model:
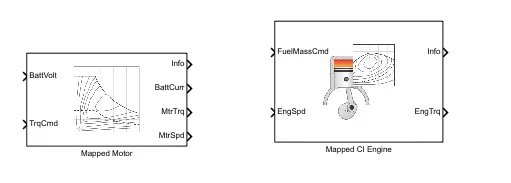
Model uses a set of steady-state lookup tables to characterize engine performance.
The Mapped Motor block implements a mapped motor and drive electronics operating in torque-control mode. The output torque tracks the torque reference demand and includes a motor-response and drive-response time constant. Use the block for fast system-level simulations when you do not know detailed motor parameters, for example, for motor power and torque tradeoff studies. The block assumes that the speed fluctuations due to mechanical load do not affect the motor torque tracking.
The Mapped CI Engine block implements a mapped compression-ignition (CI) engine model using power, air mass flow, fuel flow, exhaust temperature, efficiency, and emission performance lookup tables. You can use the block for:
-
Hardware-in-the-loop (HIL) engine control design
-
Vehicle-level fuel economy and performance simulations
The lookup tables, developed with the Model-Based Calibration Toolbox™, are functions of injected fuel mass, F, engine torque, T, engine speed, N, and engine temperature, TempEng.
|
Input Command Setting |
Input Engine Temperature Parameter Setting |
Lookup Tables |
|---|---|---|
Fuel mass |
off |
ƒ(F,N) |
on |
ƒ(F,N,TempEng) | |
Torque |
off |
ƒ(T,N) |
on |
ƒ(T,N,TempEng) |
The tables provide overall engine characteristics, including actual torque, fuel flow rate, BSFC, and engine-out exhaust emissions.
Dynamic models:
Model decomposes the engine behavior into engine characteristics that are separated into lower-level components. By combining components in this way, the models capture the dynamic effects.
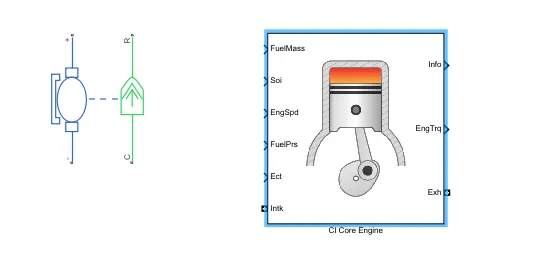
To change the model type :
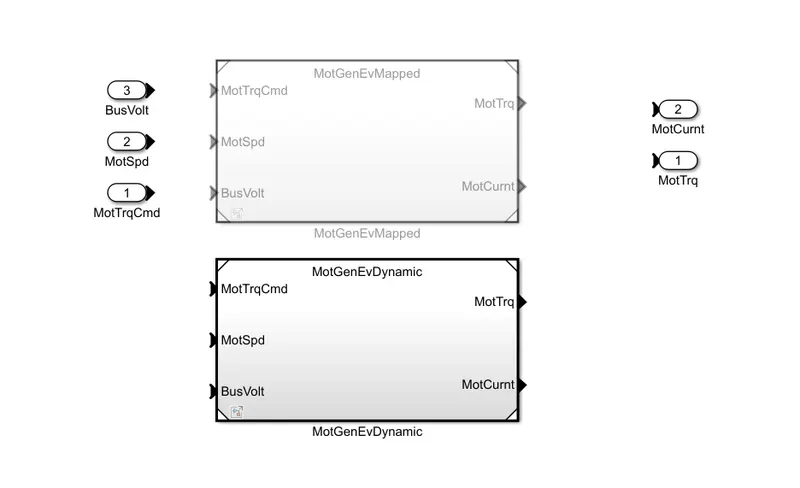
- Here I considered pure electric model ,in the motor subsystem two blocks are used one is Mapped motor and dynamic motor.To change mapped to dyanamic or dyanamic to mapped blocks.
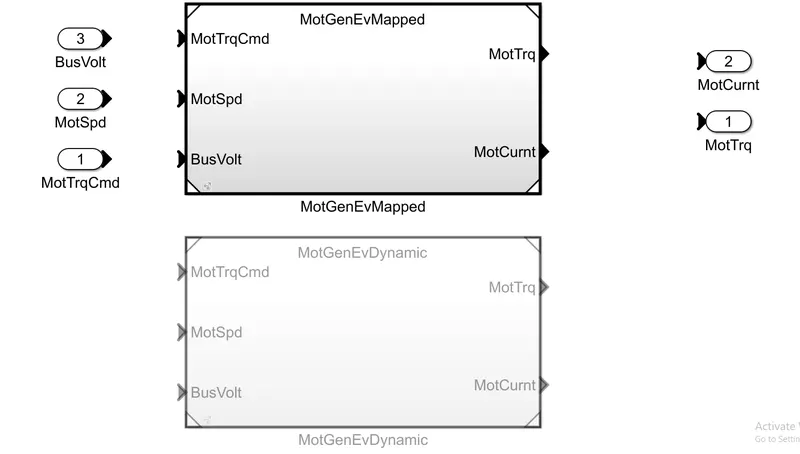
- Right click on any open space
variant->Label Mode Active choice->MotGenEvdyanamic.
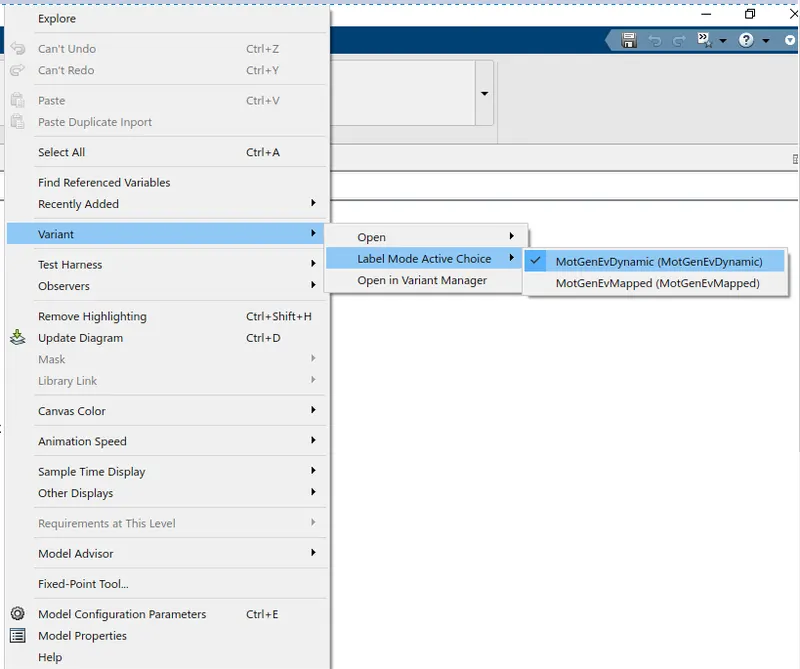
- After activation of dynamic block ,dynamic motor only work and mapped motor will kept idle.
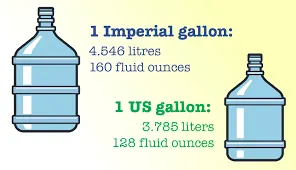
2.To known how does the model calculate miles per gallon and Which factors are considered to model fuel flow.
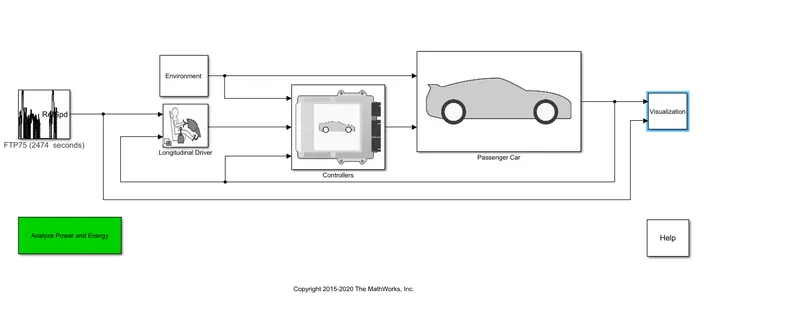
Consider a conventional vehicle model , click on the 'visualization' subsystem.
In that subsystem click on 'performance calcaulations'.
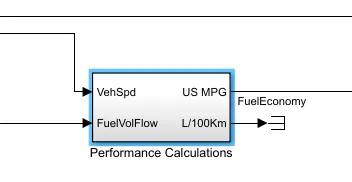
It shows the below fig. So let see the calculations. 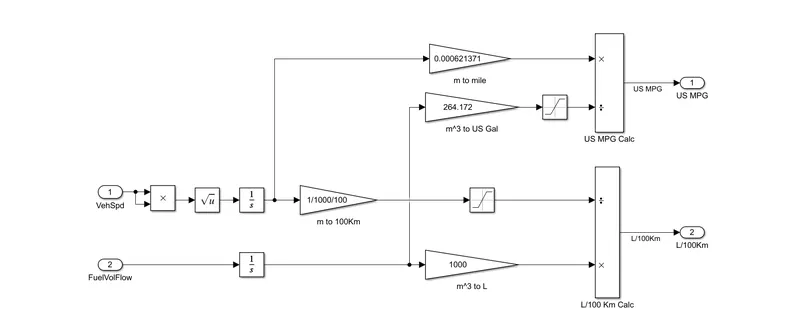
- First the speed is in 'meters' convert to mile by multipling '0.000621371'. meter changes to miles.
- The volume of fuel is in 'Cubic meter' change to gallons by multipling with '264.172'. volume changed to gallon.
- miles per gallon (mpg) is given by output 1'.US MPG'.
- second meter is convert to the 100 km by dividing '1000' and agian divide by 100. meter to 100km.
- volume of fuel change cubic meter to litres by multipling '1000'.
- Step signal is used here to convert negative to positive signal.
- litres per 100km represents the fuel flow rate. which is second output 'L/100km'.
FACTORS OF THE FUEL FLOW RATE:
- Vehicle speed
- environmental conditions like gradeability,wind speed,...etc.
3.The HEV ReferenceApplication with WOT drive cycle. Change the grade and wind velocity in the environment block. Comment on the results.
HEV
hybrid electric vehicles (HEVs) are powered by an internal combustion engine in combination with one or more electric motors that use energy stored in batteries. HEVs combine the benefits of high fuel economy and low tailpipe emissions with the power and range of conventional vehicles.
Take the model of HEV .Change drive cycle to WOT.
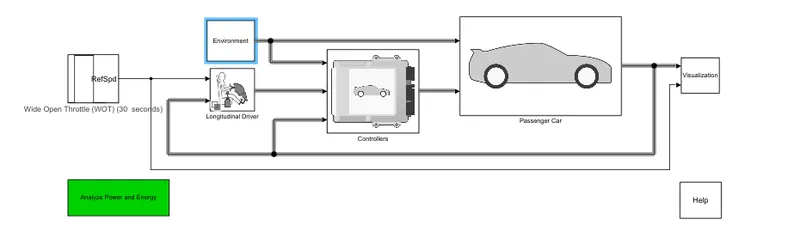
These are outputs before changing the grade and wind velocity.
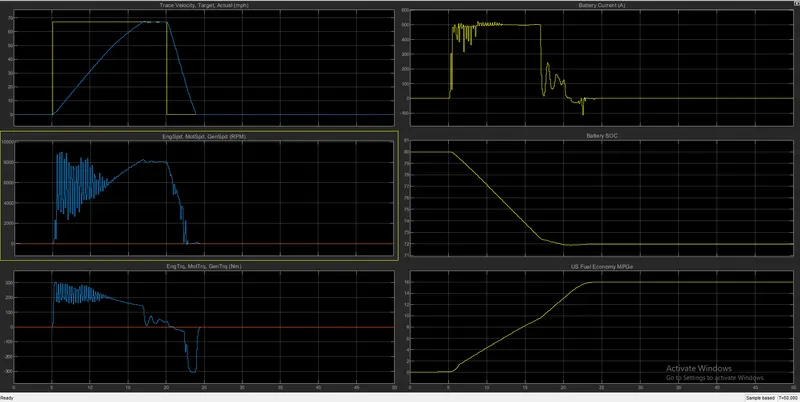
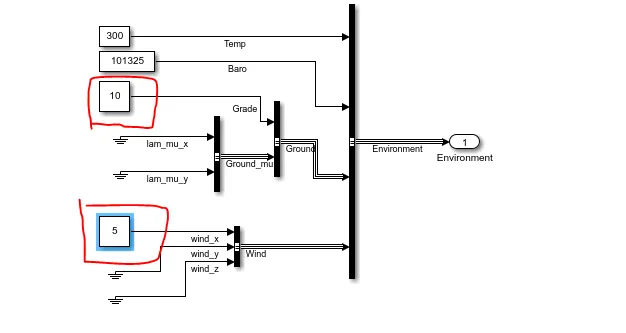
Goto the environment subsystem, change the grade and wind velocity and observe the output.
These are the outputs , it shows a huge difference in performance of vehicle before and after changing the grade and wind velocity. 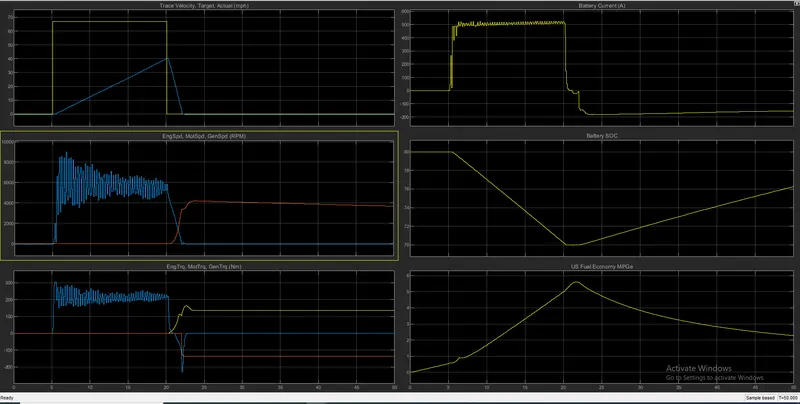
Differences
- First plot speed of the vehicle is reduced approximately to half of the speed.
- Second plot regenerative brakes are applied,so the generator speed in rise (orange).
- Third plot shows the Torques of engine ,motor and generator
- Fourth plot represents current of the battery.
- Fiveth plot represents state of charge there is a rise after 22 secs
- Sixth plot shows fuel economy which is fall to 5.5 mpg previously 16mpg.
4. Keeping all other parameters same, compare the simulated results of hybrid and pure electric powertrains.
Open matlab documentation and search for power train.
select two models one is pure EV vehicle and other is HEV vehicle
PURE EV VEHICLE
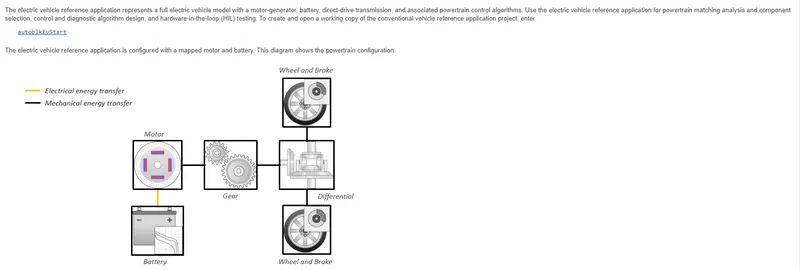
Pure EV model
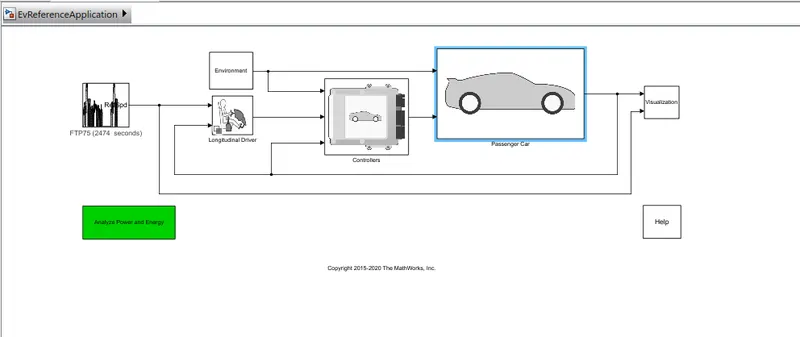
click on passenger car subsystem ,we can see only electric plant and drive train blocks.
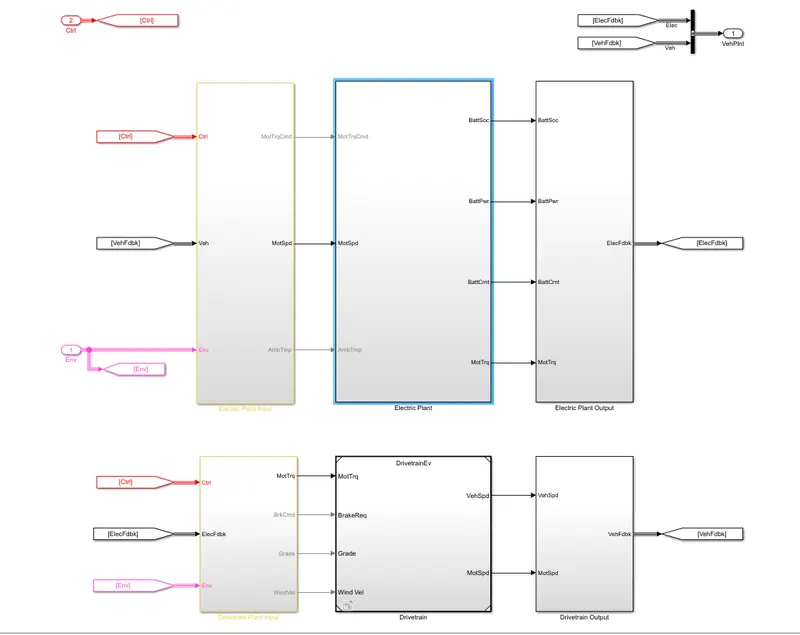
Further click on the electric plant , below motor and battery blocks are visible.
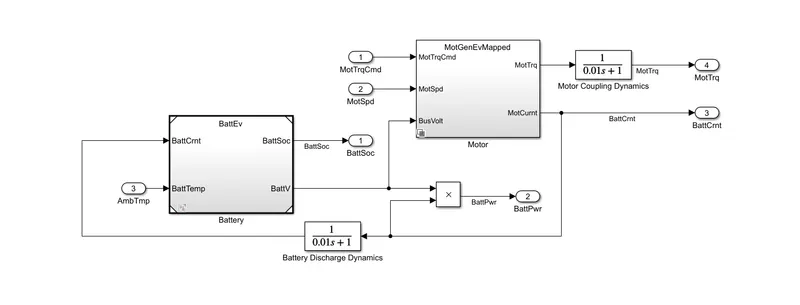
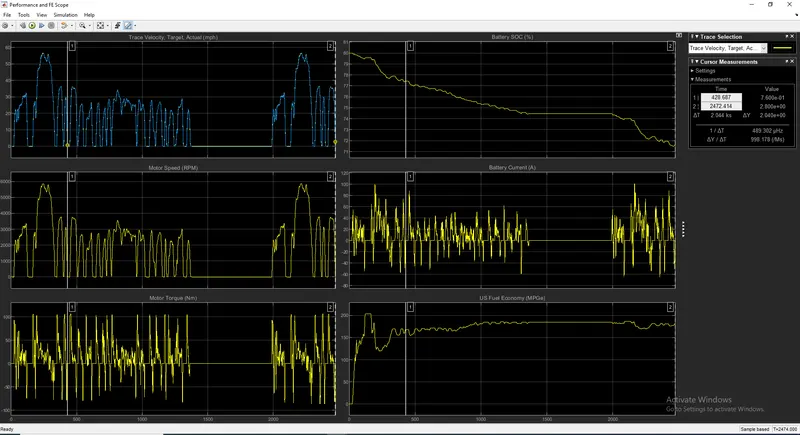
Without changing any parameters run the model and observe the outputs.All the graphs related to motor .
- First plot is trace velocity and actual speed of the vehicle.
- second plot is about the motor speed.
- Third plot is motor torque
- Fourth plot is state of charging reduced to 80% to 70% .
- Fiveth plot is current flow of the battery.
- Sixth plot is fuel economy is 180-200mpg which very great one in electric domain.
Hybrid electric vehicle.
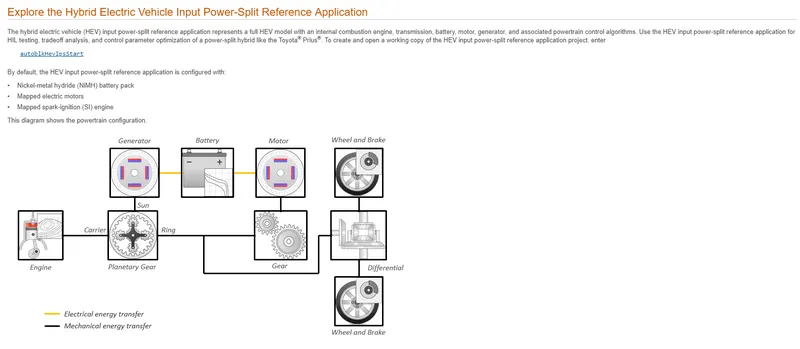
This is HEV vehicle model:
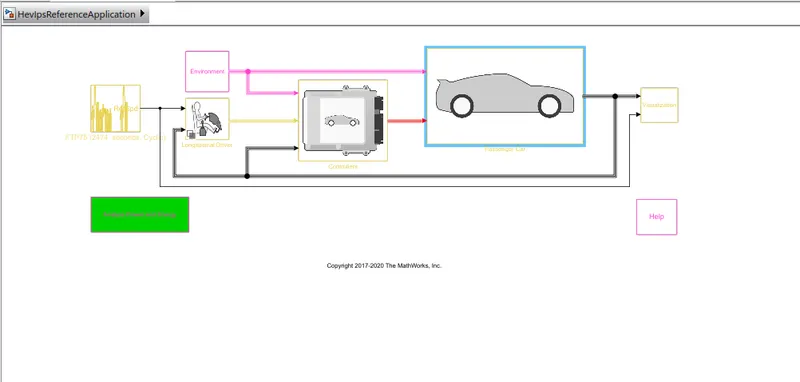
Click 'passenger car'.engine , drivetrain and electric blocks are used. 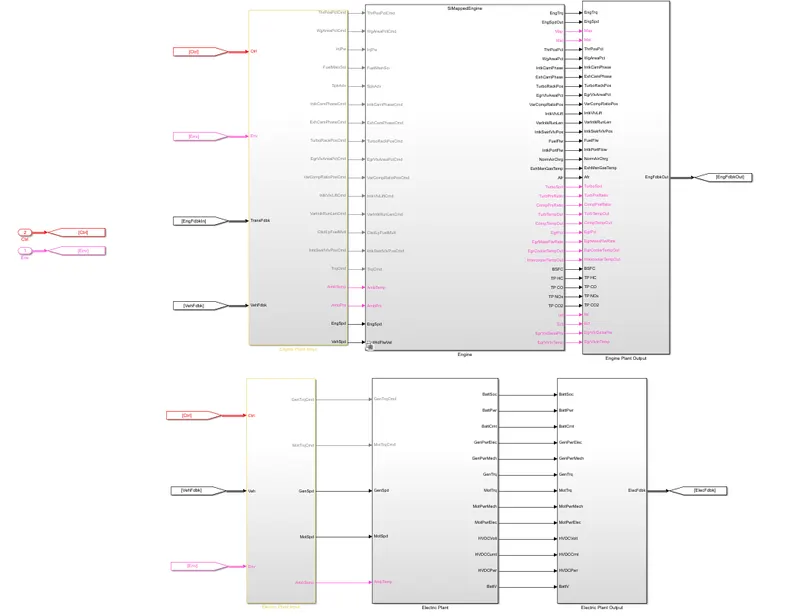
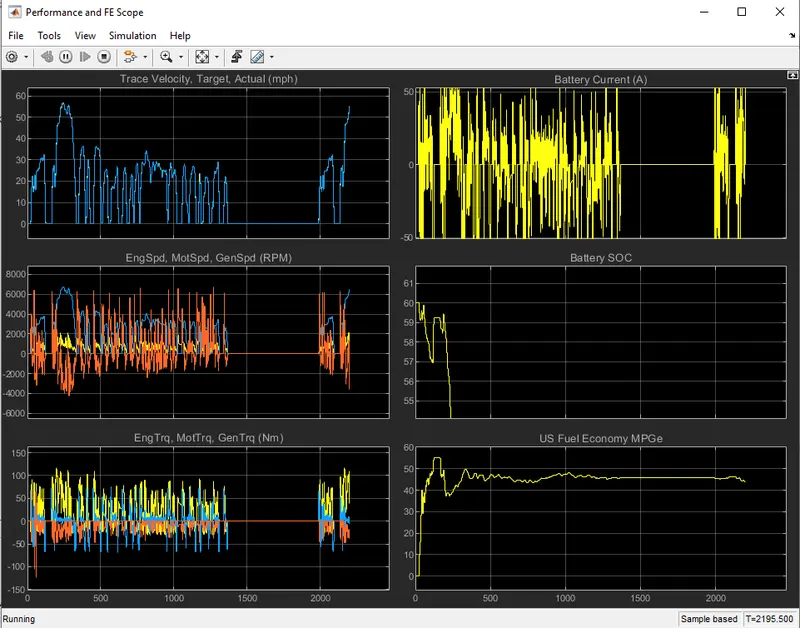
output of the HEV vehicle and observe the graphs
- Trace velocity of the model is in the first plot.
- IN the second plot motor,engine and generator speeds are shown.
- In third plot engine,generator and motor torques are represented.
- In the fourth plot battery current is shown between 50A t0 -50A.
- Fiveth plot state of charge is fallen at 250secs.After those secs engine only take part in the powertrain.
- Sixth plot shows fuel economy which is betweeen 40 -60 mpg.Fuel economy is more in pure EV model.
Conclusions:
1.The difference between mapped and dynamic model of engine, motor and generator and how can you change model type is done success fully.
2. The model calculate miles per gallon is explained and factors are considered to model fuel flow are mentioned.
3.Run the HEV ReferenceApplication with WOT drive cycle. Change the grade and wind velocity in the environment block. Comment on the results are done completely.
4.Keeping all other parameters same, compare the simulated results of hybrid and pure electric powertrains is done fairly..